A gut-on-a-chip incorporating human faecal samples and peristalsis predicts responses to immune checkpoint inhibitors for melanoma
Main
Since their introduction in the clinic, immune checkpoint inhibitors (ICIs) have achieved unprecedented and durable results in the treatment of cancers, especially in the case of melanoma1,2,3,4,5,6. ICIs act on inhibitory signalling pathways that have evolved to restrain uncontrolled inflammatory responses that, in pathologic conditions, are exploited by the tumour to evade immune surveillance7,8. The prototypes of ICIs are monoclonal blocking antibodies directed against surface receptors expressed on T cells (such as programmed cell death protein 1, PD-1; and cytotoxic T-lymphocyte-associated protein, CTLA-4) or on antigen presenting cells and tumours (such as programmed death-ligand 1, PD-L1) that enhance antitumour immunity. After over a decade, patient responses to ICIs remain heterogeneous9, and questions persist about optimal combinations and toxicities10,11.
In addition to tumour-intrinsic mechanisms, the gut microbiome has emerged as a major tumour-extrinsic factor able to predict and drive immunotherapy outcomes12,13,14,15. The gut microbiome includes the genes and metabolic functions of bacteria, archaea, viruses, fungi and protists in the intestine16,17,18. It is spatially and functionally restrained by the intestinal mucosa, which acts as a physical barrier against pathogens while contributing to the beneficial homeostatic interplay between microbiota and the immune system19. Perturbation of the gut homeostasis can impair epithelial cell–cell adhesions, favour pathogens’ translocation and lead to a state of chronic inflammation19,20,21,22 that may influence antitumour immunity and responses to therapy, especially ICI treatment23. Yet, there is no clinical indication for prescribing an intestinal biopsy during immunotherapy, which limits the investigation of molecular mechanisms underlying microbiome–host crosstalk in situ and the possibility to discriminate the role played by the intestinal epithelial cells from other components of the microenvironment.
In this regard, mouse models are broadly used as preclinical experimental systems, but their value in translational research is limited by anatomical, functional, immunological and microbial differences with humans24,25,26,27, in addition to their high cost, experimental time and ethical concerns. As an alternative, the three-dimensional (3D) culture of primary human intestinal organoids28 offers greater cellular heterogeneity and architectural complexity compared with conventional two-dimensional (2D) cell culture, but they cannot be easily exposed to controlled peristaltic-like motions, microorganisms or drugs. Indeed, due to their inverted structural arrangement, the apical compartment is enclosed within the lumen and has an altered environment and limited access25,29,30. Microfluidic-based approaches overcome most of these limitations, and their miniaturization reduces quantities of samples and reagents and enables detection at high resolution and sensitivity, with scalable throughput and shorter data processing and analysis31,32,33.
In this Article, we present a system that mimics the architecture and functionality of the human intestine and that is suitable for studying microbiome–host interactions. It relies on intestinal cells co-cultured with microvascular endothelial cells on a compartmentalized microfluidic 3D system actuated with a peristaltic-like motion. We employ it to dissect the effects, in their intestine, of the microbiota of patients with melanoma who are responsive or non-responsive to immunotherapy, and provide mechanistic insights.
Results
Development of the gut-on-a-chip
Human gut-on-a-chip models currently address one or a few aspects of the intestinal epithelial physiology, either enabling co-culturing multiple cell types, using extracellular matrix (ECM) for compartmentalization, applying shear forces and mechanical stretch, or providing ready access to the luminal spaces for experimental perturbations25,34,35. Leveraging on proprietary actuation technology36,37, we developed a gut-on-a-chip model that integrates them all-in-one and is suitable for real-time multiomic detections. The model consists of an intestinal channel and a vascular compartment separated by an ECM-like gel layer (Fig. 1a,b; see Methods for details). While the intestinal channel is seeded with either human induced pluripotent stem cell (hiPSC)-derived organoids or a co-culture of Caco-2 and HT-29 MTX, the vascular compartment is formed by human microvascular endothelial cells (HMEC-1), which retain the morphologic, phenotypic and functional characteristics of the normal human microvascular endothelium while offering the advantages of an immortalized cell line38.
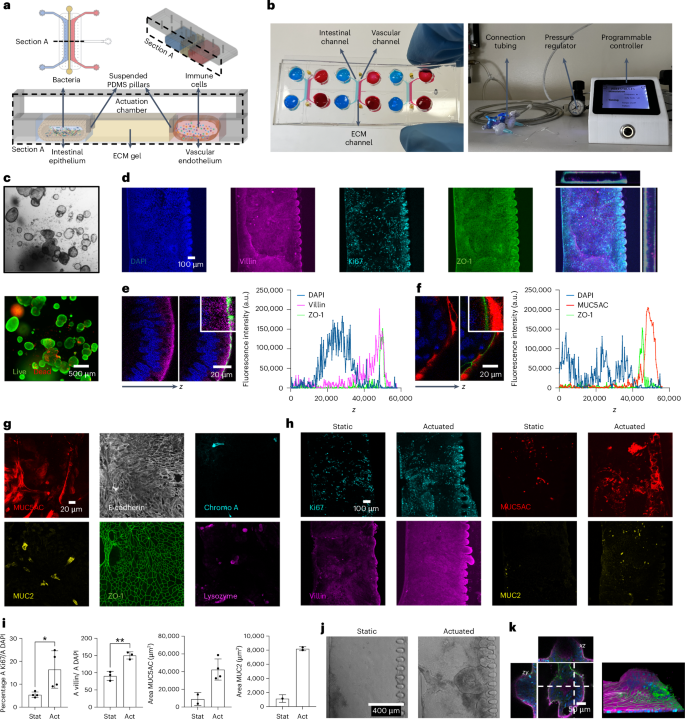
a, The device is composed of an intestinal epithelial channel and a vascular endothelial channel separated by ECM-like gel; a superimposed actuation chamber allows cyclic controlled deformation of the construct that mimics peristalsis. PDMS, polydimethylsiloxane. b, Microfluidic device and external actuation system. c, Brightfield and live/dead fluorescence image of hiPSCs-derived organoids in plate. d, Representative confocal images (n = 13 in 2 independent experiments) of intestinal cells from disaggregated hiPSCs-derived organoids after 9 days of culture on chip. DAPI (blue), ZO-1 (green), Ki67 (cyan) and villin (magenta). e,f, Epithelial cells polarization from disaggregated organoids. Representative confocal image and fluorescence intensity plot on z axis of nuclei (DAPI, blue) and apical occludins (ZO-1, green) in combination either with villin (magenta, e) or MUC5AC (red, f). g, Representative confocal images (n > 4 in 2 independent experiments) of the different intestinal cell lineages from disaggregated hiPSCs-derived organoids after 9 days of culture on chip. MUC5AC (red), MUC2 (yellow), E-cadherin (white), ZO-1 (green), chromogranin A (cyan, Chromo A) and lysozyme (magenta). Chromo A, chromogranin A. h,i, Fluorescence microscopy images (h) and quantification (i) of Ki67 (cyan), villin (magenta), MUC5AC (red) and MUC2 (yellow) in static versus actuated chips. Mechanical actuation resulted in increased proliferation (Ki67, nstatic = 4, nactuated = 4, P = 0.0368), maturation (villin, nstatic = 3, nactuated = 3, P = 0.0035) and mucus production (MUC5AC, nstatic = 2, nactuated = 4; MUC2, nstatic = 1, nactuated = 2). Bars represent mean ± s.d., two-tailed unpaired t-test. *P ≤ 0.05; **P ≤ 0.01. A, area; Stat, static chips; Act, actuated chips. j, Representative brightfield images (n > 8 in 2 independent experiments) of epithelial cells from disaggregated hiPSCs-derived organoids cultured in static versus actuated conditions highlighting the formation of 3D villi-like structures. k, Representative confocal images (n = 13 in 2 independent experiments) and 3D reconstruction of villi-like structure on chip. Dashed lines indicate the axis along with the (x,z) and (z,y) confocal images used for the reconstructions where taken.
Mechanical actuation shapes intestinal epithelium
The use of hiPSC-derived intestinal organoids (Fig. 1c) on a chip would potentially enable tailored studies on any healthy participant or patient, with the advantage of allowing access to both the apical and the basal epithelial compartments39,40,41,42. Thus, we adapted previous methods to seed our device with hiPSC-derived intestinal organoids (Methods and Extended Data Fig. 1a), obtaining a proliferating (Ki67) and polarized (apical localization of villin and of the zonula occludens-1 protein, ZO-1) intestinal barrier (Fig. 1d–f) populated with different physiologically relevant intestinal cell types, including epithelial cells (E-cadherin or E-cad), goblet cells (mucin 2, MUC2 and mucin 5AC, MUC5AC), enteroendocrine cells (chromogranin A) and Paneth cells (lysozyme) (Fig. 1g).
Next, we investigated the impact of peristaltic-like movements on the hiPSC-derived intestine-on-chip. We observed that mechanical stimulation (deformation 10–15%; frequency 0.2 Hz; 9 days of culturing, 7 days of actuation; Extended Data Fig. 1b) increased proliferation (Ki67, static percentage = 5.44 ± 1.18 versus actuated percentage = 16.44 ± 8.14) especially at collagen matrix border (Extended Data Fig. 1c), polarization (villin expression static percentage = 90.80 ± 13.08 versus actuated percentage = 150.20 ± 10.45) and mucus production (MUC5AC, Areastatic = 8,977 ± 7,303 μm2, Areaactuated = 42,382 ± 11,921 μm2; MUC2, Areastatic = 1,141 ± 549 μm2, Areaactuated = 8,205 ± 280 μm2; Fig. 1h,i). All this was accompanied by an enhanced formation of 3D supra-cellular villi-like structures (Fig. 1j,k), in agreement with previous reports42.
Similar results were obtained when the intestinal epithelial tubule was generated by co-culturing Caco-2 (enterocyte-like absorptive and brush-forming)43 and HT-29MTX (mucin-secreting)44 human colorectal carcinoma cell lines. Indeed, despite containing only two intestinal cell types, such simplified model is functionally mature, fully polarized and responsive to mechanical strain (Ki67, static percentage = 9.23 ± 4.30 versus actuated percentage = 16.94 ± 6.33; villin expression static percentage = 18.26 ± 9.19 versus actuated percentage = 74.54 ± 14.30; MUC5AC, Areastatic = 21,509 ± 10,656 μm2, Areaactuated = 138,616 ± 23,449 μm2), as shown by the expression of functional, proliferative and lineage markers (Fig. 2a,b). In particular, the overt increase in mucin production (Fig. 2c), which was restricted to MUC5AC in this system (compare Fig. 2b and Extended Data Fig. 2a,b), and 3D villi-like structures (Fig. 2d,e) are crucial for conducting microbiome–host studies.
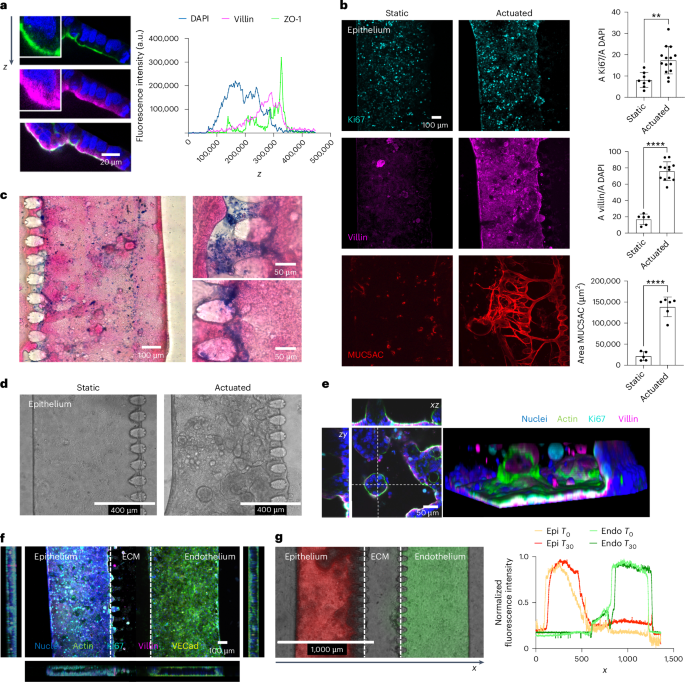
a, Epithelial cells polarization. Representative confocal image and fluorescence intensity plot on z axis of nuclei (DAPI, blue), apical occludins (ZO-1, green) and villin (magenta). b, Fluorescence microscopy images and quantification of Ki67 (cyan), villin (magenta) and MUC5AC (red) in static versus actuated chips. Mechanical actuation resulted in increased proliferation (Ki67, nstatic = 8, nactuated = 14, P = 0.0013), maturation (villin, nstatic = 6, nactuated = 12, P = 3.3 × 10⁻⁹) and mucus production (MUC5AC, nstatic = 5, nactuated = 6, P = 2.91 × 10⁻⁶). Bars represent mean ± s.d., two-tailed unpaired t-test. **P ≤ 0.01; ****P ≤ 0.0001. A, area. c, Representative histological images (n = 4 in 2 independent experiments) of epithelial cells stained with eosin (magenta) for cells and Alcian blue (blue) for the secreted mucus layer. d, Brightfield images of epithelial cells cultured in static versus actuated conditions highlighting the formation of 3D villi-like structures. e, Representative confocal images and 3D reconstruction of villi-like structure on chip. Dashed lines indicate the axis along with the (x,z) and (z,y) confocal images used for the reconstructions where taken. f, Representative confocal images (n > 100 chambers in >30 independent experiments) of epithelial (Caco-2 and HT-29 MTX) and endothelial (HMEC-1) cells after 9 days of culture. DAPI (blue), phalloidin (green), Ki67 (cyan), villin (magenta) and VE-cadherin (VECad; yellow). g, Functional permeability assay. Fluorescence microscopy image (T = 30 min) and intensity profile (T0 = injection of dextran, T30 = 30 min) of TRITC-dextran 4.4 kDa (red) and FITC-dextran 40 kDa (green) on epithelial and endothelial barriers, respectively, at day 9. Data were normalized on maximum value. Epi, epithelial; Endo, endothelial.
As endothelial cells are known to modulate growth and function of intestinal epithelial cells38, next we seeded Caco-2 and HT-29MTX cells in one of the two channels of the chip and cultured them in the presence or absence of HMEC-1 in the other (Fig. 2f and Extended Data Fig. 2c). The expression of villin (MFInormal medium = 29.21 ± 7.87, MFImedium endo = 27.53 ± 9.20, MFIco-culture = 46.69 ± 6.22) and ZO-1 (MFInormal medium = 35.02 ± 5.23, MFImedium endo = 34.00 ± 3.18, MFIco-culture = 46.87 ± 9.38) increased in epithelial cells upon co-culturing with HMEC-1 cells, indicative of a tighter and more mature intestinal barrier (Extended Data Fig. 2e). Accordingly, permeability to dextran decreased as early as after 5 days of culture (Papp normal medium = 1.88 × 10⁻⁵ ± 1.58 × 10⁻⁶ cm s−1, Papp medium endo = 1.42 × 10⁻⁵ ± 2.38 × 10⁻⁶ cm s−1, Papp co-culture = 2.29 × 10⁻⁷ ± 1.14 × 10⁻⁷ cm s−1; Extended Data Fig. 2e–g), confirming that co-culturing with microvascular endothelial cells speeds the maturation of the intestinal epithelium into a functional and selective barrier and making the system suitable to dissect complex molecular interactions engaging both compartments. In addition, evaluation of the barrier functionality using different fluorescent dextrans confirmed that the two tubular structures are independent, with a measured permeability of 1.01 × 10⁻⁷ ± 2.14 × 10⁻⁸ cm s−1 at epithelial side (tetramethylrhodamine isothiocyanate (TRITC)-dextran, red) and 1.41 × 10⁻⁷ ± 7.69 × 10⁻⁹ cm s−1 at microvascular side (fluorescein isothiocyanate (FITC)-dextran, green, Fig. 2g and Extended Data Fig. 2h,i).
Transcriptional changes in the gut-on-a-chip mimic epithelial responses
Intestinal microbes impact about 10% of the host’s transcriptome, primarily including genes involved in immunity, cell proliferation and cell metabolism45. To define the response of the model to the microbiota, we compared transcriptional profiles of our gut-on-a-chip generated from Caco-2 and HT-29MTX cells upon exposure to whole faecal samples from patients with melanoma (Live) or their abiotic supernatants (Sup). Principal component analysis (PCA) highlighted how the microbiota influenced the intestinal epithelium (Fig. 3a), with more pronounced changes in samples treated with faeces (turquoise, 3,278 differentially expressed genes (DEGs), 2,960 unique, P < 0.01) compared with faecal supernatants (orange, 1,119 DEGs, 801 unique, P < 0.01; Extended Data Fig. 3a) despite extensive overlapping at the level of upregulated and downregulated functions (Fig. 3b). Gene set enrichment analysis (GSEA) highlighted a major reprogramming of the epithelium treated with faeces and, to a lesser extent, with supernatants, which was characterized by activation of pathways of response to pathogens, tumour necrosis factor (TNF), nuclear factor kappa-light-chain-enhancer of activated B cells (NF-κB), neutrophil-to-lymphocyte ratio and cytokine signalling, and downregulation of genes involved in cell cycle and mitochondrial metabolism (Fig. 3c,d and Extended Data Fig. 3b), in line with previous reports46. Among those modulated by both treatments (yellow, 318 DEGs P < 0.01; Extended Data Fig. 3a), a subgroup of genes was downregulated only by faeces (163 DEGs, P < 0.01; Extended Data Fig. 3c), which impacted interleukin-17 (IL-17) and TNF signalling, cell cycle and apoptosis, among others (Extended Data Fig. 3d).
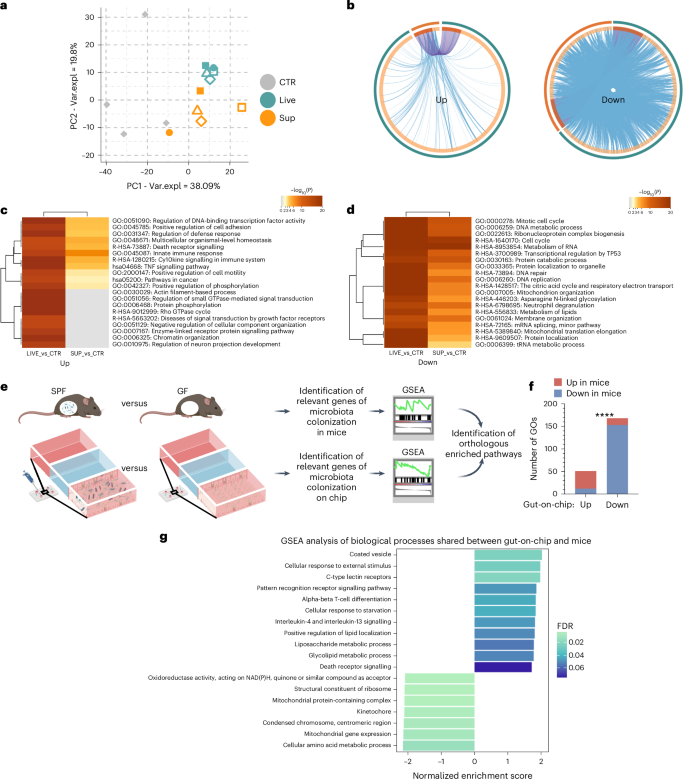
a, PCA plot of untreated (CTR) and treated gut-on-a-chip with whole faeces (Live) or faecal supernatant (Sup). Var.expl, variance explained. b, Overlap between upregulated (left) or downregulated (right) DEGs in Live versus CTR (turquoise, outer circle) or Sup versus CTR (orange, outer circle), only at the gene level (with purple lines linking identical genes) or including the shared term level (with blue lines linking genes that belong to the same enriched ontology term). The inner circle represents common (dark orange) or unique (light orange) DEG in the two lists. c,d, Heat map of enriched terms (top 20 clusters) across upregulated (c) or downregulated (d) DEGs in Live versus CTR (left columns) or Sup versus CTR (right columns), coloured by P values. e, Experimental workflow. The transcriptomes of control chips and epithelial cells treated with live bacteria were compared with transcriptomes of germ-free (GF) mice and specific pathogen-free (SPF) mice. f, Number (y axis) of shared upregulated and downregulated GO terms between the gut-on-a-chip (x axis) and mice (coloured bars). Chi-square test indicates GOs concordantly regulated in the two systems. ****P < 0.0001. g, Bar plot of enriched biological processes in the gut-on-a-chip and mice upon exposure to faecal microbiome. Normalized enrichment score coloured by false discovery rate values.
As experimental manipulation of microbiota in mice is still the most accessible approach to dissect microbiome–host interactions in vivo, next we compared the transcriptome of the gut-on-a-chip model upon exposure to faeces with publicly available datasets of microdissected villous epithelial cells from conventional (specific pathogen-free, n = 6) or germ-free (n = 6) mice46 (Fig. 3e). First, the 3,278 significant DEGs (P < 0.01) were obtained after treating the in vitro system with faeces, and then the enriched gene ontology (GO) terms were mapped to those 786 GSEA-enriched GO terms obtained in the comparison of specific pathogen-free with germ-free mice. Second, among the 786 GSEA’s enriched terms shared between the gut-on-a-chip and mouse intestinal villi, we found a subset of pathways similarly modulated in both systems (Fig. 3g). The resulting analysis identified a fraction of human–mouse orthologous GO terms concordantly regulated by the microbiome in vitro and in vivo (X2 test = 0.0001; Fig. 3f). In particular, the intestinal epithelium exposed to the microbiome upregulated inflammatory, pattern recognition receptors (PRRs), metabolic and death receptor signalling, paired with a downregulation of mitochondrial and cell cycle functions, in vitro as well as in vivo (Fig. 3g; Methods). Thus, this gut-on-a-chip model is suitable to study the host–microbiome crosstalk, and, even in its simplest version, it enables biologically relevant observations that could complement (and potentially reduce) the use of animal models.
The gut-on-a-chip reveals pro-inflammatory traits in non-responsive patients
Response to ICI treatment is, to a certain extent, modulated by the gut microbiome12,13,14,47. Still, we are far from reliably predicting how the melanoma of individual patients will respond to immunotherapy solely based on the analysis of their gut microbiome23,48. In this regard, heterogeneous outcomes of therapeutic faecal microbiota transplantation in combination with ICI49,50,51 indicated a still limited knowledge of basic mechanisms involved in the gut microbiome–host crosstalk and their clinical impact. Therefore, we used the gut-on-a-chip model to evaluate specific effects on the intestinal epithelium of the gut microbiome of patients with melanoma responsive or non-responsive to immunotherapy (Fig. 4a). PCA analysis of transcriptomes of mature intestinal epithelial barriers on-chips exposed to fresh-frozen faecal material from patients with melanoma that were responsive or non-responsive (Fig. 4b) revealed that chips treated with faeces from non-responsive patients acquired distinct profiles compared with controls (n = 6, P < 0.05), while effects of faeces from responsive patients were more heterogeneous and limited to a smaller number of DEGs (n = 4; Fig. 4b,c). Still, faeces from both groups of patients induced a generalized suppression of cell cycle, DNA replication and repair machineries, of mitochondrial biogenesis and transport, chromatin organization, autophagy and protein metabolism, which were noticeable in non-responsive patients (especially regarding the cell cycle, DNA replication and repair, protein metabolism) and less in responsive patients (limited to chromatin organization; Extended Data Figs. 4a–c). These downregulations were coupled with upregulation of interleukin and death receptor signalling (that is, TNF-related apoptosis-inducing ligand; Fig. 4d and Extended Data Fig. 5a–c), matching what has been previously observed in vivo52,53,54,55,56. However, only faeces from non-responsive patients elicited major transcriptional reprogramming, suppressing pathways of cellular response to stress (both chemical and hypoxic), RNA metabolism and transcription, signal transductions (that is, NOTCH, Hedgehog, WNT, MAPK4/5), non-canonical NF-κB and IL-12 signalling and apoptosis, while inducing TNF and IL-6, vascular endothelial growth factor (VEGF), RET57 and Rho GTPases signalling (Extended Data Figs. 4a–c and Fig. 3d). Overall, our gut-on-a-chip model revealed that faeces from non-responsive patients have substantial pro-inflammatory effects on the intestinal epithelium, which may negatively impact the response of these patients to immunotherapy23.
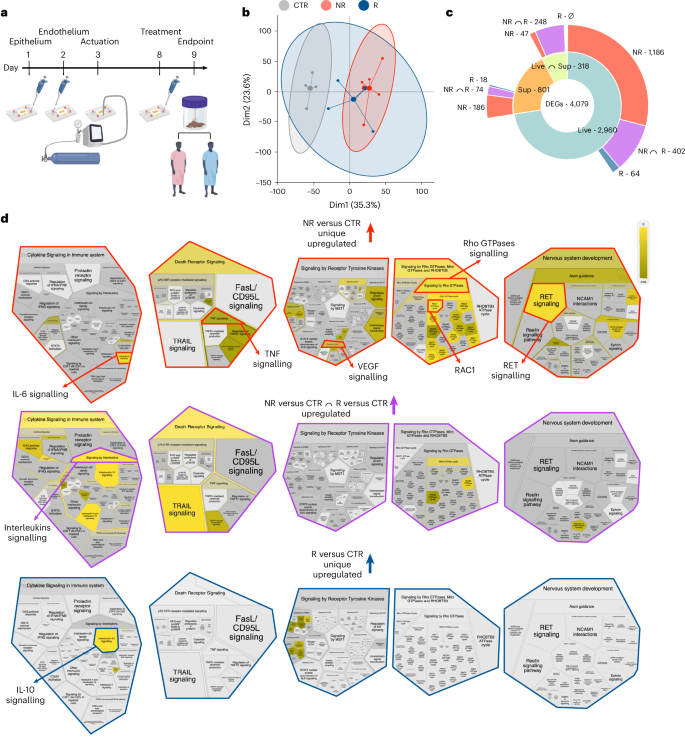
a, Experimental design. Complete gut-on-a-chip were treated (day 8) with faecal material from patients with melanoma responsive (R, blue) or non-responsive (NR, red) to immunotherapy. b, PCA plot of untreated (CTR) and treated gut-on-a-chip with faecal material from responsive (R) patients and non-responsive (NR) patients. Dim1, dimension 1; Dim2, dimension 2. c, Sunburst plot showing the indicated number of DEGs, unique or shared (purple and light lime), in the gut-on-a-chip treated with whole faeces (Live, turquoise) or faecal supernatants (Sup, orange) from patients with melanoma that were responsive (blue) or non-responsive (red) compared with untreated controls (CTR). d, Reactome’s pathway analysis of NR versus CTR (red) and R versus CTR (blue) unique and common (purple) DEGs coloured by normalized enrichment score.
Gut-on-a-chip response to microbiota matches immunotherapy data
Based on the emerged pro-inflammatory capability of faecal samples from non-responsive patients, next we used quantitative confocal microscopy on intact gut-on-a-chip models to compare them with those from responsive patients, measuring markers of acute toxicity (that is, caspase-3), barrier integrity (that is, ZO-1) and cellular signalling (that is, β-catenin). While the caspase-3 staining increased independently from the source of the faecal microbiome (MFICTR = 7.51 ± 3.35, MFINR = 13.33 ± 3.27, MFIR = 13.91 ± 3.94), we observed a brisk reduction of ZO-1 (MFICTR = 41.25 ± 6.69, MFINR = 20.83 ± 5.37, MFIR = 38.35 ± 3.72) and β-catenin expression (MFICTR = 44.59 ± 5.58, MFINR = 13.80 ± 4.94, MFIR = 50.40 ± 8.75) only when treating with faeces from patients with melanoma who were non-responsive (Fig. 5a,b), while gut microbiota from responsive patients resembled those of healthy donors (HD, n = 3) and did not impact the integrity of the intestinal barrier, in terms of adherens or of tight junctions (E-cad: MFICTR = 53.43 ± 8.89, MFINR = 25.61 ± 2.37, MFIR = 89.31 ± 34.34, MFIHD = 65.90 ± 7.10; ZO-1: MFICTR = 45.48 ± 4.26, MFINR = 19.52 ± 2.47, MFIR = 44.88 ± 2.64, MFIHD = 45.96 ± 1.36; Extended Data Fig. 6a,b). The fact that similar changes were observed when operating in anaerobic conditions (Extended Data Figs. 6c,d) excludes—within our limits of detection—that they may result from technical artefacts and supports their biological relevance.
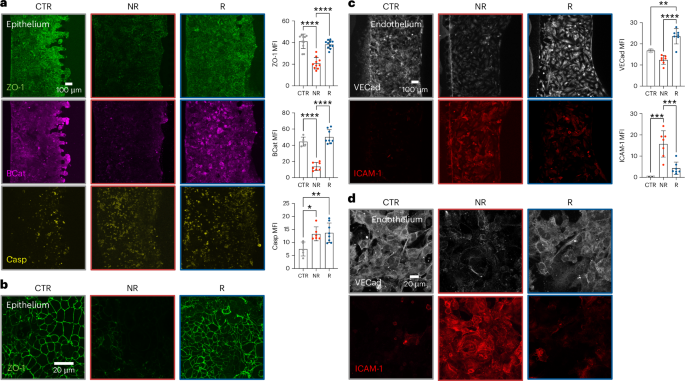
a, Representative fluorescence microscopy images and mean fluorescence intensity (MFI) quantification of ZO-1 (green, at least 3 independent replicates per patient, P = 4.7 × 10⁻⁹ for CTR versus NR and P = 1.03 × 10⁻⁷ for R versus NR), β-catenin (BCat, magenta, at least 2 independent replicates per patient, P = 1.97 × 10⁻⁶ for CTR versus NR and P = 3.04 × 10⁻⁸ for R versus NR) and caspase-3 (Casp, yellow, at least 2 independent replicates per patient, P = 0.0215 for NR versus CTR, P = 0.0093 for R versus CTR) on untreated gut-on-a-chip (CTR) or after 24 h treatment with faeces (10 mg ml−1) from patients with melanoma R or NR to immunotherapy. Bars represent mean ± s.d., ordinary one-way analysis of variance (ANOVA). b, Representative high-magnification fluorescence microscopy images (n > 15 in 6 independent experiments) of ZO-1 on untreated gut-on-a-chip (CTR) or after 24 h treatment with faeces (10 mg ml−1) from patients with melanoma R or NR to immunotherapy. c, Representative fluorescence microscopy images and MFI quantification of VE-cadherin (VECad, white, at least 2 independent replicates per patient, P = 0.0084 for R versus CTR, P = 7.38 × 10⁻⁶ for R versus NR) and ICAM-1 (red, at least 2 independent replicates per patient, P = 0.0006 for R versus CTR, P = 0.0008 for R versus NR) on endothelial cells in control chips (CTR) or after 24 h treatment with faeces as in a. Bars represent mean ± s.d., ordinary one-way ANOVA. *P ≤ 0.05; **P ≤ 0.01; ***P ≤ 0.001; ****P ≤ 0.0001. d, Representative high-magnification fluorescence microscopy images (n = 7 in 3 independent experiments) of VE-cadherin (white) and ICAM-1 (red) on endothelial cells in control chips (CTR) or after 24 h treatment with faeces as in a.
The effects of gut microbiota from non-responsive patients on the intestinal epithelium were coupled with loss of the microvascular barrier integrity (vascular endothelial cadherin (VE-cadherin), MFICTR = 16.84 ± 0.74, MFINR = 12.44 ± 2.08, MFIR = 23.58 ± 3.63) and activation of the microvascular endothelial cells, as measured by the expression of the Intercellular Adhesion Molecule 1 (ICAM-1, MFICTR = 0.53 ± 0.09, MFINR = 15.73 ± 6.20, MFIR = 4.43 ± 3.11; Fig. 5c,d), suggesting that, differently from those from responsive patients, faeces from non-responsive patients challenge the homeostatic state of intestinal tissues.
Importantly, faeces from both patient’s groups had comparable bacterial load (as measured by non-selective culturing in aerobic as well as in anaerobic conditions; Extended Data Fig. 6e,f) and, together with whole-genome metagenomic sequencing analysis, supported that divergent effects caused by faeces of patients with melanoma that were responsive versus those that were non-responsive are likely due to qualitative (relative abundance) rather than quantitative (overall amount of living bacteria) differences (Fig. 6a), in accordance with previous reports12,13,14. However, lack of consensus on microbes linking the immune modulation with ICI outcome still precludes unambiguous classification of commensal species as ‘good’ or ‘bad’48. By contrast, functional redundancies across cohorts support the concept that bacterial function may be at least as relevant as phylogeny for the host–microbiome dialogue. As resistance of patients to immunotherapy has been previously associated with lipopolysaccharides (LPS) produced by Gram-negative bacteria23,58, we searched for LPS-related bacterial genes in the faecal metagenomes of our patients with melanoma, confirming that they were enriched in the faeces of non-responsive patients compared with those that were responsive (Fig. 6b and Extended Data Fig. 6g). This finding well matched the transcriptional changes observed upon treatment with faeces from non-responsive patients, with activation of LPS/Toll-like receptor (TLR)‘s downstream signalling (that is IL-6, TNF, Rho GTPases)59.
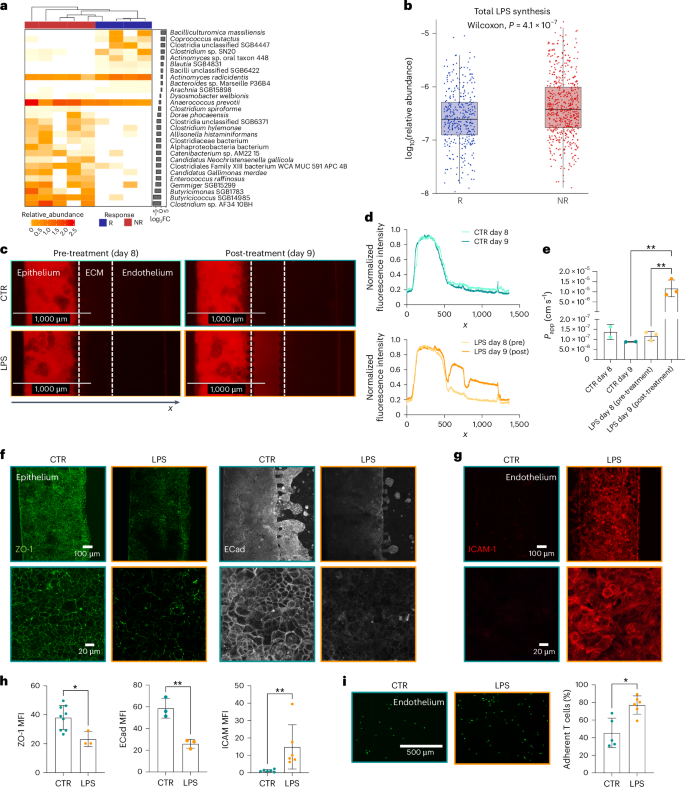
a, Heat map of top R- and NR-associated taxa based on Wilcoxon test unadjusted P < 0.05. Bars on the right indicate log2 fold change of mean relative abundance (R/NR). b, Relative abundances (in a log10 base) of detected UniRef90 genes involved in LPS synthesis in patients’ faeces (nNR = 5, nR = 4, two-tailed Wilcoxon rank-sum test P = 4.1 × 10⁻⁷). c, Fluorescence microscopy images (n > 2 in 2 independent experiments) of dextran permeability assay (TRITC-dextran 4.4 kDa) on epithelial cells at day 8 (left) and day 9 (right) in control chips (top) and LPS-treated (24 h, 10 μg ml−1) chips (bottom). d, Normalized fluorescence intensity profile of dextran permeability assay (TRITC-dextran 4.4 kDa) of control and LPS-treated chips at day 8 and day 9. Data were normalized on maximum value. e, Apparent permeability (Papp) quantification of epithelial barrier in control and LPS-treated chips at day 8 and day 9 (P = 0.0072 for LPS day 9 versus CTR day 9, P = 0.0041 for LPS day 9 versus LPS day 8). f, Fluorescence microscopy images of ZO-1 (green) and E-cadherin (ECad, white) on epithelial cells in control and LPS-treated chips. g, Fluorescence microscopy images of ICAM-1 (red) on endothelial cells in control chips and after LPS treatment of epithelial tubule. h, Mean fluorescence intensity quantification of ZO-1 (P = 0.0182), E-cadherin (ECad, P = 0.0041) and ICAM-1 (P = 0.0022). i, Fluorescence microscopy images and quantification of adherent T cells (green, P = 0.0157) on endothelial cells cultured in endothelial medium or pre-treated with LPS. Bars represent mean ± s.d., ordinary one-way ANOVA (e), two-tailed Mann–Whitney test (h left and right), two-tailed unpaired t-test (h centre), two-tailed paired t-test (i) and Wilcoxon test (b). *P ≤ 0.05; **P ≤ 0.01.
Therefore, we exposed the gut-on-a-chip model to LPS from Escherichia coli and recorded effects on the epithelial barrier. Similar to faeces of non-responsive patients, we observed a loss of barrier function upon LPS treatment (Papp_CTR = 8.82 × 10⁻⁸ ± 1.08 × 10⁻⁹ cm s−1 versus Papp_LPS = 1.17 × 10⁻⁵ ± 4.13 × 10⁻⁶ cm s−1; Fig. 6c–e) coupled with a downregulation of ZO-1 (MFICTR = 38.11 ± 8.27, MFILPS = 23.17 ± 5.16) and E-cadherin (MFICTR = 53.60 ± 3.13, MFILPS = 26.01 ± 4.09) expression on epithelial cells (Fig. 6f,h and Extended Data Fig. 7a,b). It is worth noting that our gut-on-a-chip model showed a range of responses that reflected structural and immunostimulatory differences of the LPS produced by different bacteria60,61,62, suggesting that microbiota from non-responsive patients may be particularly enriched in LPS resembling the hexa-acylated LPS from E. coli or the monophosphorylated, penta-acylated LPS from Porphyromonas gingivalis (Extended Data Fig. 7a,b).
Nevertheless, we also recorded an increase in ICAM-1 on HMEC-1 cells upon LPS treatment (MFICTR = 1.16 ± 0.68, MFILPS = 14.86 ± 12.73; Fig. 6g,h), and, when we injected isolated human T cells in the preformed microvascular channel, they adhered more (CTR = 45.40 ± 16.80, LPS = 77.14 ± 10.41; Fig. 6i), likely as a consequence of HMEC-1 activation. In conclusion, using the gut-on-a-chip model, we demonstrated that faeces from non-responsive patients have a higher pro-inflammatory effect compared with faeces from responsive patients, and that this is due, at least in part, to a higher activation of LPS-dependent signalling.
Soluble factors from the microbiota of non-responsive patients mimic LPS inflammatory effects
The therapeutic potential of faecal microbiota transplantation in combination with ICI has been demonstrated in preclinical and clinical settings12,13,14,49,50,51. However, which components of the faecal microbiome are sufficient to elicit favourable or detrimental effects in the gut is contentious, and safety63 related to the use of live bacteria is still a major concern. We sought to determine whether soluble factors produced by faecal communities from responsive patients and non-responsive patients were sufficient to recapitulate the effects of stools. When exposed to faecal supernatants from either responsive patients or non-responsive patients, the gut-on-a-chip model showed that soluble faecal factors from non-responsive patients were sufficient to induce a decrease in ZO-1 in epithelial cells (MFICTR = 49.27 ± 3.82, MFINR = 18.06 ± 4.13, MFIR = 39.08 ± 8.28), which was coupled with an increase in ICAM-1 on micro-endothelial cells (MFICTR = 1.22 ± 0.29, MFINR = 24.33 ± 12.83, MFIR = 6.41 ± 6.41). Conversely, treatment with faecal supernatants from responsive patients did not have a major impact on barrier integrity compared with controls (Fig. 7a,b). These data were corroborated by the induction of TLR-4 expression (the LPS receptor) upon treatment with either whole faeces or supernatants (Fig. 7c). Moreover, we measured in the effluent media of the gut-on-a-chip higher levels of inflammatory molecules known to be released in response to LPS, such as IL-6, CXCL859,64, CCL2065 and VEGF66,67, and this was more evident upon treatment with supernatants from non-responsive patients (Fig. 7d). Interestingly, when inflammatory molecules where quantified in parallel in the microvascular channel, the effect of supernatants non-responsive patients was even more pronounced compared with the treatments with faecal samples, especially in the case of interferon-γ (IFNγ) (Extended Data Fig. 8a,b).
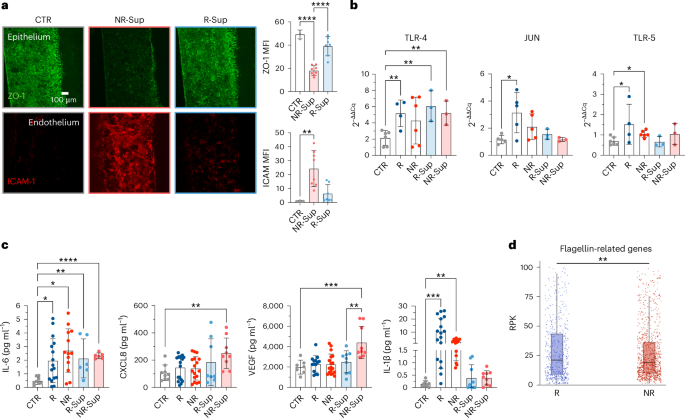
a, Fluorescence microscopy images and quantification of ZO-1 (green, P = 4.99 × 10⁻⁶ for CTR versus NR and P = 2.19 × 10⁻⁵ for R versus NR) and ICAM-1 (red, P = 0.0034) in control chips (CTR) or after treatment with faecal supernatant from R or NR patients. At least 2 independent replicates per patient. b, TLR-4, JUN and TLR-5 expression (qPCR analysis) in CTR or epithelial cells treated with faeces or faecal supernatants from R or NR (TLR-4, P = 0.0051 for R versus CTR, P = 0.0034 for R-Sup versus CTR, P = 0.0058 for NR-Sup versus CTR; JUN, P = 0.0226; TLR-5, P = 0.0333 for R versus CTR, P = 0.0152 for NR versus CTR). At least 1 independent replicate per patient. c, Multiplex ELISA (Luminex) quantification of IL-6 (P = 0.0181 for R versus CTR, P = 0.001 for NR versus CTR, P = 0.0075 for R-Sup versus CTR, P = 1.07 × 10⁻⁸ for NR-Sup versus CTR), CXCL8 (P = 0.0019), VEGF (P = 0.0007 for NR-Sup versus CTR, P = 0.0078 for NR-Sup versus R-Sup) and IL-1β (P ≤ 0.01 for NR-Sup versus CTR, P ≤ 0.001 for NR-Sup versus R-Sup) released by CTR or epithelial cells treated with complete faecal material or faecal supernatants of R and NR patients. At least 2 independent replicates per patient. d, Normalized abundance (RPK) of bacterial flagellin-related gene terms in R and NR metagenomes (P = 0.00841). Whiskers equal to 1.5 times inter-quartile range, two-tailed Wilcoxon rank-sum test. Bars represent mean ± s.d., ordinary one-way ANOVA (a top and c), Kruskal–Wallis test (a bottom). *P ≤ 0.05; **P ≤ 0.01; ***P ≤ 0.001; ****P ≤ 0.0001. RPK, reads per kilobase.
Although we noticed a generalized increase in the release of IL-1β following the exposure to different microbial components, it was particularly higher in the presence of whole faeces from responsive patients, both in aerobic and anaerobic conditions (Fig. 7d and Extended Data Fig. 8c, respectively), mirroring the expression of its transcriptional regulator JUN68 (Fig. 7b, which confirmed results of the upstream analysis presented in Extended Data Fig. 5b). This was a specific trait of the microbiota of responsive patients, which otherwise induced a pattern of response such as the one from healthy donors (Extended Data Fig. 8d). Observations linking high-levels of the IL-1β to the integrity of the intestinal barrier69,70,71 are often conflicting, likely because of overlapping mechanisms engaged by damage and homeostatic repair of the intestine. As previous work conducted on mouse models showed that TLR-5 activation cooperates with IL-1β and IL-10 signalling in resolving intestinal inflammation72,73,74, we analysed how TLR-5 expression changed on the gut-on-a-chip upon microbiome exposure—having already shown that treatment with faeces from responsive patients specifically increased IL-10 signalling (Fig. 4d). In agreement with a coordinated regulation of these three signalling in response to a peculiar composition of the microbiota, we found that TLR-5 expression increased following treatment with whole faeces, especially with those from responsive patients (Fig. 7b). The involvement of TLR-5 signalling in the response to faeces from responsive patients was further supported by gene-level metagenomic analysis of faecal samples, which revealed a higher abundance of flagellin-related genes in responsive patients than in non-responsive patients (Fig. 7d)—with flagellins being the natural ligand of TLR-5.
Testing therapeutic potential of microbiota factors on-chip
Finally, aiming to develop targeted strategies to improve ICI efficacy based on gut microbiota manipulations, the therapeutic potential of faecal samples from patients with melanoma responding to immunotherapy was evaluated on the gut-on-a-chip model. We observed that combining whole faecal material or supernatants from responsive patients was able to ameliorate the effects of faeces from non-responsive patients on the intestinal barrier integrity, as measured by ZO-1, E-cad and BCat expression on epithelial cells (ZO-1: MFICTR = 49.87 ± 5.92, MFINRSup = 31.69 ± 3.69, MFINRSup+RSup = 49.63 ± 4.14, MFINRSup+R = 48.62 ± 4.91; E-cad: MFICTR = 49.48 ± 9.27, MFINRSup = 29.56 ± 2.08, MFINRSup+RSup = 55.09 ± 5.69, MFINRSup+R = 66.69 ± 4.36; BCat: FICTR = 43.41 ± 4.92, MFINRSup = 25.19 ± 2.89, MFINRSup+RSup = 36.63 ± 5.00, MFINRSup+R = 54.22 ± 3.22; Fig. 8a,b). Similarly, both whole faecal material and supernatants from responsive patients were able to counteract LPS-induced disruption of the intestinal epithelial barrier (ZO-1: MFILPS = 23.17 ± 5.16, MFILPS+RSup = 58.54 ± 8.75, MFILPS+R = 60.63 ± 4.38; E-cad MFILPS = 26.01 ± 4.09, MFILPS+RSup = 62.89 ± 13.18, MFILPS+R = 69.52 ± 2.94; BCat: MFILPS = 27.51 ± 2.18, MFILPS+RSup = 68.51 ± 5.21, MFILPS+R = 57.67 ± 10.28; Fig. 6a,d). These results were corroborated by the reduction of VEGF, CXCL-8 and IL-6 released in the epithelial channel when supernatant from responsive patients was added to the treatment with supernatant from non-responsive patients (Fig. 8e), supporting an overall beneficial effect of responsive patients microbiota-derived products on the inflammatory state of the intestinal barrier.
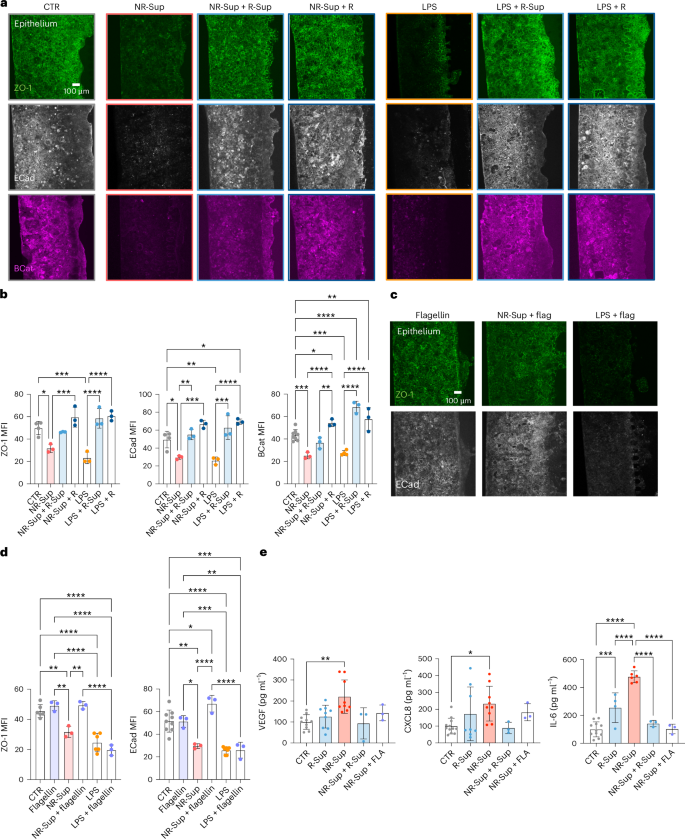
a,b, Fluorescence microscopy images (a) and relative quantification (b) of ZO-1, E-cadherin and β-catenin on epithelium treated with faecal supernatant from NR patients and LPS combined with faecal material or supernatant from R patients (ZO-1: P = 0.0161 for NR-Sup versus CTR, P < 0.001 for NR-Sup versus NR-Sup+R, LPS versus CTR, LPS versus LPS+R-Sup, LPS versus LPS+R; ECad: P = 0.0271 for NR-Sup versus CTR, P = 0.0271 for CTR versus LPS+R, P < 0.001 LPS versus CTR, for LPS versus LPS+R, NR-Sup versus NR-Sup+R, NR-Sup versus NR-Sup+R-Sup, LPS versus LPS+R-Sup; BCat: P = 0.0403 for CTR versus NR-Sup+R, P = 0.0054 for CTR versus LPS+R, P = 0.0048 for NR-Sup+R versus NR-Sup+R-Sup, P < 0.001 for NR-Sup versus CTR, LPS versus CTR, CTR versus LPS+R-Sup, NR-Sup versus NR-Sup+R, LPS versus LPS+R-Sup, LPS versus LPS+R). c,d, Fluorescence microscopy images (c) and relative quantification (d) of ZO-1 and E-cadherin on epithelium treated with faecal supernatant from NR patients and LPS combined with flagellin (ZO-1: P = 0.0046 for NR-Sup versus CTR, P = 0.0020 for NR-Sup versus flagellin, P = 0.0017 for NR-Sup versus NR-Sup+flagellin, P < 0.0001 for LPS versus CTR, LPS+flagellin versus CTR, LPS versus flagellin, LPS+flagellin versus flagellin, NR-Sup+flagellin versus LPS+flagellin; ECad: P = 0.0013 for NR-Sup versus CTR, P = 0.0341 for CTR versus NR-Sup+flagellin, P = 0.0112 for flagellin versus NR-Sup, P = 0.0026 for flagellin versus LPS+flagellin, P < 0.001 for LPS versus CTR, NR-Sup versus NR-Sup+flagellin, NR-Sup+flagellin versus LPS+flagellin, LPS+flagellin versus CTR, flagellin versus LPS). e, Multiplexed ELISA (Luminex) of VEGF (P = 0.0016 for NR-Sup versus CTR), CXCL8 (P = 0.0496 for NR-Sup versus CTR) and IL-6 (P < 0.001 for CTR versus R-Sup, NR-Sup versus CTR, NR-Sup versus R-Sup, NR-Sup versus NR-Sup+R-Sup, NR-Sup versus NR-Sup+flagellin) released by controls or epithelium treated with faecal supernatant from NR patients combined with supernatant from R patients or flagellin. Bars represent mean ± s.d., Kruskal–Wallis test (e left and centre) ordinary one-way ANOVA (b, d, e right). *P ≤ 0.05; **P ≤ 0.01; ***P ≤ 0.001; ****P ≤ 0.0001.
Combined treatment with purified flagellin (Salmonella typhimurium) achieved similar benefits, in terms of both barrier integrity and control of inflammatory factors (Fig. 8c–e), while it was not able to rescue the disruptive effect of the exposure to purified LPS (Fig. 8c,d).
In summary, our findings show that the response of melanoma to immunotherapy can be predicted based on effects elicited by patient-derived faecal samples on our gut-on-a-chip, which is also suitable for dissecting mechanistic details underlying the interactions of different components of the microbiota with host and to foster their development into new therapeutics.
Discussion
We have developed a microfluidic-based gut-on-a-chip model that overcomes some of the limitations of current 2D, 3D and in vivo systems and that provides a reliable system to study microbiome–host interactions. Functional tubular structures such as this gut-on-a-chip have previously been reported in other models29,30,75,76. However, the use of an ECM-like gel instead of an artificial porous polydimethylsiloxane membrane29,30 at interface between the epithelial and the micro-vascular channels provides this system with a more physiological solution framed in a highly functional design, which allows cell or particle tracking between compartments directly on an intact chip. In addition, replacing an alternate flow75,76 with a superimposed actuation chamber enables controlled stimulation of the device, introducing peristaltic-like mechanical forces that modulate cellular signalling involved in the development and the homeostasis of the epithelium while generating a dynamic luminal environment.
Despite these implementations and the presence of different intestinal cell types derived from the use of hiPSC, the model does not reproduce the physiology of the human intestine in its whole. While here we define the limits within which the system can generate biologically relevant responses, studies are underway to address some outstanding points, including microfluidic-based solutions for long-term anaerobic culture, adjusting the complexity and physiological composition of the ECM, introducing a resident immune compartment and integrating the whole system with a patient-derived melanoma model on-chip. In this regard, we have applied multiomic approaches to accurately quantify molecular mechanisms underlying the response of the intestinal epithelium to faecal microbiome, recapitulating key transcriptional modulations observed in mouse models, for example. Even in its simpler version with Caco-2 and HT29MTX cell lines, the gut-on-a-chip helps tracing individual contributions of epithelial, microvascular and immune components back to the complexity of microbiome–host interactions. This is a crucial step toward its use to complement in vivo experiments and in preclinical studies, especially during the discovery and de-risking stages, which will speed the design of targeted interventions while minimizing the use of experimental animals.
It is worth noting that, going beyond the experimental validation of the system, here we have tested clinically relevant human faecal samples directly on-chip, generating results that confirm preclinical and clinical observations while untangling unappreciated properties of biotic and abiotic components of the faecal microbiota in patients with melanoma. In this regard, we have provided initial evidence of transcripts, soluble molecules and bacterial components associated with specific clinical features. If confirmed in larger cohorts and with independent approaches, they may represent the foundation of objective multivariate biomarkers of response to ICI (that is, based on targeted quantitative PCR (qPCR) and multiplexed enzyme-linked immunosorbent assay (ELISA)) that is even more accessible and time and cost effective.
Based on quantitative measurements correlated with the clinical outcome, we have shown that the faecal microbiome of patients with melanoma that were responsive or non-responsive exert different effects on the gut. In particular, we provide evidence that the microbiome of non-responsive patients, which has been already associated with an altered intestinal epithelial homeostasis23, is characterized by reduced ability to buffer cellular stress (that is, oxidative stress related to nuclear factor erythroid 2-related factor 2), to renew and to heal, likely leading to a state of persistent inflammation. In addition, our data assigned different clinical relevance to soluble components and microorganisms in faeces, with the former dominated by LPS in non-responsive patients and the latter enriched in flagellin-related genes in responsive patients. Studies on and off the chip are underway to decode the complex heterogeneity of these molecules and their downstream signalling.
One of the main obstacles to continuation of ICI treatments is the appearance of high-grade immune-related adverse events, including severe colitis. While frequently limiting the benefits of the therapy, ICI-associated colitis can be rescued, at least in part, by manipulating the gut microbiota77,78. We have previously demonstrated that immune-related adverse events associate with higher IL-1β levels and peculiar microbial compositions in patients79, suggesting potential targets for intervention. Protective effects of IL-1β have been reported in the skin, where bacteria-induced IL-1β release resulted in skin regeneration after injury80, and in the gut, where IL-1β promoted Treg functions and induced immunoglobulin A production81,82. Here we provide new evidence of a direct role played by the intestinal epithelium, pointing at molecular factors that would need to be balanced to maximize a positive clinical response over the risk of unwanted side effects. In particular, our data suggest that activation of TLR-5 signalling could cooperate with IL-1β and IL-10 to tame down inflammatory responses, likely favouring a productive antitumour response.
Overall, the gut-on-a-chip can be employed to quantitatively investigate the molecular effects associated with bacterial components and to develop them into more effective and safe therapies.
Methods
Cell lines and bacterial strains
Caco-2 cells were obtained from the American Type Culture Collection. HT-29 MTX cells were a gift from G. Monteleone (University of Rome Tor Vergata). Caco-2 cells were cultured in flasks in Eagle’s minimal essential medium (EMEM, Merck) supplemented with 20% fetal bovine serum (FBS, Microtech), 10 mM 4-(2-hydroxyethyl)-1-piperazineethanesulfonic acid (HEPES, Sigma-Aldrich), 1 mM sodium pyruvate (Euroclone), 0.1 mM non-essential amino acids (Euroclone), 2 mM l-glutamine (Glu, Euroclone). HT-29 MTX cells were cultured in flasks in Dulbecco’s modified Eagle medium (DMEM, Euroclone) supplemented with 10% FBS and 10 mM HEPES. Caco-2 and HT-29 MTX cells were used between passages 10 and 20 and cocultured in Caco-2 medium.
HMEC-1 were obtained from the Center for Disease Control and Prevention. HMEC-1 were cultured in collagen-coated flasks in MCBD 131 medium supplemented with 20% FBS, 10 mM HEPES, 10 mM Glu, 1 mg ml−1 hydrocortisone (Euroclone) and 20 ng ml−1 human epidermal growth factor (EGF, Gibco). Cells were cultured in a humidified environment at 37 °C in 5% CO2 between passages 5 and 15.
hiPSCs-derived intestinal organoids
hiPSCs were obtained from The Jackson Laboratory (www.jax.org, KOLF2.1J). Generation of intestinal organoids derived from induced pluripotent stem cells (iPSCs) was performed according to ref. 18 with slight modifications. Briefly, iPSCs were cultured on Vitronectin XF (Stemcell Technologies) coated six-well plates in E8 medium consisting of DMEM F12 with HEPES (Gibco), 128 ng ml−1 ascorbic acid (Sigma-Aldrich), 1× insulin–transferrin–selenium (Thermo Fisher Scientific), 10 ng ml−1 FGF2 (Peprotech), 500 ng ml−1 heparin (Sigma-Aldrich), and 2 ng ml−1 TGFβ1 (Peprotech). iPSCs were passaged once a week using ReLeSR dissociation reagent (Stemcell Technologies) when cells reached 80% confluence. For experiments, iPSCs were used between passages 8 and 16.
For intestinal spheroid differentiation, iPSCs were treated with 3 μM CHIR99021 (Sigma-Aldrich) and 100 ng ml−1 ActivinA (R&D Systems) in Roswell Park Memorial Institute medium (RPMI) (Gibco catalogue number 11875093) supplemented with 2 mM GlutaMAX (Gibco) and 1× Pen-Strep (Gibco) on day 1, followed by 100 ng ml−1 ActivinA in RPMI supplemented with 0.2% FBS (Gibco), 2 mM GlutaMAX and 1× Pen-Strep. The medium was changed daily until day 4. On day 4, cells underwent hindgut differentiation by treatment with 3 μM CHIR99021 and 500 ng ml−1 FGF4 (Peprotech) in RPMI supplemented with 1× B27 without ascorbic acid (Gibco), 2 mM GlutaMAX (Gibco) and 1× Pen-Strep (Gibco). The medium was refreshed daily for the next 4 days. Starting on day 8, cells were cultured in Advanced DMEM F12 (Invitrogen) supplemented with 1× B27 (Gibco), 2 mM GlutaMAX (Gibco), 1× Pen-Strep (Gibco), 3 μM CHIR99021, 300 nM LDN193189 (Axon) and 100 ng ml−1 EGF (Immunotools). The final medium was labelled as human intestinal organoid (HIO) final medium. The medium was refreshed every 3 days.
On day 20, cells were dissociated to a single-cell solution with Accutase (Stemcell Technologies) for 7 min at 37 °C. The single-cell solution was centrifuged at 350 g for 4 min and resuspended in 50 μl Matrigel. The Matrigel containing the cells was plated as a dome in a 24-well plate (Fisher Scientific catalogue number 10380932) and allowed to polymerize for 30 min. Each dome was filled with 1.5 ml of HIO final medium. The medium was refreshed every 3 days, and organoids were passaged every 12 days at a ratio of 1:6. After reaching the desired dimension and morphology (12–14 days), organoids were collected with a syringe tip and dissociated mechanically and enzymatically in 1 ml Tryple Express (Gibco catalogue number 12604013) for 5 min. Dissociated organoids were centrifuged at 350 g for 4 min and resuspended in HIO final medium supplemented with 10 µM Y27632 (Rock inhibitor; Selleckchem catalogue number S1049) for injection into the microfluidic device.
Human faecal and blood samples
Faecal material from healthy donors or from patients with melanoma responding and non-responding to immunotherapy were obtained at European Institute of Oncology IRCCS (IEO) before the starting of any treatment. No compensation was paid to patients for participating in the study. All participants and patients gave their informed consent for inclusion before they participated in the study. The studies were conducted in accordance with the Declaration of Helsinki, and the protocols were approved by IEO Ethical Committees (registered as IEO1271 and IEO889, respectively). Serial 10-fold dilutions obtained from 50 mg ml−1 faecal matter were plated for 72 h in non-selective Gifu Anaerobic Broth (GAM) agar plates in aerobic and anaerobic conditions to quantify the bacterial load through colony-forming unit counts. For on-chip experiments, faecal samples were suspended in Caco-2 medium at a concentration of 10 mg ml−1.
Blood samples from healthy volunteers were collected at IEO under an approved protocol (IEO 1781).
Gut-on-a-chip preparation
Microfluidic chips were fabricated at Politecnico di Milano (MiMic Lab, Dipartimento di Elettronica Informazione e Bioingegneria) using standard soft lithography techniques. The polydimethylsiloxane device is composed of an intestinal epithelial channel (700 μm wide, 0.65 cm long and 150 μm high) and a microvascular endothelial channel (700 μm wide, 0.65 cm long and 150 μm high) separated by ECM (300 μm wide, 0.65 cm long and 150 μm high). Shield-shaped micropillars (55 μm wide, 100 μm long, 100 μm high, 50 μm spacing) allow the confinement of ECM in the central region. A superimposed actuation chamber (0.3 cm wide, 0.85 cm long and 150 μm high) enables cyclic and controlled deformation of the construct.
The ECM channel was filled with collagen matrix prepared on ice by mixing rat-tail collagen I (final concentration 4.5 mg ml−1, Corning) with PBS10× (10% total volume, Microtech), NaOH (2% collagen volume, Sigma) and double-distilled H2O.
The pre-mixed Caco-2:HT-29 MTX cell suspension (9:1 ratio, 8 × 10⁶ cells per ml) was seeded on two consecutive days on a pre-coated (200 mg ml−1 rat-tail collagen I and 1% Matrigel, Corning) epithelial channel. On the next day, HMEC-1 (10 × 106 cells per ml) were seeded on the pre-coated microvascular endothelial channel and left to adhere to the ECM wall for 24 h. Starting from the third day, the microfluidic devices were connected to a programmable pneumatic actuation system (uBoX, BiomimX Srl) and cultured in mechanically active conditions (deformation 10–15%, frequency 0.2 Hz) up to day 9.
For organoids experiments, disaggregated hiPSCs-derived intestinal organoids were seeded on a pre-coated (200 mg ml−1 rat-tail collagen I and 1% Matrigel, Corning) epithelial channel. Starting from day 2, the microfluidic devices were connected to the uBoX system and cultured in mechanically active conditions (deformation 10–15%, frequency 0.2 Hz) up to day 9.
Intestinal epithelial barrier permeability assay
Gut-on-a-chip devices were prepared as previously described and maintained under mechanically active conditions until day 9 (6 days of actuation). Each chip was microscopically assessed to confirm barrier integrity by injecting TRITC-dextran (4.4 kDa, 1 mg ml−1, Sigma) and FITC-dextran (40 kDa, 1 mg ml−1, Sigma) in the epithelial and microvascular endothelial channels, respectively, and using widefield fluorescence microscope imaging (EVOS FL Cell Imaging System, Invitrogen) every 15 min for up to 1 h. Images were analysed using Fiji (ImageJ, version 2.0.0-rc-59/1.51n). Dextran fluorescence intensity was measured in the lateral channels and in the gel channel, and apparent permeability was calculated as follows:
where Papp is the permeability score in centimetres per second, Iend is the fluorescence intensity in the gel channel at the last time point, Iinitial is the fluorescence intensity in the gel channel at the beginning of the experiment, Tend is the last time point in seconds, Tinitial is the initial time in seconds, I0 is the fluorescence intensity in the tubule channel at the beginning of the experiment, Vgel is the volume of the gel in cubic centimetres and Abarrier is the surface area of the tubule that contacts the gel in square centimetres.
To evaluate the response to pro-inflammatory insults, the chip with a mature intestinal epithelial barrier was injected on day 8 with LPSs in the epithelial channel (LPS EC) and incubated in standard culturing conditions for 24 h. Dextran’s permeability assay was performed before and at the end of the treatment.
Immunofluorescence microscopy
3D chips were fixed in 4% paraformaldehyde (Electron Microscopy Science) for 30 min at room temperature, washed in PBS for 1 h and thus permeabilized and blocked for 1 h at room temperature (0.25% Triton X-100, 5% FBS, 3% BSA in PBS). All stainings were performed overnight at 4 °C using pre-mixed primary antibodies targeting the following human proteins: ZO-1 (1:100, Invitrogen, catalogue number 339188), E-cadherin (1:200, Abcam, catalogue number ab1416), β-catenin (1:200, BD Bioscience, catalogue number ab8480), villin (1:100, Santa Cruz, catalogue number sc-58897), Ki67 (1:500, Abcam, catalogue number ab15580), cleaved caspase-3 (1:400, Cell Signaling, catalogue number 9661S), MUC2 (1:100, Thermo Fisher, catalogue number MA5-12345), MUC5AC (1:100, Invitrogen, catalogue number MA5-12178), VE-cadherin (1:400, Abcam, catalogue number ab33168) and ICAM-1 (1:250, BD Bioscience, catalogue number VE297946) in dilution buffer (0.1% Triton X-100, 3% BSA in PBS). After 1 h washing at room temperature in dilution buffer, each sample was incubated with the appropriate combination of fluorescently conjugated secondary antibodies (1:500) for 4 h at room temperature. Finally, samples were further washed in PBS and stained for 30 min at room temperature with phalloidin (1:100, Invitrogen, catalogue number 1615008) and DAPI (1:500).
Response to faecal material from healthy donors or patients with melanoma was evaluated at day 8 by adding 10 mg ml−1 faecal material diluted in Caco-2 medium on the epithelial barrier for 24 h. To evaluate the response to faecal soluble factors, faecal samples (10 mg ml−1 in Caco-2 medium) were centrifuged (1,400 g, 5 min) and filtered (0.22 μm) before treatment. LPS from E. coli O111:B4 (EC, L2630 Merck), E. coli O111:B4 (EB, tlrl-3pelps InvivoGen), P. gingivalis (tlrl-ppglps InvivoGen) and Rhodobacter sphaeroides (tlrl-prslps InvivoGen) were used at 10 μg ml−1, unless differently indicated. For experiments in anaerobic conditions, faecal sample preparation and the co-culture with complete epithelial constructs (6 h treatment on day 8) were conducted in an anaerobic workstation (A45, Don Whitley Scientific).
To assess potential therapeutic effects, chips were treated at day 8 for 24 h with the indicated combinations of faecal material or soluble factors from non-responsive or responsive patients (each at 5 mg ml−1 in Caco-2 medium), LPS EC (10 μg ml−1) or purified flagellin from S. typhimurium (100 ng ml−1, Invitrogen).
Confocal laser-scanning microscopy was performed using an Inverted Leica SP8AOBS (Leica). Z-stacks of a minimum of three random fields of view per chip were recorded. Images were analysed and quantified using Fiji (ImageJ, version 2.0.0-rc-59/1.51n).
Mucus layer characterization
To characterize the mucus layer produced by epithelial cells in the gut-on-a-chip devices, Alcian blue/eosin staining was performed. Epithelial cells were washed twice in PBS1× followed by hydration with distilled water, then stained with Alcian blue solution (Alcian blue 8GX Fluka in 3% acetic acid solution) for 45 min at room temperature. Subsequently, a 30 min eosin staining (1:10 Eosin HT110116, Sigma) was performed. Finally, three washing steps with water were performed to remove residual staining. Images were taken in widefield with Leica DM6 B (Histo Fluo) and analysed with ImageJ.
T cells adhesion assay on microvascular endothelial cells
Complete microvascular endothelial tubules (day 5) were stimulated with LPS EC (10 μg ml−1, 24 h) from the epithelial channel and, after LPS removal (day 6), pre-labelled T cells (Calcein, 0.4 μM, Life Technologies) isolated from healthy donors were injected into the microvascular endothelial channel. T cells were allowed to adhere for 30 min and then washed twice with PBS. Fluorescence images (EVOS FL Cell Imaging System, Invitrogen) of the microvascular endothelial channel were taken after injection of T cells and after the second PBS washing.
Total RNA extraction and sequencing
Epithelial cells from gut-on-a-chip devices (n ≥ 3 for each condition) were collected at day 9 post treatment, flushing trypsin-EDTA solution (Euroclone) in the channels and incubating the device for 10–20 min at 37 °C. Collected pellets were centrifuged, resuspended in 350 μl of freezing solution (40 mM dithiothreitol solution (Merck) in RLT buffer (Qiagen)) and stored at −80 °C until further processing. RNA was extracted using RNeasy Mini Kit (Qiagen catalogue number 74106), and on-column digestion DNA was performed using RNAse-Free DNase Set (Qiagen catalogue number 79254) following manufacturer’s instructions. RNA was eluted in 50 μl of RNAse-Free water. Sample quality and quantity were checked by Bioanalyzer and Qubit, respectively. Ribosomal RNA was depleted with Ribo-Zero rRNA Removal Kit and efficiency checked with Bioanalyzer 2100.
RNA sequencing libraries were prepared with Illumina TruSeq Stranded Total RNA kit following the manufacturer’s protocol. Briefly, after the fragmentation of RNA, complementary DNA was synthesized, end-repaired and 3′-end adenylated. Following adapter ligation, libraries were amplified by PCR. Amplified libraries were checked on Bioanalyzer 2100 and quantified with PicoGreen reagent. Libraries with distinct TruSeq adapter indexes were multiplexed and, after cluster generation on FlowCell, were sequenced for 50 bases in the paired-end mode on a Novaseq 6000 sequencer. Base calling was performed in real time during the Novaseq runs by Real-Time Analysis v3.4.4 (RTA, Illumina) software.
RNAseq data analysis
Generated raw paired-end reads were subjected to quality check using FastQC v0.11.9 to identify the base quality score, adapters and ambiguity reads83. Furthermore, on the basis of quality check, the reads were trimmed using Trimmomatic v0.3984. STAR aligner v2.7.10a was used to map the high-quality trimmed read to the reference genome GRCh38 for annotation85. Mapped reads were quantified using featurecounts v2.0.2 to generate the count matrix of each comparison85. Differential expression analysis was performed using edgeR v4.2.3, and the read counts <5 in all samples were removed before downstream analysis86. The remaining reads were transformed to log count per million values to perform PCA using the top 4,000 variable genes before and after considering the batch effect. The PCA was calculated using R base prcomp v4.3.1, and the plots to identify the batch effect was generated using ggplot2 v3.4.187. To obtain the DEGs, the log count per million values were subjected to limma-voom pipeline v3.52.4. DEGs were filtered using P < 0.01 and were subjected to functional profiling using clusterProfiler v4.6.2 9 (ref. 88).
To perform the upstream analysis and visualization, NetworkAnalyst v3 was used to identify the interactions between the transcription factor and genes89. The list of DEGs were mapped to the Kyoto Encyclopedia of Genes and Genomes database using Cytoscape ClueGo plugin, and the interaction between transcription factor and significant pathways were highlighted in the transcription factor–gene interaction network90. The enrichment analysis was performed on metascape online system with default parameters (minimum overlap 3, minimum enrichment 1.5, P value threshold) (https://metascape.org/gp/index.html). A set of significant DEGs was used for pathway and functional enrichment analyses using databases such as Kyoto Encyclopedia of Genes and Genomes pathway, GO, reactome, hallmark gene set and canonical pathway. Specifically, P values were calculated based on accumulative hypergeometric distribution90.
Correlation between human–mouse orthologous in vivo and chip model
Laser microdissection epithelial normalized mouse data of six conventional and six germ-free mice were used to perform the GSEA enrichment91. For duplicate genes with different expression values, the mean expression value was selected separately for conventional and germ-free mice. To perform the GSEA, gmt files were constructed using the significant GO terms (q < 0.01) enriched in the faecal microbiome and used as a reference. The GSEA enriched terms were matched, separately to all up and down GO enriched terms from faeces. The resultant list of terms was filtered out using the enrichment score of >0.5 and <−0.4. A contingency table was constructed, and two-tailed chi-square test was performed on the filtered human–mouse orthologous enriched terms.
qPCR assays
About 1 μg of total RNA was retro-transcribed with MultiScribe Reverse Transcriptase in 20 μl following manufacturer’s instructions (High-Capacity cDNA Reverse Transcription Kit, Thermo Fisher). cDNA (5 ng μl−1) was used as template in 20 μl qPCR reaction mix containing SSoFast EvaGreen Supermix (BioRad) loaded on a Fast 96-Well Reaction plate (Applied Biosystems). qPCR was then run on a QuantStudio 6 Pro System (Thermo Fisher) using the following protocol: one cycle of 2 min at 95 °C, followed by 40 cycles of a two-stage temperature profile of 95 °C for 30 s and optimal melting temperature Tm (60 °C) for 30 s. A melting curve phase was added with a first cycle of 95 °C for 1 s and two-stage temperature of 60 °C for 20 s and a ramp rate of 0.10 °C s−1 up to 95 °C. Primers used in the qPCR assays are listed in Supplementary Table 1. Quantification cycle (Cq) values were retrieved from Thermo Fisher Connect online system. GAPDH gene was used as reference house-keeping to calculate the ΔCq values. A negative control was used as reference sample in all the qPCR assays performed, to get a relative gene quantification adopting the 2−ΔΔCq formula46,92. Efficacy of primers was evaluated by performing a standard curve analysis using ten serial dilutions of the reference sample.
Bead-based multiplexed ELISA
Multiplexed ELISA on chip cultured media were performed on a Luminex 200 platform (Luminex) using custom kits of pre-mixed antibody-coated beads (R&D Systems), which included the following analytes: IL-1β, IL-6, CXCL8, VEGF, CCL20, TNF and IFNγ. Briefly, based on manufacturer’s instructions, 50 μl of media and kit standards were added to each well and incubated with a diluted microparticle cocktail at 4 °C, overnight, on a shaker (Thermomixer compact) at 850 r.p.m. After washing the unbound soluble molecules, the biotin–antibody cocktail specific to the analytes of interest was added to each well for 1 h at room temperature. Wells were washed again, and conjugated streptavidin–phycoeriythrin was added for 30 min at room temperature. After washing, microparticles were resuspended in the provided washing buffer and read on a Luminex 200 platform. The outputs (pg ml−1) were visualized and statistically analysed in Prism (version 10).
Shotgun sequencing and analyses
Fresh faecal samples from patients with melanoma were submitted for Shotgun metagenomic sequencing at the Next-Generation Sequencing Core Facility of University of Trento. Metagenomic sequence data were run through the biobakery 3 pipeline (MetaPhlAn 4.0.3 vJan21-CHOCOPhlAnSGB 202103; HUMAnN v3.6 vJan21-CHOCOPhlAnSGB 202103), which leverages a set of 99,200 high-quality and fully annotated reference microbial genomes spanning 16,800 species and 87.3 million UniRef90 functional annotations available in UniProt as of January 2019. Taxonomic profiling of taxa composition of all metagenomic samples was performed with MetaPhlAn v4.0.393 using default parameters and CHOCOPhlAnSGB v202103 as database. Functional potential analysis of the metagenomic samples was performed with HUMAnN v3.694 using default parameters.
To determine significantly differentially abundant taxa, Wilcoxon rank sum test was performed on taxonomic abundance data from metaphlan (relative abundance), with P value adjustment by false discovery rate. To determine the group with which a feature was associated, the corresponding log2 fold change was also computed, by adding an offset of 0.01 to the abundances, getting the mean relative abundance of each feature across samples within a group and, using the foldchange v3.9.5 package, getting the fold change (gtools)95 of the group means and converting it to log-ratio (foldchange2logratio).
Per-sample taxa abundances were visualized using ComplexHeatmap v2.8.0 (ref. 96).
To evaluate the functional potential of LPS synthesis, we focused on the relative abundances of UniRef90 obtained from HUMAnN v3.614 that were annotated to the LPS biosynthesis Keyword (KW-0448) in UniProt. In June 2023, this keyword contained a total of 118,650 entries. For visualization and statistical analysis, we utilized the ggplot2 v3.4.297 and ggpubr v0.6.098 packages in R v4.2.3, respectively.
Reporting summary
Further information on research design is available in the Nature Portfolio Reporting Summary linked to this article.
Responses