TRIM28-dependent developmental heterogeneity determines cancer susceptibility through distinct epigenetic states
Main
Cancer is triggered by oncogenic DNA mutations1. However, these mutations are also found at high rates in otherwise ‘healthy’ tissues, and not every mutation is oncogenic across all tissues2,3,4,5. Thus, the oncogenic potential of DNA mutations is cell, tissue and temporal specific6,7. The molecular basis of this context specificity comprises one of the biggest unanswered questions in cancer biology.
Pioneering studies over the last decades have implicated epigenetic regulation as a key mediator of tumorigenesis. Notable examples include demonstrations that cell type- and differentiation stage-specific differences in epigenetic control determine when and where transformation occurs8,9,10, and parallel to this study, transient developmental perturbation of Polycomb-dependent epigenetic silencing in Drosophila was shown to induce irreversible cell fate changes that support oncogenesis11. Collectively, these data suggest that tumors can emerge as a result of developmental epigenetic (dys)regulation. One layer of epigenetic variation that is largely overlooked in human epidemiology is ‘intrinsic developmental heterogeneity’. This layer comprises epigenetic differences that arise during development in part through stochastic processes12 that are distinct from the epigenetic changes triggered by external environmental exposures or from in utero insults that can increase cancer risk (for example, estrogens, alcohol and overnutrition or undernutrition)13,14,15,16. This intrinsic developmental heterogeneity occurs at rates several orders of magnitude higher than those of mutations17 and can drive phenotypic discordance, for instance, between monozygotic twins or isogenic mice17,18,19. While an impressive theoretic framework has been developed for how intrinsic developmental heterogeneity might impact cancer20, to our knowledge, the notion has never been tested experimentally.
Because tumor initiation involves some degree of randomness, testing the relationship between developmental heterogeneity and cancer susceptibility requires measurement of the distribution of observed outcomes comparing distinct intrinsic epigenetic states: it requires an isogenic model, raised in tightly controlled environments but bearing more than one reproducible intrinsic epigenetic state21,22. TRIM28 (also known as KAP1) is an epigenetic regulator that has an important role in heterochromatic gene silencing23,24. TRIM28 loss-of-function models have implicated the protein in cancer in a complex and tissue-specific manner25. TRIM28, however, is also a master regulator of organism-level developmental heterogeneity26. Our prior work showed that genetically and environmentally identical Trim28+/D9 haploinsufficient mice emerge into adulthood in one of two distinct phenotypes (or developmental morphs) characterized by differences in body mass composition27. The Trim28+/D9 mouse thus provides a sensitized model to detect the long-term phenotypic consequences of two distinct intrinsic developmental heterogeneity states. Here, we leverage this unique model to test whether intrinsic developmental heterogeneity regulates cancer susceptibility. We show that the two Trim28+/D9 developmental morphs develop distinct timing, severity and types of cancer. We identify a signature of DNA hypomethylated genes, installed before weaning, that stratify mice for cancer susceptibility and outcome. These same genes are frequently mutated in human cancers, and their dysregulation correlates with poor prognosis, suggesting that, if conserved, this mode of action has the potential to impact a broad portion of the population.
Results
Trim28
+/D9 mice exhibit multi-cancer syndrome
To test whether intrinsic developmental heterogeneity influences cancer, we crossed B6J.Trp53+/R270H mice with FVB.Trim28+/D9 mice (Fig. 1a). For consistency of parent-of-origin effects, we crossed Trp53+/R270H females with Trim28+/D9 males. The Trp53+/R270H mouse is a multi-cancer syndrome (MCS) model28, while the Trim28+/D9 mouse is sensitized to exhibit reproducible bistable developmental heterogeneity26,27. Both lines were highly backcrossed, and cohorts yielded isogenic offspring at expected Mendelian ratios (Extended Data Fig. 1a): wild type, Trim28+/D9 single heterozygotes (Trim28), Trp53R270H/+ single heterozygotes (Trp53) and Trp53R270H/+;Trim28+/D9 compound heterozygotes (Trp53/Trim28). Parental ID, litter size and housing density were all carefully recorded to reduce confounders. We tracked mice from birth to endpoint (70 weeks of age), monitoring each individual for sickness two to three times per week, with periodic measures of morphological, growth and metabolic characteristics (Fig. 1a). Early-life ear biopsies were obtained at 10 days of age for epigenomic profiling. Upon euthanasia, all mice underwent a systematic 21-organ dissection protocol in which tissues were isolated, processed for histology and scored by a pathologist. Cancer events were divided into aggressive (that is, mice requiring euthanasia before 70 weeks) and endpoint (that is, mice reaching the 70-week endpoint without evidence of sickness) events. The final dataset comprised 137 male mice with 79 malignant and 42 benign primary tumors and 133 female mice with 92 malignant and 36 benign primary tumors.
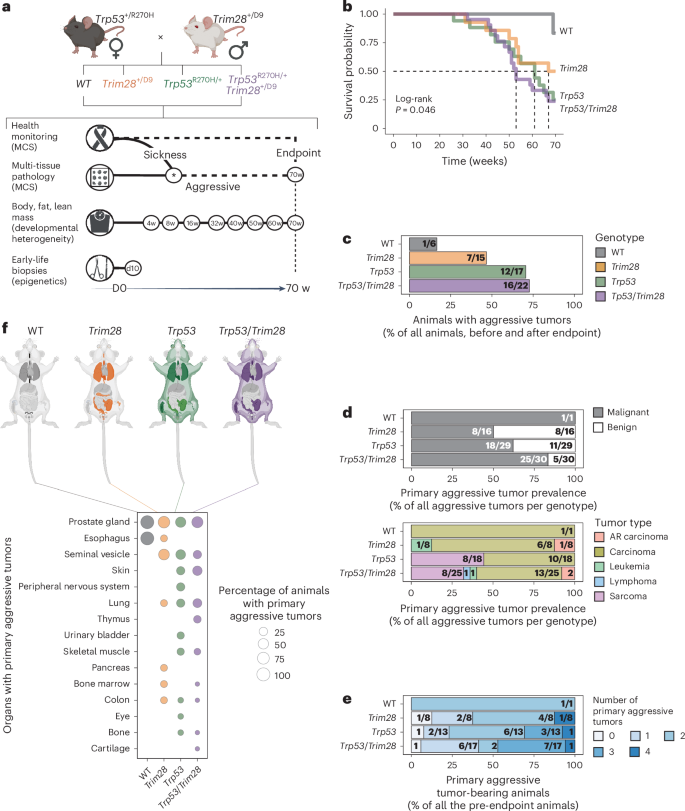
a, Schematic of the experimental plan. The Trp53+/R270H MCS model was mated with the Trim28+/D9 developmental heterogeneity model. F1 genotypes were screened for health issues and tumor development. Tissues were collected before (aggressive) or at the endpoint of the study (70 weeks (w)). Histopathology determined the presence of tumors. Body, fat and lean mass was measured at multiple time points. Early-life biopsies were collected at day (D) 10 (before weaning). b, Kaplan–Meier survival probability by genotype. Log-rank test, P = 0.046. n = 60 male mice screened for cancer (6 wild type (WT), 15 Trim28+/D9, 17 Trp53R270H/+, 22 Trp53R270H/+;Trim28+/D9). c, Prevalence of male mice with aggressive tumors, as percentage relative to total screened males in each genotype (before and after endpoint). Actual numbers are given in fractions. n = 60 males (6 WT, 15 Trim28+/D9, 17 Trp53R270H/+, 22 Trp53R270H/+;Trim28+/D9). d, Top, prevalence of malignant (gray) or benign (white) aggressive tumors (before endpoint) for each genotype, as a percentage relative to total aggressive tumors by genotype. Actual numbers are given in fractions. n = 76 malignant and benign aggressive tumors (1 in WT, 16 in Trim28+/D9, 29 in Trp53R270H/+, 30 in Trp53R270H/+;Trim28+/D9). Bottom, prevalence of distinct malignant aggressive tumor types (before endpoint) in each genotype as a percentage relative to total malignant aggressive tumors (before endpoint). Actual numbers are given in fractions (if the denominator is not specified due to space constraints, consider it the same within each genotype). n = 52 malignant aggressive tumors (1 in WT, 8 in Trim28+/D9, 18 in Trp53R270H/+, 25 in Trp53R270H/+;Trim28+/D9). AR, age-related e, Fraction of mice with 0, 1 or multiple malignant aggressive tumors (before endpoint), relative to total pre-endpoint mice. Actual numbers are given in fractions (if the denominator is not specified due to space constraints, consider it the same within each genotype). n = 39 pre-endpoint mice (1 WT, 8 Trim28+/D9, 13 Trp53R270H/+, 17 Trp53R270H/+;Trim28+/D9). f, Tissues affected by malignant aggressive tumors (before endpoint). Top, mouse anatomy plots; nontargeted tissues are in light gray, and targeted tissues are colored by genotype: WT (black), Trim28+/D9 (orange), Trp53R270H/+ (green), Trp53R270H/+;Trim28+/D9 (purple). Bottom, percentage of mice with organs targeted by malignant aggressive tumors (before endpoint) by genotype. n = 39 pre-endpoint mice (1 WT, 8 Trim28+/D9, 13 Trp53R270H/+, 17 Trp53R270H/+;Trim28+/D9). Panels a,f (top) created with BioRender.com.
Source data
As expected, Trp53R270H/+ male siblings exhibited high-penetrance MCS, with 76% of Trp53R270H/+ mice succumbing to aggressive tumors before the 70-week endpoint (Fig. 1b,c). We found 24 primary malignant tumors in Trp53R270H/+ males (mainly carcinomas and sarcomas), 18 of which developed before the 70-week endpoint (Fig. 1c). The tumors were found distributed throughout the body (Fig. 1d–f and Extended Data Fig. 1c–f). Surprisingly, Trim28+/D9 male heterozygotes also showed reduced survival probability, similar to Trp53R270H/+ male mice (Fig. 1b; mean survival of 59.9 and 56.5 weeks, respectively). Health monitoring and histopathology revealed that the reduced survival of Trim28+/D9 mice was also due to MCS. Intriguingly, Trim28+/D9 male mice showed time to detection and tumor burden similar to those of Trp53R270H/+ male mice (Fig. 1b–d, top and Fig. 1e). That said, the Trim28+/D9-triggered MCS showed several differences relative to that of Trp53R270H/+. First, Trim28+/D9 tumors included rare germ cell tumors (Extended Data Fig. 1c,d,f, right). Second, Trim28+/D9 male mice showed only a single sarcoma, whereas sarcomas were common in Trp53R270H/+ male mice (Fig. 1d, bottom and Extended Data Fig. 1d). Overall, carcinomas dominated the landscape of malignant primary tumors across genotypes (representative histology, Fig. 2). Trp53R270H/+;Trim28+/D9 compound heterozygotes showed the lowest survival probability of all genotypes (Fig. 1b), with target tissue and tumor type distributions consistent with the presence of both alleles (Fig. 1f,d). No evidence was detected of a substantial genetic interaction between the two alleles when considering overall survival or tissue distribution. Stratification revealed similar pathologies between aggressive and endpoint samples, suggesting a largely constant etiological process (Fig. 1b–e and Extended Data Fig. 1b–f). Age-associated carcinomas were detected and overrepresented in wild-type male mice, as expected (Extended Data Fig. 1d,f, right). The few sarcomas that were observed in Trim28+/D9 male mice were found at the endpoint (Extended Data Fig. 1d). Of note, Trim28+/D9 male mice exhibited a higher number of benign tumors than other genotypes before the endpoint of the study (Fig. 1d). However, these were significantly reduced by the end of the study (Extended Data Fig. 1b), suggesting that the development of malignant tumors may be temporarily delayed in Trim28+/D9 compared to Trp53R270H/+ male mice. Thus, Trim28+/D9 triggers an MCS similar to that of Trp53R270H/+.
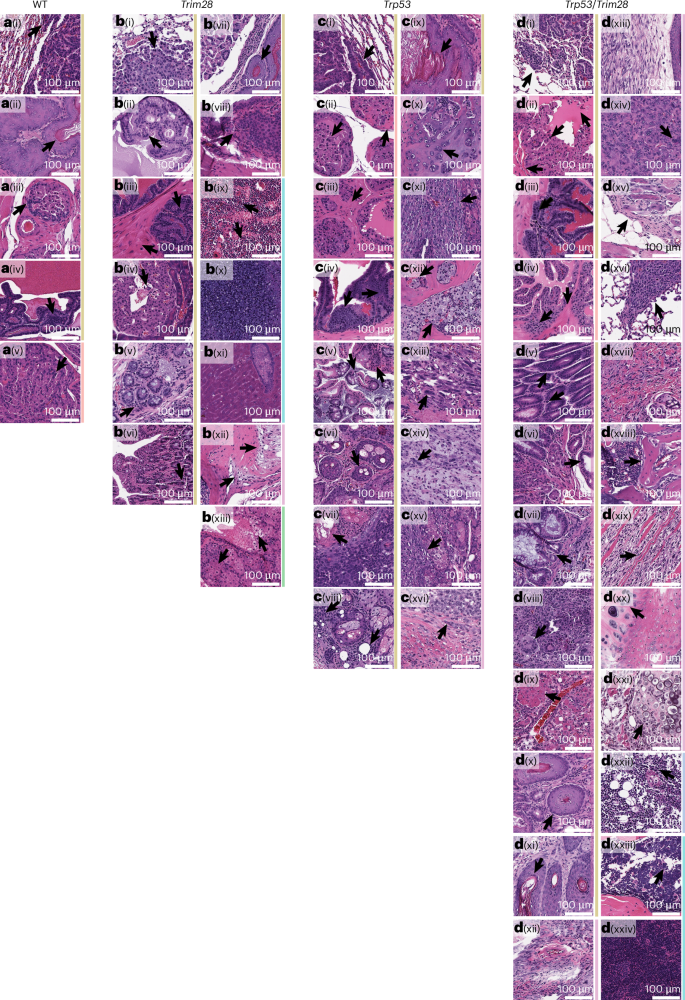
Arrows indicate main features of each tumor type. Tumor categories are color coded on the right: age-related carcinoma (red), carcinoma (gold), leukemia (light green), lymphoma (light blue), sarcoma (pink), germ cell tumors (dark green). a, WT male mice. a(i), Bronchoalveolar carcinoma (BAC). a(ii), Gastro-esophageal junction SCC. a(iii), Prostatic carcinoma (PCa). a(iv), Seminal vesicle carcinoma. a(v), Age-related PCa. b, Trim28+/D9 male mice. b(i), BAC. b(ii), PCa. b(iii), Seminal vesicle carcinoma. b(iv), Pancreatic carcinoma. b(v), Large colon ACA. b(vi), Small bowel carcinoma. b(vii), Gastro-esophageal junction SCC. b(viii), Bladder transitional cell carcinoma. b(ix), AML affecting the bone marrow. b(x), AML spreading to the spleen. b(xi), AML spreading to the liver. b(xii), Synovial sarcoma. b(xiii), Seminoma. c, Trp53R270H/+ male mice. c(i), BAC. c(ii), Age-related PCa. c(iii), PCa. c(iv), Seminal vesicle carcinoma. c(v), Large colon ACA. c(vi), Skin SCC. c(vii), Preputial gland SCC. c(viii), Adenoid cystic carcinoma. c(ix), Gastro-esophageal junction SCC. c(x), Osteosarcoma. c(xi), Fibrosarcoma. c(xii), Chondrosarcoma. c(xiii), Rhabdomyosarcoma. c(xiv), Malignant peripheral nerve sheath tumor. c(xv), Sarcoma affecting the preputial glands. c(xvi), Dermatofibrosarcoma protuberans. d, Trp53R270H/+;Trim28+/D9 male mice. d(i), BAC. d(ii), PCa. d(iii), Seminal vesicle carcinoma. d(iv), Age-related PCa. d(v), Gastro-esophageal junction ACA. d(vi), Duodenal carcinoma. d(vii), Colorectal carcinoma. d(viii), Thymic carcinoma. d(ix), Hepatoid ACA of the lung. d(x), Gastro-esophageal junction SCC. d(xi), Skin SCC. d(xii), Dermatofibrosarcoma protuberans. d(xiii), Soft tissue sarcoma. d(xiv), Epithelioid fibrohistiocytic sarcoma. d(xv), Skin appendage tumor. d(xvi), Metastatic fibrosarcoma to the lungs. d(xvii), Fibrosarcoma. d(xviii), Osteosarcoma. d(xix), Rhabdomyosarcoma. d(xx), Chondrosarcoma in the bone. d(xxi), Chondrosarcoma spreading to soft tissue. d(xxii), T cell lymphoma. d(xxiii), Acute lymphoblastic leukemia affecting the bone marrow. d(xxiv), Acute lymphoblastic leukemia spreading to the spleen.
Developmental heterogeneity primes cancer outcomes
Consistent with our previous work27, Trim28+/D9 males showed marked variation in body mass at 16 weeks of age (Fig. 3a), and these separated statistically (mclust) into two distinct developmental ‘morphs’ (reproducible phenotypic forms): Trim28+/D9-heavy and Trim28+/D9-light (Fig. 3b,c and Extended Data Fig. 2a,b). Trp53R270H/+;Trim28+/D9 compound heterozygotes also showed high variation in body mass, indicating that the intrinsic developmental heterogeneity triggered by Trim28+/D9 is maintained in the presence Trp53R270H/+; however, bimodality could not be statistically resolved (Fig. 3b,c and Extended Data Fig. 2a,b). Neither wild-type nor Trp53R270H/+ heterozygotes showed a significant variance phenotype (Fig. 3a,b) or bimodality (Fig. 3a–c and Extended Data Fig. 2a,b). We validated the annotation of morphs using Rmixmod and found 100% congruence with mclust (Extended Data Fig. 2c). Notably, these phenotypic distinctions between morphs were transient over the long term (Extended Data Fig. 2a). The developmental bifurcation in Trim28+/D9 mice was critical to our experimental design, because it enables statistical comparison of cancer outcomes between groups of isogenic mice with reproducible and distinct intrinsic developmental heterogeneity outcomes (Fig. 3b and Extended Data Fig. 2a). Unfortunately, females from these cohorts (Extended Data Fig. 2d) did not emerge as confidently separable bimodal groups (Extended Data Fig. 2e–g), nor did they show substantial cancer incidence (Extended Data Fig. 2h,i).
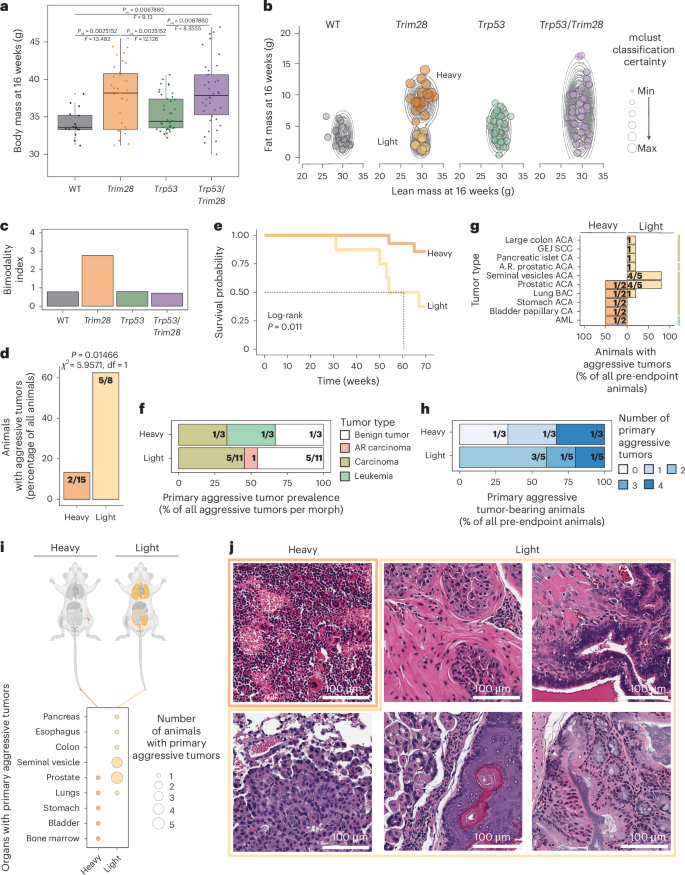
a, Body mass distribution at 16 weeks by genotype. Each dot represents one male. Box plots show 25th, 50th (median) and 75th percentiles, with whiskers extending to 1.5 × interquartile range of the hinge and outliers plotted individually. Two-sided Levene’s test, Benjamini–Hochberg adjusted. Significance for adjusted P value (Padj) < 0.05: WT versus Trim28+/D9, Padj = 0.0025152 (F = 13.482); WT versus Trp53R270H/+, Padj = 0.2031600 (F = 1.9399); WT versus Trp53R270H/+;Trim28+/D9, Padj = 0.0067860 (F = 9.13); Trim28+/D9 versus Trp53R270H/+, Padj = 0.0025152 (F = 12.126); Trim28+/D9 versus Trp53R270H/+;Trim28+/D9, Padj = 0.8220000 (F = 0.051); Trp53R270H/+;Trim28+/D9 versus Trp53R270H/+, Padj = 0.0067860 (F = 8.5555). n = 130 male mice (16 WT, 35 Trim28+/D9, 41 Trp53R270H/+, 38 Trp53R270H/+;Trim28+/D9). b, Fat and lean mass data at 16 weeks by genotype, with overlaid mclust density estimation. Each dot represents one male; dot size is proportional to mclust classification certainty. n = 138 male mice (18 WT, 36 Trim28+/D9, 43 Trp53R270H/+, 41 Trp53R270H/+;Trim28+/D9). c, Bimodality index: ratio of mclust-determined Bayesian information criterion (BIC) for two clusters over one from fat and lean mass data at 16 weeks. n = 138 male mice (same as in b: 18 WT, 36 Trim28+/D9, 43 Trp53R270H/+, 41 Trp53R270H/+;Trim28+/D9). d, Proportion of Trim28+/D9-heavy and Trim28+/D9-light males with malignant aggressive tumors as a percentage of males per group (before and after endpoint). Actual numbers are given in fractions. Two-sided two-sample test for equality of proportions without continuity correction; significance for P < 0.05: heavy versus light, P = 0.01466, χ2 = 5.9571, degrees of freedom (df) = 1. n = 23 male mice (15 heavy, 8 light). e, Kaplan–Meier survival probability of Trim28+/D9-heavy and Trim28+/D9-light mice. Log-rank test, P = 0.011. n = 23 males (15 heavy, 8 light). f, Prevalence of aggressive tumor types in Trim28+/D9-heavy and Trim28+/D9-light mice as a percentage of total aggressive tumors per group. Actual numbers are shown in fractions. n = 14 tumors (malignant and benign; 3 in heavy and 11 in light). g, Distribution of tumor types in Trim28+/D9-heavy and Trim28+/D9-light mice, as a percentage of mice with malignant aggressive tumors per group. Actual numbers are shown in fractions. Right, age-related carcinoma (red), carcinoma (gold), leukemia (light green). CA, carcinoma; GEJ, gastro-esophageal junction. n = 7 males (2 heavy, 5 light). h, Fraction of Trim28+/D9-heavy and Trim28+/D9-light mice with 0 or multiple malignant aggressive tumors. Actual numbers are shown in fractions. n = 8 males (3 heavy, 5 light). i, Tissues targeted by malignant aggressive tumors by genotype. Top, mouse anatomy plots; nontargeted tissues are in light gray, and targeted tissues are colored by genotype: WT (black), Trim28+/D9 (orange), Trp53R270H/+ (green), Trp53R270H/+;Trim28+/D9 (purple). Bottom, organs with malignant aggressive tumors by morph. n = 7 males (2 heavy, 5 light). j, Histological examples of aggressive malignant tumors in Trim28+/D9-heavy and Trim28+/D9-light mice. Top left, AML, heavy (as in Fig. 2). Top middle, prostatic ACA, light. Top right, seminal vesicle ACA, light. Bottom left, BAC, light. Bottom middle, gastro-esophageal junction SCC, light. Bottom right, colon ACA, light. n = 7 males (2 heavy, 5 light). Panel i, top created with BioRender.com.
Source data
Trim28+/D9 males from the cohort thus satisfied the experimental design requirements for testing whether intrinsic developmental heterogeneity impacts cancer outcomes, namely, a reproducible developmental bifurcation and a spontaneous MCS. We therefore compared survival, tumor prevalence and associated tumor outcomes between light and heavy Trim28+/D9 male mice (Fig. 3d–j). Intriguingly, whereas 87% of Trim28+/D9-heavy mice reached the endpoint free of illness, the majority of Trim28+/D9-light mice showed aggressive MCS (Fig. 3d–j). Mean survival time was reduced in the Trim28+/D9-light group, indicating a significantly accelerated disease course (57.4 and 68.5 weeks, respectively) (Fig. 3e). The only two Trim28+/D9-heavy mice requiring euthanasia before the endpoint had bone marrow-derived acute myeloid leukemia (AML; Figs. 3e–j, top left and 2) and a set of four different primary carcinomas (Fig. 3e–i). Trim28+/D9-light mice in the aggressive group exhibited up to four different primary tumors per mouse (Fig. 3h), mainly consisting of carcinomas, age-related carcinomas and benign tumors (Fig. 3f). Of these, malignant tumors were found in seminal vesicles, the prostate, the pancreas, lungs, the esophagus and the colon (Figs. 3g,i,j, top middle and right, bottom and 2). Consistent with the differential timing of cancer onset between light and heavy mice, the endpoint analysis was dominated by tumors from Trim28+/D9-heavy mice (Extended Data Fig. 3a–e). TRIM28 protein expression measures made at the endpoint in healthy, but cancer-prone, tissues (seminal vesicles, prostates, lungs, intestines and pancreata) showed no remarkable differences across genotypes and between Trim28+/D9-light and Trim28+/D9-heavy mice (Extended Data Figs. 3f and 4). Although these data do not exclude the possibility that TRIM28 is differentially expressed between morphs in a specific window of development, they argue against TRIM28 dosage effects as underpinnings for the observed differences in cancer outcomes. Thus, Trim28+/D9-light developmental morphs exhibit an accelerated MCS. The data provide genetic evidence that TRIM28-dependent developmental heterogeneity controls later-life cancer outcomes.
Cancer risk morphs show unique early-life epigenetic states
We reasoned that if developmentally programmed epigenetic differences impact cancer susceptibility and outcomes later in life, then these differences should be detectable early in life. Therefore, we performed DNA methylation profiling on biopsies from the same male mice at 10 days of age (that is, before weaning). We used ear clips, as they are considered minimally invasive for young mice and similar to tissues used to detect early-life epigenetic signatures in humans29,30. We used Illumina Infinium Mouse Methylation BeadChips to quantify DNA methylation at ~285,000 CpG sites including most annotated genes, functional RNAs and cis-regulatory regions of the mouse genome31. Global DNA methylation profiles were highly correlated across genotypes, indicating robust methodology (Fig. 4a, rows 1–4). Notably, samples containing the Trim28+/D9 allele (Trim28+/D9 and Trp53R270H/+;Trim28+/D9) exhibited approximately three times more differentially methylated CpG loci (DML) than those with Trp53R270H/+ alone when comparing to wild-type mice (Fig. 4b). DML in Trim28+/D9 and in Trp53R270H/+;Trim28+/D9 double mutants overlapped strongly (Fig. 4a–d), indicating that Trim28+/D9 reproducibly changes the early-life methylome.
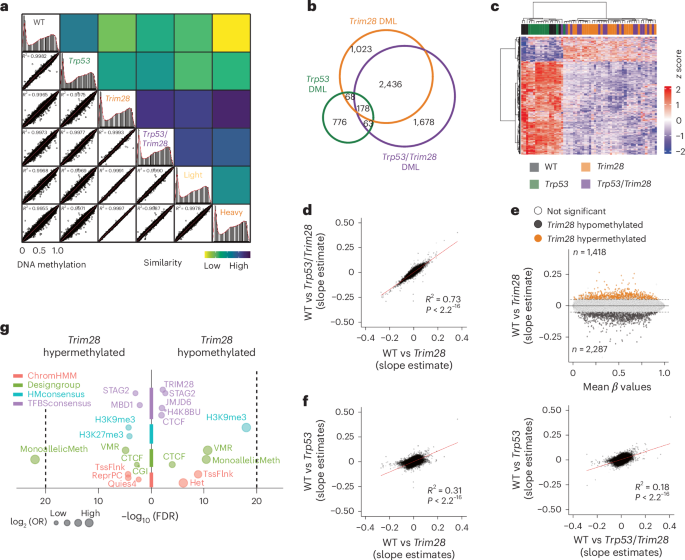
a, Right, correlation plots comparing global DNA methylation on all available probes among all genotypes and Trim28+/D9-heavy and Trim28+/D9-light morphs as the sum of squared residuals from linear regressions. Left, density plots of β-value distribution for all genotypes and trajectories. R2 values derive from Pearson correlations. n = 58 (7 WT, 24 Trim28+/D9, 11 Trp53R270H/+, 16 Trp53R270H/+;Trim28+/D9). b, Overlap of DML between Trim28+/D9, Trp53R270H/+;Trim28+/D9, Trp53R270H/+ and WT mice. n = 58 (7 WT, 24 Trim28+/D9, 11 Trp53R270H/+, 16 Trp53R270H/+;Trim28+/D9). c, Heatmap of the z score of log1p-transformed β values of differentially methylated probes in all genotypes relative to WT mice. Effect size cutoff = 0.1; P-value cutoff = 0.05 by t-testing slope estimates. n = 58 (7 WT, 24 Trim28+/D9, 11 Trp53R270H/+, 16 Trp53R270H/+;Trim28+/D9). d, Correlation plot comparing DNA methylation levels (slope estimate) on all available probes in WT versus Trp53R270H/+;Trim28+/D9 and WT versus Trim28+/D9 mice. R2 value = 0.73; P < 2.2−16 (two-sided Pearson correlation). n = 58 (7 WT, 24 Trim28+/D9, 11 Trp53R270H/+, 16 Trp53R270H/+;Trim28+/D9). e, M (slope intercept) A (average mean β-value) plot of differential DNA methylation levels (slope estimate) in WT versus Trim28+/D9 mice. n = 31 (7 WT, 24 Trim28+/D9). Black and orange dots represent hypomethylated and hypermethylated probes in Trim28+/D9 mice, 2,287 and 1,418 probes respectively. White dots are nonsignificant DML (estimate and P-value cutoff = 0.05). f, Correlation plots comparing DNA methylation levels (slope estimate) on all available probes in WT versus Trp53R270H/+ (left) and WT versus Trp53R270H/+;Trim28+/D9 mice (right). R2 values = 0.31 and 0.18; P < 2.2−16 (two-sided Pearson correlation). n = 58 male mice (7 WT, 24 Trim28+/D9, 11 Trp53R270H/+, 16 Trp53R270H/+;Trim28+/D9). g, Enrichment plots of features for Trim28+/D9-dependent differentially methylated probes. H3K27me3, histone H3 Lys27 trimethylation; H4K8BU, histone H4 Lys8 butyrylation; Het, heterochromatin; MonoallelicMeth, monoallelic methylation; OR, odds ratio; Quies, quiescent gene; ReprPC, repressed by Polycomb; TssFlnk, flanking active TSS; VMR, variably methylated regions. False discovery rate (FDR) cutoff = 0.01 (one-tailed Fisher’s exact test). n = 58 male mice (7 WT, 24 Trim28+/D9, 11 Trp53R270H/+, 16 Trp53R270H/+;Trim28+/D9).
Source data
Relative to wild type, Trim28+/D9 biopsies showed an overall reduction in DNA methylation (Fig. 4e). This is consistent with the role of TRIM28 in gene silencing23,24. Interestingly, Trp53R270H/+ mice also showed signs of early-life epigenetic changes, with some similarity to Trim28+/D9-induced changes (Fig. 4f), consistent with evidence that p53 indirectly modulates DNA methylation levels32,33. Trim28+/D9 hypomethylated DML were enriched in regions targeted by TRIM28, with probe set enrichment analysis revealing annotations for heterochromatin, monoallelic methylation, Polycomb silencing, CCCTC-binding factor (CTCF), TRIM28 binding and histone H3 Lys9 trimethylation (H3K9me3) (Fig. 4g). Thus, TRIM28 dosage is required to maintain the fidelity of early-life DNA methylation patterns at heterochromatic regions.
Importantly, DNA methylation differences were also detected between Trim28+/D9 mice that would later go on to become light versus heavy, despite the isogenicity of these groups and the lack of detectable phenotypic differences at this early age (Figs. 5a–c and 4a, rows 5 and 6). Specifically, we found 1,133 DML between the two Trim28+/D9 morphs, including a clear skew toward relative hypomethylation in the light, cancer-prone morph (Fig. 5a,b). This signature was partially maintained in three of four tissues when tested later in life (Fig. 5d). Based on correlation, the light morphs were technically more similar to wild-type mice (Fig. 4a). Furthermore, we found a specific correlation between the average level of methylation of light-specific hypomethylated probes and 16-week fat mass content in Trim28+/D9 mice but not in other genotypes (Fig. 5e,f). This indicates that the light-specific signature is not an obesity-related signature.
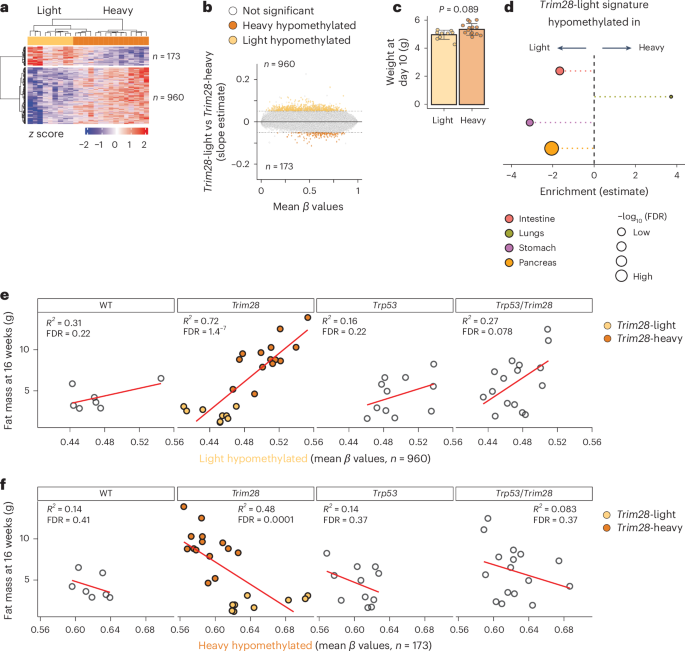
a, Heatmap reporting z-score transformed β values of differentially methylated probes in Trim28+/D9-heavy versus Trim28+/D9-light mice. Effect size cutoff = 0.05; P-value cutoff = 0.001 by t-testing the slope estimates. n = 24 male mice (15 Trim28+/D9-heavy, 9 Trim28+/D9-light). b, MA plot of differential DNA methylation levels (slope estimate) in Trim28+/D9-heavy versus Trim28+/D9-light male mice. Dark and light orange dots represent hypermethylated and hypomethylated probes in Trim28+/D9-light mice, respectively (estimate and P-value cutoff = 0.05 by t-testing the slope estimates). White dots are not significant. n = 24 male mice (15 heavy, 9 light). c, Weight at day 10 of Trim28+/D9-light and Trim28+/D9-heavy male mice used for DNA methylation array experiments. n = 24 male mice (15 heavy, 9 light). P value = 0.089 (unpaired two-sample Wilcoxon test). d, Enrichment plot of Trim28+/D9-light hypomethylated probes in Trim28+/D9-light versus Trim28+/D9-heavy male mice in the indicated tissues. FDR cutoff = 0.01 (one-tailed Fisher’s exact test). n = 46 tissues (12 pancreata, 12 lungs, 11 stomachs, 11 intestines). e,f, Scatterplots showing the correlation by genotype between the average level of DNA methylation on the indicated probe sets (Trim28+/D9-light or Trim28+/D9-heavy hypomethylated probes) and fat mass at 16 weeks. Colors indicate the morphs: Trim28+/D9-light (light orange) and Trim28+/D9-heavy mice (dark orange). n = 58 male mice (7 WT, 24 Trim28+/D9, 11 Trp53R270H/+, 16 Trp53R270H/+;Trim28+/D9).
Source data
Early-life Trim28+/D9-light hypomethylated DML were detected preferentially at transcribed (transcribed and weakly transcribed states, 6% of light- and 1% of heavy-specific probes; Fig. 6a) and active and bivalent (72% versus 55% of probes, respectively; Fig. 6b) transcriptional start sites (TSS) as well as at CpG islands (CGIs; 14% versus 10% of probes) and shelf regions (4% versus 1% of probes). Trim28+/D9-heavy mice, by contrast, were hypomethylated at repressed weak Polycomb domains (14% versus 2% of probes; Fig. 6a) and regions flanking the TSS and TSS-distal regions (>150 kb from the TSS, 14.4% versus 8.7%; Fig. 6c). Of note, differential CGI methylation preferentially impacted intermediately methylated CGIs and not canonical unmethylated CGIs (Fig. 6d). Essentially no differential DNA methylation was detected in canyons34,35 (Fig. 6e), suggesting that these regions are refractory to the TRIM28 early-life heterogeneity effects. Heavy-specific hypomethylation was also enriched at genic and strong enhancers (47% versus 26% of probes), while light-specific hypomethylation was enriched at poised and weak enhancers (57% versus 40% of probes) (Fig. 6f). Thus, Trim28+/D9 cancer susceptibility morphs exhibit early-life epigenome differences at repressive and cis-regulatory regions.
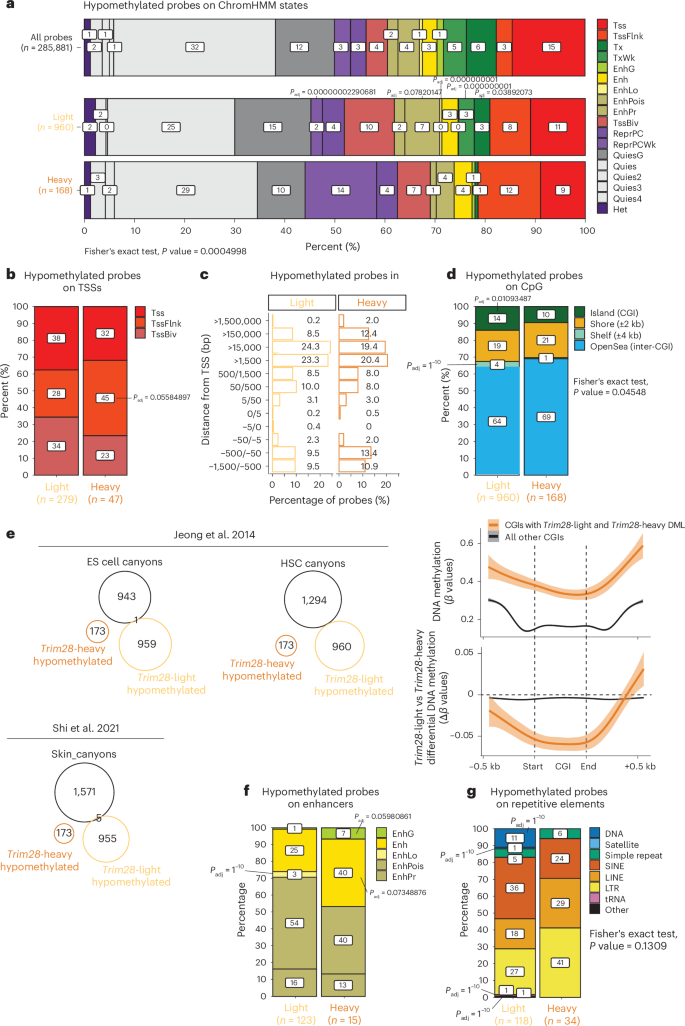
a, Stacked bar plots showing the distribution of hypomethylated probes from Trim28+/D9-light and Trim28+/D9-heavy male mice across ChromHMM states. Statistical significance was assessed using a two-sided Fisher’s exact test with a simulated P value (based on 2,000 replicates); P = 0.0005. Asterisks mark regions enriched in either Trim28+/D9-light or Trim28+/D9-heavy hypomethylated probes, with statistical significance determined by a hypergeometric test and FDR correction (Padj < 0.1). The overall distribution of all array probes is included for comparison. n = 24 male mice (15 heavy, 9 light). Tss, active TSS; Tx, transcription; TxWk, weak transcription; EnhG, genic enhancer; Enh, enhancer; EnhLo, weak enhancer; EnhPois, poised enhancer; EnhPr, primed enhancer; TssBiv, bivalent TSS; ReprPCWk, repressed by Polycomb, weak. b, Stacked bar plots display the distribution of hypomethylated probes across TSSs, with adjusted P values indicating regions enriched in Trim28+/D9-light and Trim28+/D9-heavy probes. Statistical significance was determined by a one-sided hypergeometric test with FDR correction (Padj < 0.1). n = 24 male mice (15 heavy, 9 light). c, Bar plots showing the distribution of Trim28+/D9-light and Trim28+/D9-heavy hypomethylated probes relative to TSSs. n = 24 male mice (15 heavy, 9 light). d,f,g, Stacked bar plots representing the distribution of hypomethylated probes across enhancers (d), CGIs (f) and repetitive elements (g). SINE, short interspersed nuclear element; LINE, long interspersed nuclear element; LTR, long terminal repeat; tRNA, transfer RNA. Statistical significance was assessed using Fisher’s exact test with a simulated P value and the hypergeometric test with FDR correction (Padj < 0.1). n = 24 male mice (15 heavy, 9 light). d, Bottom, DNA methylation levels in Trim28+/D9-light and Trim28+/D9-heavy male mice at CGIs with DML (orange) and other CGIs (black), presented with linear model smooth lines and 0.95 confidence intervals (‘lm’ method). e, Overlap of hypomethylated probes from Trim28+/D9-light and Trim28+/D9-heavy mice with annotated DNA methylation canyons in embryonic stem (ES) cell, hematopoietic stem cells (HSCs)34 and mouse skin35. n = 24 male mice (15 heavy, 9 light).
Source data
Given the role of TRIM28 in regulating repetitive elements36, we also checked these regions. Interestingly, light mice showed specific hypomethylation at DNA repeats, satellites and transfer RNAs. Trim28+/D9-heavy mice, instead, showed relative hypomethylation at retrotransposons (29% and 41% of probes on long interspersed nuclear elements and long terminal repeats in heavy mice, compared with 18% and 25% in light mice) (Fig. 6g).
Probe set enrichment analysis revealed differential methylation predominantly at regions of monoallelic methylation and imprinting, including the Kcnq1-Kcnq1ot1 cluster, H19 and Peg3 (Fig. 7a, top, green and bottom, light orange) and regions annotated as decorated with H3K9me3 and H3K27me3 (Fig. 7a, top, light blue). A search for overlap with transcription factor binding (Fig. 7a, top, purple) revealed strong and specific enrichment for DNA methylation-binding proteins (MBD1, MECP2, C17orf96, DPPA2 and TRIM28 itself) and Polycomb-silencing machinery (SUZ12, EZH2, C17orf96, RNF2, AEBP2, PCGF2, CBX7, BMI1 and JARID2). Enrichment was also observed for probes within the epigenetic aging clock (Fig. 7a, top, green). Representative DML between Trim28+/D9-light and Trim28+/D9-heavy mice are shown in Extended Data Fig. 5a–d. Collectively, these data suggest that Trim28+/D9-light mice have more permissive chromatin at regions that would otherwise be silenced. Thus, early-life methylation signatures can distinguish developmentally programmed cancer susceptibility states.
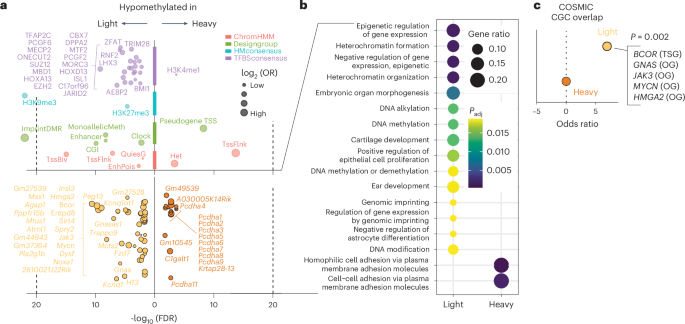
a, Enriched features (top) and genes (bottom) for probes differentially methylated between Trim28+/D9-heavy and Trim28+/D9-light mice. H3K4me1, histone H3 Lys4 monomethylation. Bottom, the number of genes found differentially methylated is reported for Trim28+/D9-heavy and Trim28+/D9-light mice. FDR cutoff = 0.01 (one-tailed Fisher’s exact test). b, Gene Ontology enrichment plot of biological processes enriched in DML between Trim28+/D9-heavy versus Trim28+/D9-light mice. The size of the dots represents the gene ratio, while the color represents the Padj value for each term; Fisher’s exact test P value with Benjamini–Hochberg adjustment for multiple comparisons, cutoff = 0.05. The number of total genes analyzed in each group is reported. c, Odds ratio from one-sided Fisher’s exact tests, testing the statistical significance of enrichment between genes enriched by hypomethylated probes in Trim28+/D9-heavy (dark orange) and Trim28+/D9-light mice (light orange) and the COSMIC Cancer Gene Census (CGC; https://cancer.sanger.ac.uk/census). OG, oncogene; TSG, tumor-suppressor gene. P = 0.0002. In a–c, n = 24 male mice (15 Trim28+/D9-heavy, 9 Trim28+/D9-light).
Source data
TRIM28 silences oncogenes early in life
Interestingly, genes specifically hypomethylated in Trim28+/D9-light mice were also enriched for epigenetic regulators of gene expression, heterochromatin formation, heterochromatin organization, genomic imprinting, DNA methylation and DNA alkylation (Fig. 7a, bottom, light orange and Fig. 7b). Thus, light, cancer-prone Trim28+/D9 morphs exhibit hypomethylation at coding regions of epigenetic silencers and at their targeted genomic regions (Fig. 7a, top left).
This light-specific hypomethylated gene signature was globally downregulated (Extended Data Fig. 5e), which correlates with its hypermethylated state in Trim28+/D9 mice compared with wild-type mice (Extended Data Fig. 5f). RNA sequencing (RNA-seq) of matched healthy and tumor tissues from cancer-susceptible organs in the Trim28+/D9 model revealed that Trim28+/D9-light hypomethylated genes were globally upregulated in tumors, gene- and tissue-specific effects notwithstanding (Extended Data Fig. 5g,h). These genes were also differentially expressed in Trim28+/D9-light versus Trim28+/D9-heavy tumors (Extended Data Fig. 5i), suggesting involvement in defining the two developmental cancer susceptibility states. We did not observe any difference in mutational rate in Trim28+/D9-light hypomethylated genes, comparing light and heavy mice (Extended Data Fig. 5j).
Given that later-life metabolic phenotypes distinguish the two developmental morphs, we tested for dysregulation of metabolic pathways. Of 674 annotated metabolic pathways, only 5 showed evidence of pathway-level change. Specifically, Trim28+/D9-light hypomethylated DML showed modest enrichment in nucleobase-containing metabolic pathways (Extended Data Fig. 6a). The data are consistent with the lack of detectable early-life metabolic differences between morphs. Thus, epigenome rewiring occurs before observable metabolic differences between Trim28+/D9 morphs.
Next, we asked whether the observed early-life dysregulation was likely to impact cancer outcomes. Querying the Jensen DISEASES database37, we found enrichment of imprinting disorders and cancer associations in light versus heavy differentially methylated ‘signature’ genes (Extended Data Fig. 6b). Similarly, querying the COSMIC Cancer Gene Census, a database of high-confidence human oncogenes and tumor-suppressor genes38, we found that Trim28+/D9-light hypomethylated genes were significantly enriched for known human oncogenes (GNAS, JAK3, MYCN and HMGA2) (Fig. 7c). Also, focusing on The Cancer Genome Atlas (TCGA) Pan-Cancer Atlas39, we found that patients with mutations in TRIM28+/D9-light hypomethylated signature genes showed reduced overall survival probability (Fig. 8a, left) and a striking difference in time to relapse (Fig. 8a, right) compared to patients bearing other mutations. This was true for male and female patients (Extended Data Fig. 6c,d). The same analyses of orthologs for hypermethylated genes in light (hypomethylated in heavy) mice showed no significant differences (Extended Data Fig. 6e). Stratifying the data by tumor type showed widespread tumor-promoting effects in orthologs of essentially all TRIM28+/D9-light signature genes, with significantly reduced survival rates across many tumor types (Fig. 8b and Extended Data Fig. 6f) and sex-specific effects of distinct mutations (Extended Data Fig. 6g,h). Of note, prostatic adenocarcinoma (ACA), the most prevalent cancer type in Trim28+/D9-light mice (Fig. 3g,i and Extended Data Fig. 3b,d), showed cancer-accelerating associations with nearly all human orthologs of light-specific signature genes (Fig. 8b, leftmost column and Extended Data Fig. 6f,h). A tissue-specific effect was also observed when looking at the correlation between gene expression or DNA methylation at TSSs of Trim28+/D9-light signature genes and survival (Extended Data Fig. 7). Well-known oncogenes showed the strongest and most consistent effects. For example, HMGA2 expression was consistently associated with poor overall and disease-free survival across multiple cancer types. Consistent with canonical DNA methylation-dependent silencing at TSSs, the DNA methylation level at the HMGA2 TSS was positively associated with survival. This reciprocal pattern of correlation was unequivocal across multiple cancers including head and neck squamous cell carcinoma (SCC), kidney renal clear cell carcinoma, pancreatic ACA and mesothelioma (Extended Data Fig. 7). Of note, germ cell tumors contained the most correlations between DNA methylation levels and overall survival (Extended Data Fig. 7). This type of tumor is known to be associated with globally demethylated DNA40. Finally, we also tested for mutational co-occurrence, a phenomenon that can highlight potential additive or synergistic potential among mutations. Consistent with the phenotype of the Trim28+/D9-light morphs, co-occurrence of light signature gene mutations was markedly overrepresented in human primary tumors (Fig. 8c). Thus, the early-life Trim28+/D9-dependent epigenome regulates bona fide oncogenes.
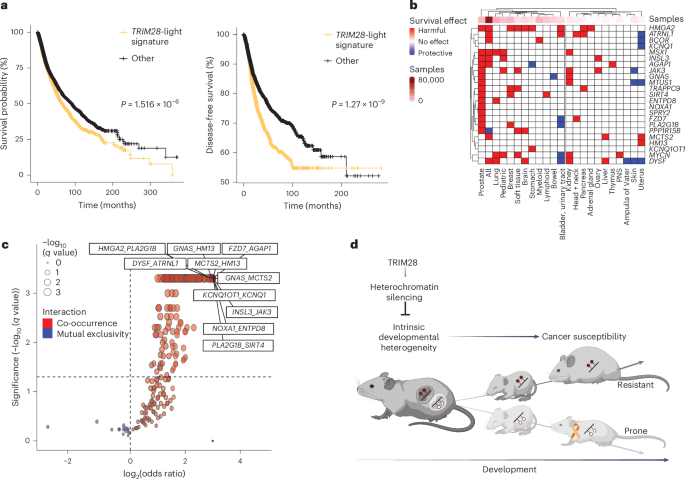
a, Left, Kaplan–Meier survival probability as a percentage of the total population and time of survival in months. Log-rank test, P = 1.516 × 10⁻⁶. Total samples analyzed, 10,967. Right, Kaplan–Meier disease-free survival probability. Log-rank test, P = 1.27 × 10⁻⁹. Left and right, all TCGA Pan-Cancer Atlas patients with mutations in genes from the TRIM28+/D9-light hypomethylated signature (light orange, n = 3,766 samples) are compared to individuals without mutations in the same genes (black, n = 7,180 samples). b, Heatmap of the effects on overall survival probability of mutations in the indicated genes and tumor tissues. The analysis includes all samples from TCGA and non-TCGA studies with no overlapping samples, from cBioPortal (n = 69,223 samples). Tumor tissues are separated in two main branches according to sample number informing the analysis (left, >3,000 samples; right, <3,000 samples). PNS, peripheral nervous system. c, Volcano plot showing the type of interaction for pairwise mutations in genes from the TRIM28+/D9-light hypomethylated signature in all TCGA Pan-Cancer Atlas patients. Red indicates co-occurrence, and blue indicates mutual exclusivity of pairwise mutations. One-sided Fisher’s exact test, Benjamini–Hochberg Padj cutoff = 0.05. Total samples analyzed, 10,967. d, Our model suggests that TRIM28 buffers intrinsic developmental heterogeneity via heterochromatin silencing. By modulating a differentially methylated cancer-related gene set, it primes two distinct developmental trajectories for cancer susceptibility and outcomes, with one of the trajectories being more resistant and the other prone to cancer. Created with BioRender.com.
Source data
Overall, these data identify Trim28+/D9-light signature genes as putative mediators of the altered cancer susceptibility states found in Trim28+/D9 male mice. They suggest a model in which intrinsic differences in early-life epigenetic programming influence cancer outcomes (Fig. 8d).
Discussion
Here, we demonstrate that (TRIM28-buffered) intrinsic developmental heterogeneity induces an epigenetically defined developmental bifurcation early in life, which is linked to distinct cancer susceptibility later in life. Specifically, TRIM28 haploinsufficiency generates two reproducible developmental morphs (at the organismal level) that differ in their cancer susceptibility: one relatively ‘prone’ and one ‘resistant’, where these two categories correspond to accelerated and delayed tumor development. This idea has parallels to epigenetic heterogeneity effects described within tumors and between tumors, except at the interorganismal level. How meta-stable states between identical cells or organisms are imposed remains unclear, although pioneering work with variegating reporters implicates epigenetic silencing machinery41,42. It has been suggested that a key condition for the emergence of alternate cellular states is the epigenetic reorganization of the genome43,44. Feinberg and Levchenko20 provided a theoretical framework for how genetic and epigenetic networks might generate meta-stable functional states across cells, a potential energy landscape model that includes energy wells or ‘attractors’. In that model, DNA mutations and/or changes in epigenetic topology (for example, DNA methylation or histone modifications) can alter that landscape and create alternate attractor states. Our data provide evidence that these concepts hold true at the organismal scale and that these differences can have real consequences for carcinogenesis. They suggest that TRIM28-dependent silencing helps define the shape of the potential energy landscape (for example, by controlling the depth of or barrier between attractor states). In the same way that oncogenic mutations have different effects depending on the cellular developmental stage8,45, our data suggest that oncogenesis can also be influenced by organism-wide epigenetic programs that are established in development.
This study also bridges two key questions in cancer epigenetics: how does cellular epigenetic state dictate oncogenic transformation8,9,10,46,47,48, and how do early-life epigenetic cues modulate cancer risk21,22,46? Our data suggest that interindividual differences in early-life epigenome organization influence differential cancer development, prevalence and survival. The interindividual epigenetic differences identified in this study, alongside prior work indicating that H3K9me3 strongly correlates with tumor mutation density49, suggest that one potential mechanism for the observed differential cancer outcomes between morphs is an altered resistance to mutation. Once tumors were established, we could not detect significant differences in mutations between the two morphs, arguing against a model where TRIM28 buffers against a small number of very specific hotspot mutations. We also detected important differences in Polycomb-targeted genes (which have been recently associated with cancer-prone cell fates11) and poised and bivalent regions between the cancer susceptibility morphs. During tumorigenesis, these regions are sensitive to regulation by DNA methylation and correlate with cell ‘stemness’ (refs. 47,48,50). Regardless, the provocative implication from our data is that individual cancer susceptibility may have as much to do with the epigenetic ‘background’ we are born with as it does with DNA mutation, external environment and cell of origin. Just as prior work demonstrated that epigenetic dysregulation at specific genes drives tumorigenesis in specific tissues and cell differentiation stages, we would expect that the DML identified here trigger tissue-specific and developmental stage-specific effects. Key questions to understand include when the distinct cancer-susceptible epigenetic backgrounds become ‘activated’ in the Trim28+/D9 line, why some tissues are more sensitive than others and how sensitive these effects are to genetic background. A previous report indicated parent-of-origin-specific effects of TRIM28 in regulating imprinting51. A priority comparison for the future will therefore be to evaluate whether inheritance of Trim28 haploinsufficiency from one or the other parent triggers differing outcomes.
Of note, our findings are distinct from the published TRIM28 oncogene and tumor-suppressor functions25 that derive from experiments using complete (homozygous) knockouts. In contrast to homozygous knockout models, the Trim28+/D9 mouse exhibits near normal levels of TRIM28 (ref. 27). Given the presence of TRIM28 in several complexes (TRIM28 co-repressor complex, NuRD, CoREST, PML-NB, BORG–TRIM28, ZMYM2–TRIM28, MAGE–TRIM28, HUSH or ATM–CHK2 and ATR–CHK1 (refs. 52)), this is an important distinction between the models. The DNA methylation differences between light and heavy morphs suggest that Trim28+/D9 specifically affects the TRIM28 silencing function. This fundamental difference between models may explain for instance why Trim28-knockout models develop liver tumors53 and Trim28+/D9 mice do not.
Our work provides genetic evidence that intrinsic developmental heterogeneity influences overall cancer risk. The ability to show this effect in multiple tissue types is both a strength and a limitation of this study. By focusing on an MCS model, we demonstrate that differential susceptibility is a property of the entire organism and can identify responsive tissues. Thousands of animals would, however, be needed to draw the same conclusions for all the observed cancer subtypes including rare cancers. Likewise, and because the Trim28+/D9 mutation in this model occurs in the whole body, it will be difficult to use the Trim28+/D9 mouse (by itself) to dissect the molecular mechanisms that underlie each observed cancer. A natural extension therefore is to refine the model to understand the mechanistic basis of developmentally primed cancer susceptibility for each cancer type.
We also did not characterize the interaction between the Trp53R270H and Trim28D9 alleles. While we originally expected Trp53R270H/+;Trim28+/D9 mice to exhibit the bistability phenotype driven by the Trim28D9 allele, this proved not to be the case. Although Trp53R270H/+;Trim28+/D9 double mutants exhibited increased variation in weight, the developmental bifurcation was blurred. These data suggest that Trp53R270H/+ counteracts the ability of Trim28+/D9 to canalize the developmental trajectories. Without confident bistability, there is no confident statistical means to separate reproducible developmental bifurcation from other roots of interindividual variation (for example, maternal–fetal interface, in utero position or litter size). p53 has important roles in obesity, metabolism and adipose tissue biology54, and our data are consistent with double mutants exhibiting a combination of Trim28+/D9-dependent (bifurcation) and Trp53R270H/+-related obesity effects. Because TRIM28 has been shown to ubiquitinate p53 for degradation, haploinsufficiency in Trim28 should increase the expression of p53 target genes and thus enhance DNA damage responses and counteract tumorigenesis55. Future studies disentangling the reciprocal interaction between TRIM28 and p53 should therefore provide insight into the developmental modulation of tumorigenesis.
Finally, our data show epigenetic differences between cancer susceptibility morphs at the tenth postnatal day. Other open questions therefore are when (and where) precisely the epigenetic bifurcation takes place and whether any cell-intrinsic or -extrinsic factors might skew development toward one or the other state. The observed increased cancer incidence in male compared to female animals is interesting and mirrors human epidemiological data. The latter has been suggested to result from sex-specific differences in genetic alterations, sex chromosome-encoded genes (including epigenetic players), the immune system, hormones and metabolites56. Our data suggest that differences in developmental priming could also be involved. Indeed, Trim28 loss was previously associated with sex-specific defects in embryonic epigenetic reprogramming57, a process that appears to retain sex-specific features even in vitro58. It is tempting to speculate that the sex-specific differences in cancer incidence observed here are due to TRIM28-mediated sex-specific developmental epigenetic effects. Our finding that TRIM28-dependent DML are enriched for a subset of human oncogenes suggests that these are embedded in a unique, more ‘permissive’ silenced state in development and hints toward a possible generalization of the model. If we (as a community) can identify similarly sensitive regions of the human cancer genome, then we will be better equipped to optimally stratify and treat patients.
Methods
Origin and maintenance of mice
This research complies with ethical regulations, with protocols approved by the Institutional Animal Care and Use Committee (Van Andel Institute (VAI); protocols 19-0026, 22-09-036, 18-10-028 and 21-08-023).
FVB/NJ.Trim28+/MommeD9 (Trim28+/D9) mice were originally generated in the Whitelaw laboratory26, and B6.129S4-Trp53tm3.1Tyj/J (Trp53+/R270H) mice were generated in the Jacks laboratory28 and purchased from Jackson Laboratories (stock 008182). Both lines were backcrossed for over ten generations (FVB/NJ and C57Bl/6J, respectively) and maintained in house by breeding with wild-type siblings and periodic background refreshment using WT from JAX. Approximately 349 F1 hybrids were generated by crossing an 8-week-old FVB.Trim28+/D9 male with two 8-week-old B6.Trp53R270H/+ females, which were separated after checking for plugs the next morning. Mating mice were randomly selected. All mice were fed breeder chow (LabDiet, 5021, 0006540) ad libitum and housed in individually ventilated cages (Tecniplast, Sealsafe Plus GM500 in DGM Racks) at a maximum density of five mice per cage. Each cage was enriched with Enviro-dri (the Andersons, Crink-l’Nest) and cardboard dome homes (Shepherd, Shepherd Shack Dome). Whenever possible, same-sex siblings and same-sex animals from different litters were combined (~20 days of age) to co-house isogenic animals. Animals were kept on a 12-h light–dark cycle at an average ambient temperature of 23 °C and 35% humidity.
A total of 270 mice were randomly selected for body composition data analysis, including 137 males (18 WT, 34 Trim28+/D9, 44 Trp53+/R270H and 41 Trp53R270H/+;Trim28+/D9) and 133 females (30 WT, 32 Trim28+/D9, 36 Trp53+/R270H and 35 Trp53R270H/+;Trim28+/D9). At 4, 8, 16, 32, 40, 50, 60 and 70 weeks of age (or at euthanasia), mice were weighed and scanned with the EchoMRI system for fat and lean mass composition in the morning (EchoMRI, EchoMRI-100H).
Tumor analysis was conducted on 114 mice: 60 males (6 WT, 15 Trim28+/D9, 17 Trp53+/R270H and 22 Trp53R270H/+;Trim28+/D9) and 54 females (8 WT, 8 Trim28+/D9, 21 Trp53+/R270H and 17 Trp53R270H/+;Trim28+/D9). We performed tumor analysis blinded for genotype and phenotype, temporally collecting mice according to the timing of health reports. We specify in the text every time we are only referring to one of the sexes.
The VAI Vivarium Core officially requested a reduction of mouse cages to decrease staff in the building during the COVID-19 pandemic. As a result, we reduced active experimental mouse cages due to the extensive mouse number of our experimental cohort. Those mice are appropriately statistically censored in our data.
Mice are checked daily by animal keepers and two to three times per week by expert VAI Vivarium Core Staff for health, well-being and mass or tumor presence. Mice were flagged in health check reports if they exhibited >20% weight loss, tumors ~15% of body weight as assessed by palpation (this maximal tumor size was never exceeded), tumor ulcerations, tumor discharge or hemorrhage, mobility issues, reduced appetite or hydration, limited defecation or urination, abnormal gait or posture, labored breathing, lack of movement or hypothermia. Mice with reported health concerns or those reaching the 70-week study endpoint were euthanized via CO2 asphyxiation and cervical dislocation.
Mice used for different analysis are reported in Supplementary Table 1. The complete data of the mouse cohort are reported in Supplementary Table 2.
Genotyping
Ear punch biopsies were collected at 10 days and digested in 20 µl genomic DNA lysis buffer (100 mM Tris-HCl, pH 8.5, 5 mM EDTA, 0.2% SDS, 100 mM NaCl) with 20 mg proteinase K (Thermo Scientific, EO0491). The thermal cycling protocol used was 55 °C for 16 h, 95 °C for 10 min and a hold at 4 °C (lid at 105 °C). Nuclease-free water (Invitrogen, AM9938) was added to each lysate for a final volume of 180 µl. PCR reactions for Trim28 and Trp53 alleles used 1 µl diluted biopsy lysate in a 19-µl master mix (1× DreamTaq Buffer, 0.2 mM dNTPs, 0.1 µM forward and reverse primer mix, 2 U DreamTaq DNA Polymerase in nuclease-free water; Thermo Scientific, EP0703). PCR primers and thermal cycling conditions are detailed in Supplementary Tables 3 and 4. Each PCR product (20 µl) was digested with either 0.5 µl XceI and NspI (for Trim28+/D9; Thermo Scientific, FD1474) or 0.5 µl MslI (for Trp53R270H/+; New England Biolabs, R0571L) in a final reaction volume of 30 µl. Restriction conditions are detailed in Supplementary Table 5. Digestion products (~700 bp, WT Trim28; ~250 bp + ~450 bp, Trim28+/D9; ~500 bp, WT Trp53; ~200 bp + ~300 bp, Trp53R270H/+) were visualized on a 3% agarose gel (Fisher Scientific, BP160-500) in 1× TAE, with GelRed as the intercalating dye (Biotium, 41003).
Statistical analyses of developmental heterogeneity
Levene’s test was used to assess homoscedasticity of body, fat or lean mass across genotypes, with P values adjusted by the Benjamini–Hochberg method. mclust (version 5.4.9)59 was used for iterative expectation–maximization maximum-likelihood estimation in parameterized Gaussian mixture models, with regularization to smooth BIC. Classification uncertainty was used as the graphical parameter for fat–lean mass plots and for weighing log-rank P values in mouse Kaplan–Meier plots. Because most mice were classified with high confidence, the effect of this correction is negligible. Rmixmod (version 2.1.8)60 validated mclust results via unsupervised classification and density estimation using BIC, ICL and NEC. Both methods clustered 16-week fat and lean mass data by genotype. For tests requiring it, normality and equal variances were formally tested. Data analysis was not blinded. The VAI Bioinformatics and Biostatistics Core applied generalized additive models (GAMs, version 1.22.2) to model fat and lean mass changes over time, using random-effect splines for individual slopes and intercepts. The ‘emmeans’ package (version 1.10.0)61 compared overall group fat–lean mass slope differences by group, while a separate GAM modeled fat–lean mass differences at each time point. We included a random-effect spline for each mouse but excluded the spine for a random slope by week. Cancer death proportions were analyzed with similar models, with P values adjusted by the Benjamini–Hochberg method.
Tissue collection
Tissues were dissected and fixed in 10% NBF solution (3.7–4% formaldehyde (37–40%), 0.03 M NaH2PO4, 0.05 M Na2HPO4 in distilled water with a final pH of 7.2 ± 0.5): epididymal white adipose tissue; uterus or preputial glands, seminal vesicles and testis; bladder; pancreas; spleen; intestine; stomach; mesenteric fat; liver; kidneys; heart; lungs; thymus; brain; breast (ninth); hindlimb muscles and bones. We also recovered spine, ribs, skull, skin and any other abnormal mass. The fixative volume was 15–20 times the tissue volume. Specimens >2.5 mm thick were cut to proper fixation. Most tissues were fixed for 40 h, while fat-rich tissues (epididymal white adipose tissue, mesenteric fat, uterus) were fixed for 72 h. Bones and spines were fixed for 1 week followed by 1 week of decalcification in 14% EDTA (14% free-acid EDTA at pH 7.2, adjusted with NH4OH). After incubation, all tissues were transferred to 70% ethanol. Data collection was performed blinded.
Tissue preparation for histology
All tissues were embedded in paraffin by the VAI Pathology and Biorepository Core. Dehydration and clearing were automated with a Tissue-Tek VIP 5 instrument (Sakura) using the following protocol: 60 min in 70% ethanol, 60 min in 80% ethanol, 2× 60 min in 95% ethanol, 3× 60 min in 100% ethanol, 2× 30 min in xylene and 75 min in paraffin. Embedding was performed with a Leica EG1150 system. Three 5-µm sections, spaced 150 µm apart, were cut from each tissue for hematoxylin and eosin (H&E) staining using a Leica rotary microtome. The remaining tissue was stored as a paraffin block. H&E staining was performed with a Tissue-Tek Prisma Plus Automated Slide Stainer (Sakura) and Prisma H&E Staining Kit 1.
Pathology evaluation
Standard 5-µm H&E-stained sections were assessed for tumors and dysplastic lesions by a board-certified pathologist at the VAI Pathology and Biorepository Core. Most samples were provided blindly. Tumors were classified as malignant or benign, with all malignant tumors being primary. Metastatic or secondary tumors were identified based on primary tumor characteristics and immunohistochemical validation but were not reported in this study. Tumors were categorized into carcinomas, germ cell tumors, leukemias, lymphomas and sarcomas, with detailed classification by tissue of origin.
Tissue preparation for DNA and RNA extraction
Samples were randomly selected based on tumor type, genotype and phenotype. Curls from formalin-fixed, paraffin-embedded (FFPE) healthy tissues were prepared by the VAI Pathology and Biorepository Core, cutting three 50-µm curls using a microtome for storage at −80 °C. A 5-µm section was also cut for H&E staining to confirm the absence of tumors.
For tumor-containing FFPE tissues, microdissection or macrodissection was performed to separate the tumor from adjacent healthy tissue. All instrumentation and tools were treated with RNaseZAP (Invitrogen, AM9782) for decontamination, and RNase-free water was used in the tissue floating bath (Growcells.com, UPW-2000). Laser capture microdissection (LMD) was performed with the Leica LMD 6500 system. Glass slides (Leica, 11505189) were treated with UV light (Instrumedics UV curing lamp) for 30 min to prevent static and promote adherence. Mounted sections were cut at 10 µm and dried in an oven at 60 °C for 20 min. Slides were deparaffinized with three changes of xylene for 20 min followed by one change of 100% ethanol for 20 min. All slides were dissected within 24 h of sectioning. LMD-dissected areas were stored at −80 °C until further processing. Macrodissection of FFPE tissue sections was performed manually using a razor. The mounted sections were cut at 10 µm and dried in an oven at 60 °C for 20 min. All slides were dissected within 24 h of sectioning. Dissected areas were stored at −80 °C until further processing.
DNA extraction
Ear punch biopsies were collected and randomly selected based on tumor type, genotype and phenotype. DNA was purified using a DNeasy Blood & Tissue Kit (Qiagen, 69504) with minor modifications. After digestion, samples were brought to 220 µl with 1× PBS, and then steps 2–7 of the Quick-Start Protocol were followed. DNA was eluted with two washes of 100 µl buffer AE. For samples requiring both RNA and DNA, the Quick-DNA/RNA Microprep kit (Zymo, D7005) was used, following its specific protocol.
DNA from FFPE healthy and tumor tissues was extracted with the Quick-DNA/RNA FFPE kit (Zymo, R1009), with slight modifications based on tissue source. Curls and macrodissected tissues were deparaffinized in 800 µl Deparaffinization Solution at 55 °C for 5 min and then digested at 55 °C for 4 h. Microdissected tissues, previously deparaffinized, were digested at 55 °C for 1 h. Subsequent protocol steps were followed according to the kit manual, with an additional centrifugation step to remove residual ethanol before elution, which used 30 µl for macrodissected and microdissected tissues and 50 µl for curls, respectively. Purified DNA was quantified by Qubit fluorometry (Life Technologies).
Mouse DNA methylation array
DNA samples (6–500 ng) were bisulfite converted using the Zymo EZ DNA Methylation Kit (Zymo Research) following the manufacturer’s protocol with modifications for the Illumina Infinium methylation assays. After conversion, reactions were cleaned with Zymo-Spin columns and eluted in 12 µl Tris buffer. The bisulfite-converted DNA was processed using the Illumina mouse methylation array protocol. For the assay, 7 µl of converted DNA was denatured with 4 µl 0.1 M NaOH. The DNA was then amplified and hybridized to the Infinium BeadChip31 and underwent an extension reaction with fluorophore-labeled nucleotides according to the protocol. Arrays were scanned on the Illumina iScan platform, and probe-specific calls were made using Illumina GenomeStudio version 2011.1 to generate IDAT files. Data collection and analysis were conducted blind to experimental conditions.
DNA methylation analysis
Analysis of IDAT files was performed using the SeSAMe pipeline (version 1.22.2)62 and its wrapper SeSAMeStr (version 0.1.0)63. Fifty-eight independent biological replicates from ear biopsies of wild-type, Trim28+/D9, Trp53R270H/+ and Trp53R270H/+;Trim28+/D9 male mice at day 10 were analyzed. A second cohort of 22 samples from wild-type and Trim28+/D9 male mice was also analyzed independently. Additionally, 46 samples from intestines, lungs, stomachs and pancreata of Trim28+/D9 males were analyzed, comparing light and heavy mice. Data preprocessing and quality controls followed SeSAMe’s default parameters and the preprocessing code ‘TQCDPB’, with all samples showing a detection rate >90% and no dye bias. In differential DNA methylation analyses between genotypes, the effect size cutoff was set to 0.1 (10% differential DNA methylation) with a P-value cutoff of <0.05, unless specified otherwise. For analyses between isogenic Trim28+/D9-heavy and Trim28+/D9-light mice, the effect size cutoff was 0.05 (5% differential DNA methylation), with the same P-value threshold. Batch effect was included as a covariate, while other technical and biological effects (detection rate, initial DNA concentration, litter) were evaluated but not included due to co-linearity with the batch effect. Global DNA methylation correlation was assessed using the ‘chart.Correlation’ function from the ‘PerformanceAnalytics’ R package (version 2.0.4). Similarity between samples was calculated as the sum of squared residuals from linear regressions. Principal-component analysis of β values was performed on SeSAMeStr pipeline output using the R function ‘prcomp’ from the ‘stats’ package (version 3.6.2). Heatmap visualization of DML was created using the R package ‘ComplexHeatmap’ (version 2.20.0)64, with β values modeled and weighted using the mclust certainty score in limma (version 3.60.4)65. Probe enrichment analysis was performed using the SeSAMe knowYourCG module, with annotations based on the knowYourCG tool. Related information is available at http://zwdzwd.github.io/InfiniumAnnotation#mouse. The ChromHMM annotation is derived from a mouse consensus by the ENCODE project profiling 66 mouse epigenomes across 12 tissues at daily intervals from embryonic day 11.5 to birth66. Lists of probe-enriched genes are reported in Supplementary Table 6. Gene ontology analysis of probe-enriched genes was performed using the R package ‘clusterProfiler’ (version 4.12.1)67. Probe enrichment analysis on metabolism-related gene sets was performed by retrieving all gene sets with the term ‘metabolism’ or ‘metabolic’ from the Molecular Signatures Database (MSigDB)68. We analyzed 674 gene sets related to metabolism or metabolic processes from all MSigDB collections. Gene enrichment in the Jensen DISEASES database69 was performed using the R package ‘enrichR’ (version 3.2)70. Further data visualization of SeSAMe and SeSAMeStr output was performed using RStudio. For genomic snapshots of genes enriched for DML between Trim28+/D9-light and Trim28+/D9-heavy mice, we applied RUVSeq (version 1.38.0)71 to remove unwanted variation, defining empirical control probes based on differential analysis between Trim28+/D9-light and Trim28+/D9-heavy mice with limma65. The 100,000 least differentially methylated probes were used in the ‘RUVg’ command from RUVSeq, and RUVSeq-corrected, z-scored β values were plotted. Data analysis was not conducted blind to the experimental conditions.
Whole-exome sequencing
Samples were randomly selected based on tumor type and genotype–phenotype combinations relevant to the biological question. Libraries for whole-exome sequencing (WES) were prepared by the VAI Genomics Core from 100–200 ng of genomic DNA using the Twist Library Preparation EF Kit 2.0 version 5.0 (Twist Bioscience). DNA was enzymatically sheared to an average size of 250 bp, followed by end repair, A tailing and ligation to uniquely barcoded dual indexes (Twist Bioscience). PCR amplification (ten cycles) was performed, and the Twist Mouse Exome Panel was used to capture whole-exome regions before a final PCR round (six cycles). Quality and quantity of the libraries were assessed using the Agilent TapeStation 4200 (Agilent Technologies) and the QuantiFluor dsDNA System (Promega). Sequencing (2 × 100 bp) was performed on an Illumina NovaSeq 6000 sequencer (Illumina) to an average raw depth of 50 million paired reads per library. Base calling was performed with Illumina RTA3 (version 3.4.4), and the output was demultiplexed and converted to FastQ format with Illumina bcl2fastq2 (version 2.20). Data collection and analysis were conducted blind to the experimental conditions.
Whole-exome sequencing analysis
Adaptor sequences and low-quality reads were trimmed using Trim Galore (version 0.6.0; https://github.com/FelixKrueger/TrimGalore)72. Trimmed reads were aligned to the mm10 reference genome with BWA (version 0.7.17)73, and duplicates were marked using SAMBLASTER (version 0.1.26)74. Paired healthy and tumor BAM files were analyzed with GATK Mutect2 (version 4.1.8.1)75 to identity somatic single-nucleotide variants (SNVs), insertions and deletions (indels). BCFtools (version 1.17)76 was used to extract SNVs and indels based on the gene annotation file provided by Twist Bioscience. SnpEff (version 5.1)77 was used to predict the effect of each SNV and indel. Data visualization was performed using the ComplexHeatmap R package (version 2.20.0)64. Data collection and analysis were not conducted blind to the experimental conditions.
RNA extraction
Fresh ear punch biopsies were collected and in part randomly selected based on tumor type and genotype–phenotype combination, without using the genotyping buffer. Rather, RNA was extracted using the Quick-DNA/RNA Microprep Plus kit (Zymo, D7005), which includes in-column DNase I treatment. For FFPE tissues, the Quick-DNA/RNA FFPE kit (Zymo, R1009) was used with minor modifications based on the tissue type. Curls and macrodissected tissues were deparaffinized in 800 µl Deparaffinization Solution at 55 °C for 5 min, followed by digestion at 55 °C for 4 h. Already deparaffinized microdissected tissues were immediately digested for 1 h. The remaining steps were followed according to the kit manual, including except for an additional centrifugation step with the empty column before elution to remove residual ethanol. RNA was eluted with 50 µl of DNase- and RNase-free water for curls and 30 µl of DNase- and RNase-free water for macrodissected and microdissected tissues. Purified RNA was quantified by Qubit fluorometry (Life Technologies).
RNA sequencing
Libraries were prepared by the VAI Genomics Core from 142 ng of total RNA using the KAPA RNA HyperPrep Kit (Kapa Biosystems). Ribosomal RNA levels were reduced with the QIAseq FastSelect −rRNA HMR Kit (Qiagen). RNA was sheared to 300–400 bp, and cDNA fragments were ligated to IDT for Illumina TruSeq UD indexed adaptors (Illumina) before PCR amplification. Library quality and quantity were assessed using the Agilent TapeStation 4200 (Agilent Technologies) and the QuantiFluor dsDNA System (Promega). Individually indexed libraries were pooled, and 2 × 100-bp sequencing was performed on an Illumina NovaSeq 6000 sequencer to an average depth of 50 million raw paired reads per transcriptome. Base calling was performed with Illumina RTA3 (version 3.4.4), and outputs were demultiplexed and converted to FastQ format with Illumina bcl2fastq2 (version 2.20). Data collection and analysis were performed blind to the experimental conditions.
RNA-sequencing analysis
All reads from FastQ files underwent quality control, adaptor trimming, mapping and counting using the mRNA-seq pipeline of snakePipes (version 2.7.3)78. Mapping was performed with STAR (version 2.7.10b) on the GRCm38/mm10 mouse genome, and reads were counted with featureCounts (version 2.0.1). The resulting raw count matrices were input into DESeq2 (version 1.44.0)79, accounting for technical (RIN, library preparation and sequencing batches, initial RNA concentration) and biological (litter, age) covariates. Variance-stabilizing transformation was applied and was used for downstream analyses and data visualization. Dimensional reduction analysis was performed using the Rtsne (version 0.17, t-SNE, https://github.com/jkrijthe/Rtsne) and uwot (version 0.2.2, UMAP, https://CRAN.R-project.org/package=uwot) R packages. Heatmap visualization was performed using the ComplexHeatmap R package (version 2.20.0)64. Data analysis was not performed blind to the experimental conditions.
Immunofluorescence staining
Samples were randomly selected based on tumor type, genotype and phenotype. Paraffin sections (5 µm) were deparaffinized and subjected to antigen retrieval using DAKO EnVision FLEX High pH antigen retrieval buffer for 20 min at 97 °C by the VAI Pathology and Biorepository Core. Slides were blocked with 2% FBS for 1 h and then incubated overnight at 4 °C with anti-TRIM28 (Thermo Fisher, MA5-35303, clone ARC0047) antibody diluted 1:50 in DAKO EnVision FLEX antibody diluent. After washing 3× with 1× PBS for 5 min, slides were stained with Rb-647 secondary antibody (Invitrogen, A32733) at 1:500 for 2 h at room temperature, followed by three washes with 1× PBS for 5 min each. DAPI (Invitrogen, D21490) was applied for 10 min at room temperature, and slides were washed 3× in DI water for 5 min each before coverslipping with Prolong Gold mounting medium (Invitrogen, P36930).
Immunofluorescence acquisition
Whole-tissue images were collected in a single plane on a Zeiss Axioscan 7 slide scanner using ZEN blue (version 3.7) by the VAI Imaging Core. DAPI and AF647-stained samples were excited by a Colibri 7 LED light source at 385 nm and 630 nm. Emission was detected with a Hamamatsu ORCA-Flash 4.0 camera and a Zeiss Plan-Apochromat ×20, 0.8-NA air objective. Resulting 14-bit images, scaled to 0.1725 × 0.1725 µm per pixel, were compressed by JpgXr at 85%. Data collection and analysis were conducted blind to the experimental conditions.
Immunofluorescence analysis
Full-resolution pyramidal CZI images of TRIM28-stained tissue sections were analyzed using QuPath80 (version 0.5.1) by the VAI Imaging Core. Annotations were made to contour target tissue while excluding bubbles, large folds, nontarget tissues and bright autofluorescence caused by debris. Nuclei were detected using the QuPath StarDist (version 0.4.4) plugin via dsb2018_heavy_augment.pb (https://qupath.readthedocs.io/en/0.4/docs/deep/stardist.html). QuPath’s Train Object Classifier was trained on ROIs selected from two samples of each tissue type and their batch-paired positive controls to classify nuclei as positive or negative for TRIM28. The classifier was trained using the random tree model and applied across images. Key measurements (for example, number of detections, percent positive and fluorescence) were exported for statistical analysis, with single-nuclear signals averaged per biological replicate. At least three independent biological replicates per group (totaling 22,964,279 nuclei) were analyzed. TRIM28 nuclear fluorescence was corrected for known technical and biological confounders (antibody lot, litter, cause of death, age at death and tumor type) using correctBatchEffects from the R package ‘limma’ (ref. 65). Data collection and analysis were performed blind to the experimental conditions.
cBioPortal and TCGA Pan-Cancer Atlas data analyses
The TCGA Pan-Cancer Atlas39, comprising 32 studies and 10,967 samples, was used for preliminary analyses in cBioPortal81. Outputs were revisualized in RStudio. Kaplan–Meier curves were generated for samples harboring mutations in either the TRIM28+/D9-heavy or TRIM28+/D9-light gene signatures, compared to those without mutations, unless otherwise noted. Statistical significance was tested using log-rank tests (P < 0.05). Co-occurrence or exclusivity of pairwise mutations within these gene signatures was tested by one-sided Fisher’s exact test, with Benjamini–Hochberg Padj < 0.05. Overlap with the COSMIC Cancer Gene Census38 was similarly tested. The effects of mutations in TRIM28+/D9-light signature genes were assessed across samples from TCGA and non-overlapping samples from cBioPortal (n = 69,223 samples), with sex-specific analyses performed on 30,203 samples from 28,966 female patients and 34,276 samples from 32,192 male patients. Mutations were categorized as ‘harmful’ or ‘protective’ based on median survival ratios (months) between altered and unaltered samples (>1, ‘harmful’; <1, ‘protective’). To address sample bias, tissues were divided into low (<3,000) and high (>3,000) sample groups for heatmap visualization. The analysis was performed both on overall survival and disease-free survival. Gene expression and DNA methylation analyses of the TRIM28+/D9-light signature were performed on the Pan-Cancer Atlas from TCGA samples for which both RNA-seq and DNA methylation (HM27 and HM450 arrays) data were available, comprising 10,013 samples from 10,005 patients (of a total of 10,967 samples from 10,953 patients present in the Atlas) and 33 cancer types. DNA methylation analysis focused on probes within ±50 bp of TSS regions. Linear correlations between mRNA expression, DNA methylation and survival were visualized as heatmaps, with P < 0.05 for RNA-seq and 0.01 for DNA methylation. Data collection and analysis were not conducted blind to the experimental conditions.
Statistics and reproducibility
Power analysis was performed by the VAI Bioinformatics and Biostatistics Core using the pwr R package for power analysis (R version 3.5.2)82 to determine sample size. The goal was to assess cancer incidence differences (carcinoma, sarcoma, lymphoma and leukemia) between Trim28+/D9-light and Trim28+/D9-heavy mice. A two-sample test of proportions was performed using Firth logistic regression, with power set to 80%, α = 0.05 and equal sample sizes assumed for each group.
Owing to COVID-related reductions, 118 mice were randomly excluded for tumor analysis. Additionally, 17 mice were excluded because they were found dead and too stiff to harvest. The final cohort included all animals from litters of 4–12 pups.
Experiments were randomized, and investigators were blinded to group allocation and outcome assessment whenever possible.
Reporting summary
Further information on research design is available in the Nature Portfolio Reporting Summary linked to this article.
Responses