Perovskite-driven solar C2 hydrocarbon synthesis from CO2
Main
C2 hydrocarbons such as ethane and ethylene are major industrial feedstocks for plastics synthesis, with ethylene production exceeding that of any other organic chemical1. However, they are exclusively sourced or produced from fossil resources including natural gas or naphtha1. Photoelectrochemistry (PEC) presents a sustainable alternative towards direct C2 hydrocarbon production from small building blocks such as CO2 or H2O. These light-driven systems can reduce costs by integrating light harvesting and catalysis into a single panel that operates under benign conditions2,3, as well as mitigating the intermediate steps and CO2 emissions from industrial processes (Supplementary Note 1)1,4.
Despite substantial progress on the electrochemical CO2 reduction reaction (CO2RR) in gas flow cells5,6,7, examples of PEC C2 hydrocarbon synthesis remain sparse8,9. This can be traced back to a limited choice of catalysts for C2 product formation (only copper-based compounds)10,11, high overpotentials of 0.5–0.8 V for electrochemical hydrocarbon synthesis12,13, and photovoltages below 0.7 V of established semiconductors including Si (ref. 14), III–V compounds15 or oxides16,17,18. As a result, unassisted hydrocarbon synthesis is demonstrated only as trace amounts in PEC tandem devices reaching partial photocurrent densities below 20 µA cm−2 for C2+ alcohols19. One emerging approach to reduce the required photovoltage is by replacing the thermodynamically demanding O2 evolution reaction (OER) by more facile organic oxidations. For instance, the glycerol oxidation reaction (GOR) can alleviate the photovoltage requirement by 1 V, while converting a biomass-derived waste product into value-added chemicals for the pharmaceutical, food and cosmetic industries20,21.
Here we demonstrate C2 hydrocarbon formation by interfacing low-overpotential Cu electrocatalysts with perovskite light absorbers with 1 V photovoltage. These buried-junction photocathodes reveal an interplay between electron flux, applied potential and C2 selectivity, which manifests when assembling unassisted PEC devices. Accordingly, tandem devices with robust BiVO4 and TiO2 photoanodes couple aqueous ethane and ethylene production with O2 evolution. The C2 partial current densities are improved 200-fold by wiring the perovskite photocathodes to Si photoanodes for GOR, providing a proof-of-concept demonstration for simultaneous PEC hydrocarbon and organic synthesis.
Results
Cu nanoflower electrochemistry
A copper nanoflower (CuNF) electrocatalyst was optimized for CO2 reduction based on its promising activity towards ethylene synthesis22,23 and its compatibility with our overall system design (see Supplementary Fig. 1 for the results of our initial catalyst screening). The catalyst was obtained by surface oxidation of Cu foil in an alkaline ammonium persulfate solution. This resulted in the growth of CuO nanoflowers, which were subsequently electroreduced to metallic CuNF (Methods). The catalyst consisted of 2–4-µm-wide clusters, which preserved the 50-nm-thin nanoplatelet structure of CuO (Fig. 1 and Supplementary Figs. 2 and 3). Such hierarchical, porous structures are known to promote CO2 reduction by increasing the local pH and, hence, reducing the availability of protons for the competing H2 evolution24,25.
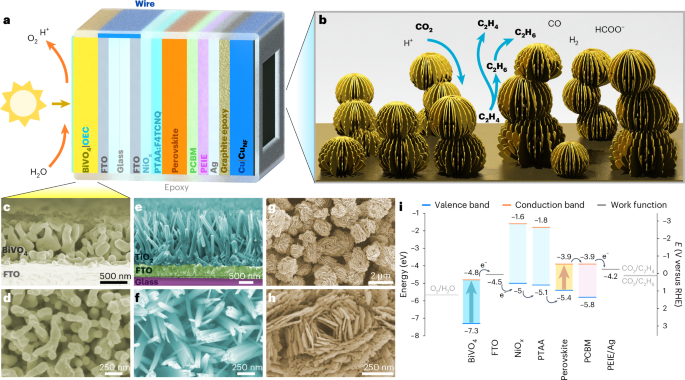
a, Architecture of the tandem PEC device. b, A schematic illustration of the nanoporous electrode. c–h, False-colour SEM images of BiVO4 (c and d), TiO2 (e and f) and CuNF (g and h). c,e, Cross-section images. d,f–h, Top views at different magnifications. The SEM images reveal a hierarchical catalyst nanostructure. i, Energy levels within a perovskite–BiVO4 tandem device.
Although previous studies considered only CO electroreduction under strongly basic pH (refs. 22,23), CO2 conversion photoelectrodes often operate under benign conditions. Hence, the catalytic activity of CuNF was first screened in an aqueous 0.1 M KHCO3 solution, under constant CO2 flow (Fig. 2, Supplementary Fig. 4 and Supplementary Table 1). Traces of ethane and ethylene could be observed already at −0.5 V versus reversible hydrogen electrode (RHE) (Faradaic yield (FY) <1%), which makes the catalyst compatible with state-of-the-art tandem PEC devices for unassisted CO2 conversion26,27. The C2 FY increased steadily at more negative applied potentials, plateauing around 10% below −0.9 V versus RHE. While most electrocatalytic studies target specifically C2H4 and C2H5OH, the formation of C2H6 has also been reported for oxide-derived Cu catalysts28, whereas the FY of C2H6 increases with the thickness of the catalyst layer10. Accordingly, it has been hypothesized that a thick, dense catalyst nanostructure like that of CuNF favours C2H6 production, which is probably caused by the readsorption and further reduction of C2H4 (Fig. 1b)10,29,30. Alternatively, *CH3 dimerization or ethoxy intermediates may also contribute to C2H6 formation31.
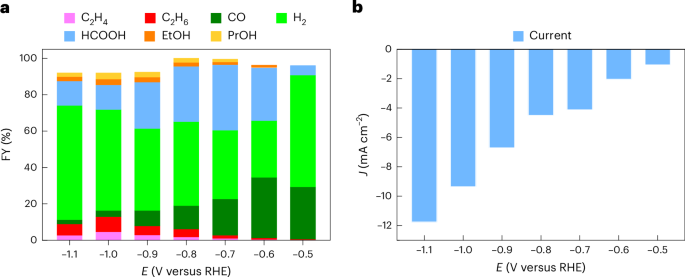
a, FYs. b, Current densities. Two-hour CPE is conducted in a stirred 0.1 M KHCO3 electrolyte (pH 6.8), under 5 sccm CO2 flow, at room temperature.
CO constituted the major gaseous CO2 reduction product at −0.5 V versus RHE (29% FY), whereas its proportion decreased substantially (FY <5%) at negative potentials favouring C2 formation. This behaviour is also consistent with literature, as the more facile CO and formate production occurs at lower overpotentials of 0.1–0.3 V (refs. 10,13). The H2 FY amounted to 30–60% depending on the applied potential. Similar trends in the FYs of gas products were observed under stepwise change of the applied potential (Supplementary Fig. 5 and Supplementary Table 2). The remaining FY can be traced back to liquid products such as formate (up to 36% FY) and small amounts of alcohols (3–7% FY) as determined from nuclear magnetic resonance (NMR)32, whereas gas leakage from the PEC cell accounts for small deviations from the ideal 100% (Supplementary Figs. 4 and 6, and Supplementary Tables 1 and 3).
While Cu nanoparticle catalysts undergo structural transformations under negative applied potential12,33,34, our data indicated that the nanoflower catalyst is robust to surface reoxidation under open-circuit conditions or positive potentials (postcatalysis scanning electron microscopy (SEM) characterization is shown in Supplementary Fig. 2g–i). This was further supported by a long-term stability test of a CuNF electrode, which revealed no substantial change in selectivity or morphology over three 12 h cycles (Supplementary Figs. 2j–l and 23). This resilience to structural changes is desirable in real-world PEC systems under intermittent light irradiation27,35. Accordingly, CuO samples reduced either in advance, under subsequent cyclic voltammetry (CV) scans or under continuous controlled potential electrolysis (CPE) displayed a similar electrocatalytic behaviour within experimental error (Supplementary Fig. 5). This is consistent with X-ray diffraction (XRD) and X-ray photoelectron spectroscopy data, which indicated the presence of a surface oxide layer for both pristine CuO and Cu nanoflower electrodes ex situ (Supplementary Figs. 7 and 8).
Perovskite|CuNF photocathodes
The Cu nanoflower catalyst was next interfaced to perovskite PV devices via graphite epoxy paste27 to form buried-junction photocathodes (abbreviated PVK|CuNF). The exposed edges and wiring were sealed by epoxy26, which was also used to define the catalyst active area (Methods). PV devices with photoactive areas of ~25 mm2 used a triple-cation mixed-halide perovskite light absorber that was sandwiched between hole and electron selective layers for effective charge separation (Fig. 1 and Supplementary Fig. 9). Those devices provided a high average open-circuit voltage (VOC) of 1.08 ± 0.03 V, which is necessary to bias the Cu electrode for C2 hydrocarbon formation (current–voltage (J–V) curves and histograms are shown in Supplementary Figs. 10 and 11). Accordingly, the photocathode performance was evaluated by CPE at 0 V versus RHE, which resembles the −0.9 V versus RHE potential applied during Cu electrocatalysis (Supplementary Fig. 12).
A strong dependence was observed in the C2 selectivity of the integrated photocathodes with the exposed geometric area of the catalyst (Fig. 3, Supplementary Figs. 13 and 43, Supplementary Table 5 and Supplementary Note 2). Accordingly, the optimal selectivity towards ethane and ethylene production was obtained for a catalyst active area of ~4 mm2, where the C2 hydrocarbon FY amounted to 9.8% as expected from electrocatalysis. This smaller CuNF area may present practical benefits, as described in Supplementary Fig. 14. However, the C2 hydrocarbon FY decreased steeply to 0.8% for a catalyst geometric area of 40 mm2. This finding indicates that the current density influences selectivity, as noted in recent studies13,26,27,36. To rationalize this finding, CPE and CV scans were conducted for PVK|CuNF photocathodes and corresponding CuNF electrodes with varying catalyst geometric areas (Fig. 3, Supplementary Figs. 13 and 15–17 and Supplementary Tables 4 and 5). As expected, C2 FYs remained similar across CuNF electrodes of different sizes. Meanwhile, CV scans indicated that an optimal selectivity is obtained when the absolute photocathode current (I) matches the one from electrochemistry (Fig. 3a). In other words, the photocurrent density through the catalyst (Jcat) needs to match the current density for CuNF electrodes of equivalent area (JCu) (Supplementary Figs. 15 and 17).
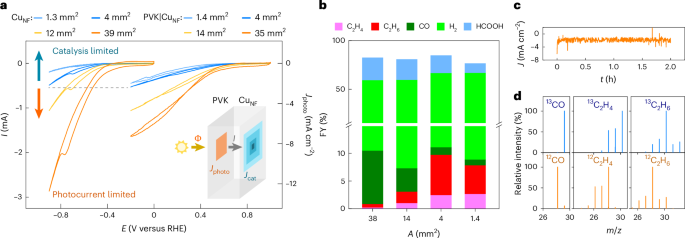
a, CV traces of CuNF electrodes of different sizes (left) and perovskite photocathodes with corresponding catalyst areas (right). The absolute photocurrent (I) is limited by either CuNF electrocatalysis or perovskite light absorption. The inset illustrates the different photocurrent densities experienced by the light absorber (Jphoto) and catalyst (Jcat), based on their respective areas. Φ represents the photon flux, which is ideally proportional to the perovskite photocurrent. b, FYs of the photocathodes, as a function of the catalyst geometric area. The optimal ethane and ethylene production is achieved when the absolute photocurrent matches that of CuNF electrodes. c, CPE trace of the optimized perovskite photocathode with a 4 mm2 CuNF area. d, GC–MS isotopic labelling confirms that gaseous products originate from CO2 reduction (residual N2 and O2 peaks are removed for clarity). Two-hour CPE is performed at 0 V versus RHE in a stirred 0.1 M KHCO3 electrolyte (pH 6.8), under simulated 1 sun irradiation (AM1.5 G, 100 mW cm−2), at room temperature.
This current matching requirement defines two distinct regions within the CV plot (Fig. 3a). When the catalyst area is too small, the total photocurrent (I) is limited by catalysis. This means that the light absorber must force charges through a smaller catalyst area, resulting in relatively higher current densities (Jcat > JCu) (Supplementary Figs. 15c–e and 17b). However, when the catalyst surface area is too large, the current becomes limited by the charge generation through the light absorber. This perovskite photocurrent plateaus following the typical shape of a J–V curve37,38, resulting in Jcat < JCu. This presents an unusual handle to fine-tune PEC product selectivity, which is often neglected when assembling such integrated or buried-junction photoelectrodes.
In terms of product distribution, the selectivity resembled the findings from electrochemistry, with formate amounting to 20–30% FY, and other C2+ liquid products (for example, ethanol) amounting to <10% FY over 2 h CPE at 0 V versus RHE (Supplementary Fig. 6). Photocathodes tested under different applied potentials also followed similar trends in the FY of C2 hydrocarbon products as the dark CuNF electrodes (Figs. 2 and 4, Supplementary Fig. 18 and Supplementary Table 6). Lower C2 FYs were attained during CPE in a more concentrated, 0.5 M KHCO3 electrolyte solution. Its buffering effect may prevent a higher local pH build-up, which is expected to favour C2 formation (Supplementary Fig. 19 and Supplementary Table 5)10,39.
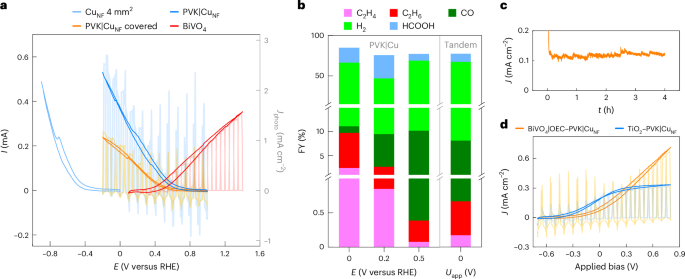
a, CV traces of a CuNF electrode, PVK|CuNF photocathodes and a BiVO4 photoanode. The perovskite photovoltage shifts the CV of the current-matched photocathode by 1 V over the corresponding dark electrode. A ~50% reduction in photocurrent is observed when placing the photocathode behind BiVO4, in a back-to-back tandem PEC configuration. The sign of the cathodic traces is reversed to emphasize the current overlap. b, FYs of a BiVO4|OEC–PVK|CuNF tandem device at 0 V applied bias voltage (Uapp) are compared with those of PVK|CuNF photocathodes under different applied potentials. Axis breaks are used to visualize the FYs of C2 products. c, The corresponding CPE of the perovskite–BiVO4 tandem. d, CV traces of perovskite tandems with BiVO4 and TiO2. CPE is performed in a stirred 0.1 M KHCO3 electrolyte (pH 6.8), under 1 sun irradiation (AM1.5 G, 100 mW cm−2), at room temperature. In a and d, lighter shades indicate chopped light CV traces.
13C gas chromatography–mass spectrometry (GC–MS) experiments revealed that all gaseous products originate from CO2 reduction (Fig. 3d and Supplementary Fig. 20). Small quantities of 12C impurities were observed among liquid products (Supplementary Figs. 6 and 21), which probably originate from the epoxy resin used for encapsulation. While formate impurities amount to 5–10% of the total HCOO− amounts, FYs are much more sensitive to small amounts of methanol and propanol (6 e− and 18 e− required for CO2 reduction, respectively). Because all effective moisture encapsulation methods based on epoxy resins resulted in liquid impurities (albeit in different compositions and ratios), we plot only the data for formate as the major liquid product.
Further controls indicated that photocathodes lose most activity within a few hours, with only traces of C2 hydrocarbons noticeable beyond the first 12 h. While the perovskite device sustained a similar photocurrent, catalyst deactivation meant that most charges contribute towards H2 evolution (Supplementary Fig. 22 and Supplementary Table 7). By contrast, a bare CuNF catalyst sustained ethylene production over 36 h (Supplementary Fig. 23). This indicates that carbon impurities from the epoxy resin may deactivate the catalyst surface of the encapsulated photocathodes40, which is consistent with earlier reports of Cu-based, buried-junction photocathodes16.
Artificial leaves for water and CO2 splitting
Optimized perovskite photocathodes with a ~4 mm2 CuNF area were next interfaced to BiVO4 and TiO2 photoanodes for O2 evolution, to assess the activity of tandem artificial leaves towards unassisted C2 hydrocarbon production (Fig. 1a). BiVO4 photoanodes were synthesized by electrodeposition of BiOI on fluorine-doped tin oxide (FTO) glass, followed by annealing in the presence of VO(acac)2 (acac, acetylacetonate), whereas a spin-coated amorphous TiCoOx layer acted as the oxygen evolution catalyst (OEC)27,41. Alternatively, nanowire (NW) TiO2 photoanodes were obtained by hydrothermal synthesis42. SEM and XRD data confirmed the successful fabrication of the desired nanostructured photoanodes (Supplementary Figs. 24 and 25).
CV traces of PVK|CuNF and BiVO4 photoelectrodes overlapped at a potential of ~0.5 V versus RHE, revealing that the system can operate under bias-free conditions. As perovskite devices provide 1 V photovoltage, this working potential corresponds to an applied potential of roughly −0.5 V versus RHE on the CuNF catalyst. Due to the 0.4 V versus RHE onset of BiVO4, the PEC tandem could sustain an unassisted steady-state photocurrent density of only 0.12 mA cm−2. Four-hour CPE of the perovskite–BiVO4 tandem at 0 V applied bias confirmed that the system could indeed produce ethane and ethylene at FYs of 0.49% and 0.18%, respectively (Fig. 4b,c). This result was in line with selectivities obtained from CPE of a PVK|CuNF photocathode at 0.5 V versus RHE, or CuNF electrodes at −0.5 V versus RHE (Figs. 2 and 4, Supplementary Fig. 18 and Supplementary Table 6). A lower selectivity was again obtained over a longer 10 h experiment (Supplementary Fig. 26). No O2 could be detected via GC analysis owing to interference from air leakage and low product rates at absolute photocurrents of ~30 µA (quantitative O2 evolution has been previously confirmed for similar tandem devices26).
NW TiO2 photoanodes were also tested in the tandem artificial leaf configuration. While its wider bandgap limits the overall photocurrent, TiO2 possesses an earlier onset potential of 0.2 V versus RHE for O2 evolution, as well as an improved fill factor. The latter resulted in an increased overlap between the cathodic and anodic CV traces at ~0.45 V versus RHE, which yielded a higher bias-free photocurrent of up to 0.3 mA cm−2 (Fig. 4d and Supplementary Figs. 26–29). Due to the minor shift in the working potential, C2 selectivity remained similar over 10 h CPE at 0 V applied bias (Supplementary Fig. 26 and Supplementary Table 8), while the C2 hydrocarbon amount only increased 1.8-fold over that of a PVK|CuNF–BiVO4 device.
These results demonstrate that tandem PEC devices are in principle compatible with the challenging C2 hydrocarbon synthesis. However, the partial C2 photocurrent density remains below 0.8 µA cm−2, as O2 evolution demands over 1.23 V versus RHE, while substantial ethylene production typically occurs at more negative applied potentials of −0.6 to −1.1 V versus RHE13. Hence, further photovoltage gains, lower catalyst overpotentials and improved selectivities are still needed for practical uses. These may be attained by taking into account the optimal local environment of nanosized Cu catalysts8,12,33,34, or introducing wide-bandgap perovskite43,44 and buried multijunction photocathodes45 with photovoltages >1.5 V. Alternatively, the OER can be replaced by organic oxidations with early onset potentials of ~0.3 V versus RHE20,21, as described next (Supplementary Note 3 and Supplementary Tables 11 and 12).
PEC devices for value-added chemicals
To overcome the thermodynamic limitations of water oxidation, perovskite photocathodes were next wired to Si photoanodes with a 37.8 mm2 active area for GOR (Fig. 5a)20. Both electrodes were irradiated in parallel, with the cathodic and anodic compartments separated by a bipolar membrane. Photocurrent densities (Jphoto,PVK) are reported relative to the perovskite area for consistency. Planar and NW p+n-Si substrates were coated with a 10-nm-thin TiO2 layer to prevent NW degradation in the basic anodic solution. PtAu clusters were co-sputtered onto the compact TiO2 layer, as confirmed by SEM and energy-dispersive X-ray (EDX) spectroscopy mapping (Methods, Fig. 5b–d and Supplementary Figs. 30 and 31). The resulting planar and NW p+n-Si|TiO2|PtAu electrodes are abbreviated Sip and SiNW, respectively.
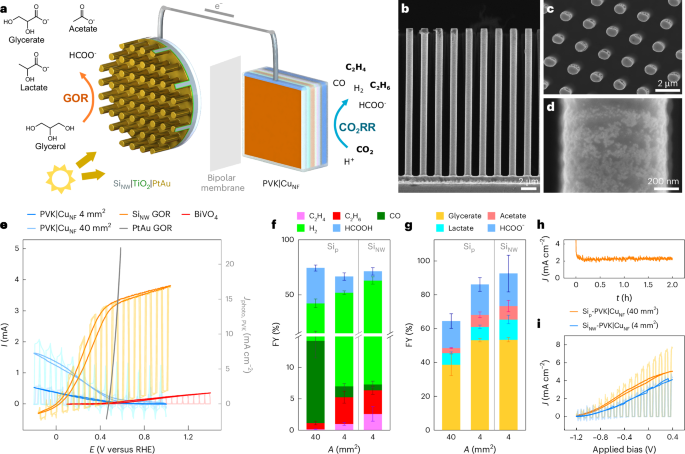
a, A schematic illustration of the PEC device wiring a NW Si photoanode to a PVK|CuNF photocathode. b–d, SEM images of the SiNW array photoanode: cross-section (b), top view of NW array (c) and PtAu GOR catalyst (d). e, CV traces of CO2RR, GOR and OER (photo)electrodes. The sign is reversed for cathodic traces. f,g, FYs of Si-PVK|CuNF PEC devices with different CuNF geometric areas for CO2 reduction (f) and GOR (g). The high photocurrent and early onset potential of the SiNW photoanode shifts the bias-free operating point of PEC devices to 0.1–0.2 V versus RHE. As a result, the C2 hydrocarbon selectivity resembles that of PVK|CuNF electrodes at 0 V versus RHE (Fig. 3b). h, CPE of a SiNW-PVK|CuNF (4 mm2) device. i, CV traces of Si-PVK|CuNF devices with different CuNF areas. Two-hour CPE is performed at 0 V applied bias under 1 sun irradiation (AM1.5 G, 100 mW cm−2), at room temperature, under stirring. A bipolar membrane separates the CO2 saturated 0.1 M KHCO3 solution (pH 6.8) on the cathodic side from a 1 M KOH, 0.1 M glycerol solution (pH 13.7) in the anodic compartment. In e and i, lighter shades indicate chopped light CV traces. Average values were calculated from sample triplicates, with error bars corresponding to the standard deviation.
Both Sip and SiNW photoanodes displayed high photocurrent densities of around 10 mA cm−2 (relative to Si area) and early onset potentials of 0 V versus RHE (Supplementary Figs. 32–34), comparable to those of state-of-the-art GOR photoanodes20. This resulted in an excellent overlap of the Si and perovskite CV traces at 0.1–0.2 V versus RHE, and a very early onset bias voltage of −1.2 V for the combined PEC device (Fig. 5e,i). In this case, the overall device photocurrent was limited by the perovskite photocathodes and, hence, by the CuNF geometric area (Supplementary Fig. 32). As a result, unassisted Sip-PVK|CuNF devices displayed similar photocurrents (2–4 mA cm−2) and CO2RR selectivities to those of perovskite electrodes at 0 V versus RHE (Fig. 3a,b). A C2 hydrocarbon FY of ~1% was observed for a 40 mm2 CuNF active area, which increased to 5–7% with a 4 mm2 CuNF active area. On the anodic side, the Sip photoanode yielded glycerate (53 ± 1% FY), formate (18 ± 4% FY), lactate (8 ± 1% FY) and acetate (7 ± 2% FY) as the main liquid GOR products (Fig. 5f,g, Supplementary Figs. 35–37 and Supplementary Table 9).
Sip-PVK|CuNF and SiNW-PVK|CuNF devices displayed similar selectivities and initial photocurrents. The latter sustained a steady photocurrent over 2 h CPE at 0 V applied bias and higher cumulative product amounts (Fig. 5h and Supplementary Fig. 36). This improvement is due to the SiNW array geometry, yielding an improved fill factor, a higher surface area and reduced mass transport limitations, as shown from the decreased hysteresis in the CV scans (Supplementary Fig. 34). The Si semiconductor provided a 0.45 V photovoltage shift over the CV trace of PtAu deposited on carbon paper (Fig. 5e and Supplementary Figs. 38 and 39). The latter only overlaps with the PVK|CuNF trace at an operating potential of 0.48 V and current of 0.3 mA cm−2, similar to those of perovskite–BiVO4 tandem devices (Supplementary Fig. 38), indicating that a second light absorber is essential for C2 hydrocarbon synthesis at practical rates. Accordingly, the partial C2 photocurrent densities of SiNW-PVK|CuNF (4 mm2) devices attained 155 µA cm−2, a 200-fold improvement over those of perovskite–BiVO4 artificial leaves coupling C2 hydrocarbon production to water oxidation, whereas the total and C2 hydrocarbon solar-to-chemical efficiencies increased twofold, reaching 0.212% and 0.0017%, respectively (Supplementary Tables 10 and 13, and Supplementary Note 3). Hence, GOR contributes substantially to unassisted PEC performance, providing a practical alternative to further CO2RR catalyst development (Supplementary Note 3).
Conclusions
This work demonstrates PEC hydrocarbon synthesis by interfacing a hierarchically structured Cu nanoflower catalyst with a high-photovoltage perovskite light absorber. Their relative areas and respective local current densities are key to steering the C2 hydrocarbon selectivity, which indicates the versatility of integrated PEC systems over classical semiconductor–liquid junction photoelectrodes. The C2 selectivity of perovskite–BiVO4 PEC artificial leaves can be further increased by targeting thermodynamically favourable organic oxidations. Accordingly, unassisted perovskite–Si PEC devices coupling aqueous CO2 reduction to glycerol oxidation attain ethane and ethylene FYs between 5% and 10%, matching the optimal selectivity observed for Cu nanoflower electrodes. These results provide a proof-of-concept demonstration for simultaneous multicarbon synthesis and biomass-derived waste conversion into value-added products, which may ultimately contribute towards a sustainable fuel and chemical economy.
Methods
Materials
Cu foil (0.1 mm and 0.25 mm, Puratronic, 99.9999%, Alfa Aesar), H3PO4 (≥85%, Sigma-Aldrich), (NH4)2S2O8 (98+%, Acros), FTO glass (~7 Ω sq−1, Sigma-Aldrich), Zn dust (<10 µm, ≥98%, Sigma-Aldrich), Ni(NO3)2·6H2O (99.999%, Sigma-Aldrich), ethylene glycol (99.8%, anhydrous, Sigma-Aldrich), ethylenediamine (absolute, ≥99.5%, Sigma-Aldrich), poly[bis(4-phenyl)(2,4,6-trimethylphenyl)amine] (PTAA; molecular weight (Mw) = 17,700, EM INDEX), 2,3,5,6-tetrafluoro-7,7,8,8-tetracyanoquinodimethane (F4TCNQ, 97%, Sigma-Aldrich), PbI2 (99.99%, for perovskite precursor, TCI), PbBr2 (for perovskite precursor, TCI), formamidinium iodide (Dyesol), methylammonium bromide (Dyesol), N,N-dimethylformamide (anhydrous, 99.8%, Sigma-Aldrich), dimethyl sulfoxide (DMSO; ACS reagent, ≥99.9%), 1-methyl-2-pyrrolidone (99.5%, extradry over molecular sieves, ACROS), chloroform (99.9%, extradry over molecular sieves, ACROS), [6,6]-phenyl C61 butyric acid methyl ester ([60]PCBM; >99%, Ossila), chlorobenzene (extradry over molecular sieves ≥99.5%, ACROS), polyethylenimine (PEIE; 80% ethoxylated solution, 35–40 wt.% in H2O, average Mw = 70,000, Sigma-Aldrich), isopropanol (≥99.5%, Honeywell), graphite (powder, <20 µm, synthetic, Sigma-Aldrich), H2SO4 (≥95%, Fisher), H2O2 (>30%, Fisher and EMD Millipore), Bi(NO3)3·5H2O (98%, Sigma-Aldrich), NaI (≥99%, laboratory reagent grade, Fischer), p-benzoquinone (≥98%, Sigma-Aldrich), ethanol (absolute, VWR), vanadyl acetylacetonate (VO(acac)2; 98.0%, Sigma-Aldrich), NaOH (analytical reagent grade, Fisher, and ≥97.0%, pellets, Sigma-Aldrich), titanium(IV) butoxide (≥97.0%, Sigma-Aldrich), HCl (37%, Sigma-Aldrich), K2CO3 (Puratronic, 99.997%, Thermo Scientific), CO2 (99.999%, Linde plc), 13CO2 (99.0 atom%, Sigma-Aldrich), K213CO3 (98%, Cambridge Isotope Laboratories), D2O (D 99.9%, Cambridge Isotope Laboratories), Si wafers (6″, <100> oriented, 1–10 Ω cm, prime, single sided-polished, Addison Semiconductor Materials) and carbon paper (Sigracet 29 AA, FuelCellStore) were used as purchased without further purification.
CuNF catalyst synthesis
The CuNF synthesis was adapted from literature reports23 and further optimized for this study. The surface of flattened Cu foil was first cleaned with ethanol and manually polished using wet sandpaper (SiC, 1,200 Grit), followed by sonicating steps in acetone and water to remove residues. The foil was next electropolished in 85% H3PO4, by applying an anodic voltage of 5 V for 10 min against a Ti foil with a d.c. power supply (absolute current of ~0.4 A). Two solutions were prepared in separate vials by sonicating 1.369 g (NH4)2S2O8 in 9 ml H2O and 4.8 g NaOH in 12 ml H2O, respectively. The freshly dissolved solutions were mixed inside a jar with an additional 18 ml H2O, before placing the electrodeposited Cu foil at the centre of the closed jar. CuO nanoflower growth occurred over 135 min. The foils were gently rinsed with Milli-Q water, and the nanoporous CuO layer was scrubbed from one side to enable electrical contact. The CuO-covered foils were then reduced to CuNF by applying a potential of −0.2 V versus RHE for 20–40 min, in a three-electrode configuration with a Ag/AgCl reference electrode and a Pt wire counter electrode, in 0.1 M KHCO3, under air.
Perovskite photocathodes
Perovskite PV cells were first deposited by adapting reported procedures26,27. First, 13 × 13 mm2 FTO-coated glass substrates were masked with adhesive tape and etched using Zn powder and 2 M HCl. The patterned FTO substrates were next cleaned for 10 min in Piranha solution, obtained by adding one volumetric part of 30% H2O2 to three parts of H2SO4. A solution of 1.0 M Ni(NO3)2·6H2O and 1.0 M ethylenediamine in ethylene glycol was spin-coated on the FTO substrates at 5,000 rpm for 45 s, and then annealed at 573 K for 1 h to form a NiOx hole transport layer. Under inert atmosphere, 111 µl from a 1 mg ml−1 F4TCNQ solution in chlorobenzene was added to a 5.56 mg PTAA solution in 1 ml toluene, resulting in a 5 mg ml−1 PTAA solution with 2% F4TCNQ doping. This solution was dynamically spin-coated onto the FTO|NiOx substrates at 4,000 rpm for 30 s, then annealed at 383 K for 10 min to form a second PTAA:F4TCNQ hole transport layer. A 1.5 M CsI solution in DMSO (24 µl) was next added to a 1.0 M FAMA0.22Pb1.32I3.2Br0.66 solution in N,N-dimethylformamide (255 µl), DMSO (170 µl) and 1-methyl-2-pyrrolidone (75 µl). This triple-cation mixed-halide perovskite solution was spin-coated in two steps at 1,000 rpm for 10 s and 6,000 rpm for 35 s, whereas 75 µl of chloroform was drop cast as antisolvent before the last 7 s. The samples were next annealed at 373 K for 30 min, before spin-coating a 35 mg ml−1 PCBM solution in chlorobenzene at 3,000 rpm for 45 s as the electron transport layer. Samples were briefly taken outside the glovebox to coat a 3.87 µl ml−1 PEIE solution in isopropanol at 3,000 rpm for 30 s. A 100 nm silver layer was evaporated on top of the device stack with a photoactive area of ~25 mm2, which was manually determined. Copper foils with a CuNF catalyst were attached to the silver contacts using graphite epoxy paste. The conductive encapsulant was prepared by blending graphite powder with Araldite Standard epoxy in a 3:4 mass ratio. An insulated wire was attached to this photocathode using Ted Pella fast-drying silver paint, whereas Araldite 5-Minute Rapid epoxy was used to seal any exposed edges or wiring. The resulting photocathodes are compatible with alternative encapsulation methods including epoxy and ultraviolet curing resins, chemical vapor deposition (CVD) of micrometre-thin parylene-C coatings27, or rubber O-rings46.
BiVO4 photoanodes
BiVO4 photoanodes were prepared following reported protocols41,47. Patterned FTO slides were again obtained by masking and etching the substrates, before their cleaning in Piranha solution. A clear, red 0.02 M Bi(NO3)3·5H2O, 0.4 M NaI solution was made by dispersing the two salts with an ultrasonic probe in 20 ml of Milli-Q water, followed by pH adjustment to 1.20 using concentrated HNO3. A second solution consisted of 0.3 M p-benzoquinone sonicated in ethanol (9 ml). These two precursor solutions were mixed for BiOI electrodeposition. BiOI was deposited onto the FTO substrates in two steps, by applying potentials of −0.3 V versus Ag/AgCl for 5 s and −0.1 V versus Ag/AgCl for 180 s. Then, 40 µl cm−2 of a VO(acac)2 solution in DMSO was drop cast onto BiOI samples, before annealing them for 1 h at 723 K (1 K min−1 ramp rate). Samples were next stirred in a 0.2 M NaOH solution to remove the residual V2O5. A 4.8 mg ml−1 [Ti4O(OEt)15(CoCl)] single-source precursor solution in dry toluene was finally spin-coated in air to form the water oxidation catalyst.
TiO2 photoanodes
NW TiO2 arrays were grown onto FTO glass via hydrothermal synthesis42. Before the deposition, the Teflon liner of a 50 ml autoclave was cleaned in aqua regia. Then, 0.5 ml of titanium(IV) butoxide was added to a solution of 37% HCl (15 ml) and H2O (15 ml), and the mixture was stirred for 20–30 min. This solution was poured into the autoclave, and cleaned FTO substrates were placed inside in a tilted position. Substrates were completely immersed in the precursor solution, with the conductive FTO layer facing down. The autoclave was next placed in an oven at 443 K for 5 h. The cooled samples were rinsed with Milli-Q water and further annealed at 673 K for 1 h.
Fabrication of n-SiNW substrates
SiNW substrates were prepared following reported procedures8,20. N-type phosphorus-doped Si wafers were immersed in a 4.9% HF bath for 3 min to remove the native silica layer, then thoroughly washed under deionized water and dried. During a typical photoresist process, hexamethyldisilazane was applied for 2 min, then MiR 701 photoresist was spin-coated to form a 1-µm-thick layer. The surface was next patterned using a 5× i-line photolithography stepper (GCA 8500), which used a mask patterned with a square lattice of 3.75 µm circles and 10 µm pitch, to yield a final resist pattern of 0.75 µm circles and 2 µm pitch. The pattern was next developed using MF-26A for 60 s, descummed with O2 plasma at 50 W for 60 s and hard baked at 413 K with ultraviolet light. A low-frequency inductive-coupled plasma deep reaction-ion etch process was used to etch the wafer (Surface Technology Systems Advanced Silicon Etch). The process used O2 and SF6 as etch gas, C4F8 as passivation gas and a typical deep reaction-ion etch smooth-wall recipe to obtain 21-µm-long NWs. Any photoresist rests were removed under O2 plasma at 250 W for 7.5 min.
Fabrication of p+n-Sip|TiO2 and p+n-SiNW|TiO2 substrates
A 6″ silicon wafer was used as the dopant carrier wafer. All wafers were cleaned in a 4.9% HF bath for 3 min, then thoroughly washed with deionized water and dried. The carrier wafer was spin-coated with a gallium silicate spin-on-dopant solution (Filmtronics) at 2,200 rpm for 30 s, then baked on a hotplate at 423 K for 30 min. N-type phosphorus-doped Si wafers or n-SiNW substrates were cleaned with HF, water and acetone, then placed gently onto the carrier wafer such that the polished surface touches the dopant layer, and finally placed into a rapid thermal annealing chamber at 1,173 K for 100 s under N2. The resulting p+n-Sip and p+n-SiNW substrates were again cleaned with HF, water and acetone, before depositing a 10 nm TiO2 layer at 473 K using atomic layer deposition with a tetrakis(dimethylamido)titanium precursor (Cambridge Fiji 200 Plasma ALD system). The cooled substrates were stored under air20.
Si and carbon paper (photo)anodes for GOR
The PtAu catalyst was deposited using an in-house built, multitarget co-sputtering system with 3 × 3″ TORUS Mag Keeper sputter guns, two 2 kW pulsed d.c. power supplies and one 1.5 kW d.c. power supply. A ~4-nm-thick PtAu layer was co-sputtered onto p+n-Sip|TiO2 substrates and both sides of the carbon paper, by applying 50 W power on the Pt target and 28 W power on the Au target over 15 s. Alternatively, a ~11-nm-thick layer of PtAu was co-sputtered onto p+n-SiNW|TiO2 substrates, with 50 W power on the Pt target and 28 W power on the Au target for 45 s. The carbon|PtAu electrodes, p+n-Sip|TiO2|PtAu and p+n-SiNW|TiO2|PtAu substrates were stored under air until use. The Si substrates were later scratched with a Ga–In eutectic, coated with silver paint, and attached on titanium foil using double-sided conductive carbon tape. The resulting Si photoanodes were dried for 30 min under air before mounting onto the PEC cell20.
(Photo)electrochemical characterization
Solar cells, photoelectrodes and PEC devices were characterized using a Biologic VSP potentiostat and Newport 67005 solar light simulators with AM1.5 G optical filters. The light intensity was calibrated to 1 sun (100 mW cm−2) using a certified Thorlabs PM16-405 USB Power Meter. CV and CPE experiments were performed in a 0.1 M KHCO3 buffer solution, pH 6.8, under stirring at room temperature unless otherwise stated. The working electrode compartment of the PEC reactor was purged for 30 min with pure CO2 before experiments. Photoelectrodes were characterized in a two-compartment, three-electrode configuration with a Ag/AgCl/KCl(1 M) (CH Instruments CHI111) reference and a platinum mesh counter electrode. Selemion AMV (AGC Engineering), a standard anion exchange membrane for CO2 reduction under neutral pH, separated the anodic and cathodic compartments. This membrane allows anion transport between compartments, preventing the build-up of pH differences. Applied potentials were determined using the equation E (V versus RHE) = E (V versus Ag/AgCl) + 0.059 V × pH + 0.230 V (298 K). The potentials were not IR corrected, unless otherwise specified. CO2RR–OER tandem devices were investigated in a two-electrode, single-compartment configuration. J–V scans of solar cells were recorded between −0.1 V and 1.2 V (100 mV s−1 scan rate, 20 mV step size). CV was typically performed between −0.9 V and 0 V versus RHE for the CuNF electrodes, −0.2 V and 1.0 V versus RHE for PVK|CuNF photocathodes, 0.1 V and 1.4 V versus RHE for photoanodes and −0.7 V and 0.8 V for PEC tandems (10 mV s−1 scan rate). No masking was used for solar cells and photoelectrodes, whereas the active area of photoanodes was surrounded by opaque tape for PEC tandem devices (Supplementary Fig. 40). Geometric areas of each (photo)electrode were measured with 0.5 mm precision for perovskite light absorbers and 0.1 mm precision for CuNF catalysts, which amounts to a measurement uncertainty <10%, within common experimental error. For CO2RR–GOR devices, the Si photoanode was mounted on the back wall using an x-ring defining a 37.8 mm2 photoactive area. The anodic compartment contained 1 M KOH, 0.1 M glycerol solution (pH 13.7) under air and was separated from the cathodic side by a bipolar membrane (Fumasep), which is necessary for solutions of different pH values.
Product quantification
Gaseous products were typically accumulated in the extended headspace of a PEC reactor over 2 h CPE tests (Supplementary Fig. 41). Three millilitres of the headspace were injected in an Agilent 7890B gas chromatograph. CO, C2H4 and C2H6 quantification was performed using a flame ionization detector (see example traces in Supplementary Fig. 42). A thermal conductivity detector was used for H2, N2 and O2 detection. However, the small amounts of O2 produced by tandem devices under unassisted operation (~1.1 µmol, or 27 µl) could not be detected due to interferences from atmospheric O2. Apparent gas leakage remained below 10% of the headspace, including product losses during gas sampling and transfer. An SRI MG3 gas chromatograph was used for product quantification under CO2 flow, which was set to 5 sccm using an Omega Engineering FMA5508 gas mass flow controller. 13C isotope measurements were carried out on a Waters AutoSpec Premier GC-MS with 0.0002 m/z resolution. Liquid product quantification was performed via water suppression 1H NMR spectroscopy on a 600 Hz Bruker AV600 equipment. For this purpose, 10 vol.% of a D2O–DMSO standard was added to the analyte solution. The standard solution was prepared by adding 400 µl DMSO to 100 g of D2O (refs. 8,20,48).
Materials characterization
SEM images and EDX mapping were recorded using a Zeiss Gemini Ultra-55. X-ray photoelectron spectroscopy was performed on a Thermo Scientific K-Alpha instrument using an Al Kα source. A spot size of 400 µm and a pass energy of 50 eV were used. XRD data were collected using a Bruker D8 laboratory diffractometer with a Cu Kα radiation source in ambient condition. Data were collected from 2θ = 10° to 90° with a step size of 0.02941692° per step and time per step of 1 s.
Statistics
Averaged values are calculated from sample triplicates, whereas measurement errors and error bars correspond to the standard deviation.


Responses