Anion vacancies activate N2 to ammonia on Ba–Si orthosilicate oxynitride-hydride
Main
Oxygen vacancies on oxide-based catalysts sometimes play a key role in various chemical reactions. For example, the oxidation of organic molecules effectively proceeds over a V2O5 catalyst, in which the lattice oxygen of V2O5 reacts with the substrate to form V2O5−x (x, oxygen vacancy) and is regenerated by gas-phase O2 molecules1. The redox between V5+ and V4+ is the driving force for this reaction, which is well known as the Mars–van Krevelen mechanism. In oxide-supported metal catalysts, oxygen vacancy sites directly activate the reactant molecule (Mars–van Krevelen mechanism) or indirectly promote the supported metal sites through electronic metal–support interaction2,3. In any case, transition metal (TM) sites, including lattice metal cations and/or the supported metal, are essential to activate various molecules in catalysis. In other words, oxide materials do not work effectively as catalysts in the absence of TM sites.
Ammonia synthesis also occurs on the surface of TMs such as Fe and Ru (refs. 4,5). The overall reaction rate is governed by the nitrogen binding energy (EN) of the TM because the N2 dissociation is the rate-determining step (RDS). This leads to the establishment of a volcano-shaped relationship between the ammonia synthesis activity and EN (refs. 6,7). Most studies in the past two decades have been focused on the development of efficient oxide-based supports or promoters that would enhance electron transfer to the TM sites and thus facilitate N≡N bond weakening through metal-to-N2 π backdonation8,9. Electride and hydride-based catalysts were recently demonstrated to exhibit enhanced activity for ammonia synthesis under mild reaction conditions10,11,12,13,14,15. In addition, the N2 reduction to NH3 is facilitated by the redox properties of the lattice TM sites, such as Ce in BaCeO1.80H0.57N0.23 (ref. 16) and Ti in ΒaTiΟ2.5Η0.5 (ref. 17). However, although these new strategies promote ammonia synthesis efficiency, TMs are still irreplaceable as active centres for N2 dissociation in most cases. Only alkali or alkali earth metal hydrides such as KH and BaH2 have been reported to function as catalysts for ammonia synthesis in the absence of TMs (refs. 18,19). Reports on ammonia synthesis over TM-free oxide-based catalysts are lacking.
In this Article, we fabricate a Ba–Si orthosilicate oxynitride-hydride via low-temperature solid-state reaction and demonstrate its excellent ability for TM-free NH3 synthesis under mild conditions. Although loading Ru on Ba3SiO5−xNyHz enhances the activity, Ru does not serve to dissociate N2 molecules but facilitates the formation of electron-containing anion vacancy (Va) sites at the Ru–support interface. This is a striking difference from the well-known role of Ru in NH3 synthesis. As a result, an exceptionally high ammonia synthesis rate that outperforms existing heterogeneous ammonia synthesis catalysts is realized.
Results and discussion
Synthesis and characterization of Ba3SiO5−xNyHz
The substitution of oxygen bonded to Si4+ with other anions is generally difficult due to the strong Si–O bonding, except under harsh conditions20,21,22,23. In this Article, the following synthetic route was employed; the low-temperature (400–700 °C) solid-state reaction of Ba(NH2)2 and SiO2 in a NH3 flow was applied to the one-step synthesis of Ba3SiO5−xNyHz with heavily substituted H− and N3− (Methods and Supplementary Fig. 1). The X-ray diffraction (XRD) pattern for Ba3SiO5−xNyHz synthesized at 600 °C indicates a single Ba3SiO5 phase with a purity of >99% and a large shift to lower diffraction angles from that of Ba3SiO5 (Fig. 1 and Supplementary Fig. 2). The lattice parameters of Ba3SiO5−xNyHz are much larger than those of Ba3SiO5 as determined by Rietveld fitting analysis (∆V/V0 = +9.0%; V and V0 represent volume of sample and reference Ba3SiO5, respectively) (Supplementary Table 1). The H− and N3− contents of Ba3SiO5−xNyHz were determined to be 3.74 and 1.60 mmol g−1, respectively, based on temperature-programmed desorption (TPD) and an acid dissolution method (Methods), which gave the composition of Ba3SiO2.87N0.80H1.86. Diffuse reflectance spectroscopy (DRS) and projected density of states analysis of Ba3SiO5−xNyHz suggest that the N2p bands are located above the H1s and O2p bands and thus contribute to bandgap narrowing compared to white Ba3SiO5 powder (Supplementary Fig. 3).
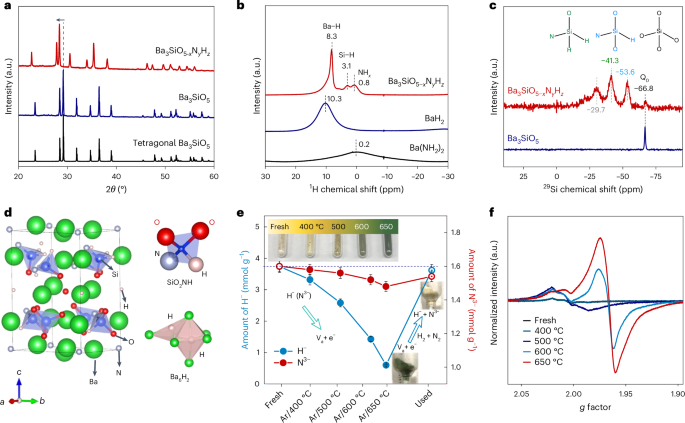
a, XRD patterns of Ba3SiO5−xNyHz and Ba3SiO5. b, Solid-state 1H MAS NMR spectra of Ba3SiO5-xNyHz, BaH2 and Ba(NH2)2. c, Solid-state 29Si MAS NMR of Ba3SiO5 and Ba3SiO5−xNyHz. d, Calculated crystal structure of Ba3SiO2.5NH2 (left) with SiO2NH and Ba6H2 blocks (right). e, Lattice H− and N3− contents in Ba3SiO5−xNyHz before (fresh) and after heating in Ar at various temperatures. The used sample was obtained by heating the sample (Ar/650 °C) under ammonia synthesis conditions (400°C, 0.1 MPa) for 2 h. Insets: photographs of the corresponding Ba3SiO5−xNyHz powders. The error bars represent the standard deviation of the mean based on n = 3 independent measurements. f, X-band EPR spectra of Ba3SiO5−xNyHz before and after heating in Ar at various temperatures. a.u., arbitrary units.
Source data
The location of N and H in Ba3SiO5−xNyHz has been confirmed by 1H and 29Si solid magic-angle spinning (MAS) NMR spectroscopy analysis. In the 1H MAS NMR spectrum (Fig. 1b), the Ba3SiO5-xNyHz sample shows a main sharp signal at 8.3 ppm. This is assigned to Ba–H species as its chemical shift is very similar to that of BaH2 (10.3 ppm). The peaks at 3.1 and 0.8 ppm are attributed to Si–H and N–H species, respectively. The former is well consistent with H-terminated Si nanocrystals and molecular silicon hydrides (3–6 ppm)24 and the latter is close to those of Ba(NH2)2 (0.2 ppm) and Ca(NH2)2 (0.7 ppm)25. The N–H peak is derived from surface NHx species on the Ba3SiO5−xNyHz (Supplementary Fig. 4). In the 29Si MAS NMR spectrum (Fig. 1c), both Ba3SiO5−xNyHz and Ba3SiO5 have signals at −66.8 ppm, which are attributed to the isolated SiO4 tetrahedra (orthosilicate anion) unit (Q0 site). As well as this signal, new signals at −53.6, −41.3 and −29.7 ppm appeared for Ba3SiO5−xNyHz. These peaks are assignable to the Q0 site with different anion coordinations since the 29Si chemical shift tends to be more shielded with increasing group electronegativity sums of ligands bonded to Si26,27. Possible species are SiO2NH, SiONH2 and SiOxNHx with surface OH and/or NH species, respectively. The tetragonal Ba3SiO5 crystal has two types of oxygen site, that is four OI sites in SiO4 and one OII site surrounded by six barium atoms (Ba6O). Density functional theory (DFT) calculations suggest that the Ba3SiO2.5N1.0H2.0 unit cell is mainly comprised of N–H pairs that substitute two OI sites (2O2− ⇒ N3− + H−) to form SiO2NH blocks and extra H–H pairs that substitute one OII site (O2− ⇒ 2H−) to form Ba6H2 blocks (Fig. 1d and Supplementary Figs. 5 and 6). In the Ba6H2 block, one H− ion is located at an OII site and another H− ion occupies an interstitial site adjacent to the Ba6H1 unit, resulting in lattice expansion (∆V/V0 = +9.4%, Supplementary Tables 1–4). The Ba3SiO5, which is regarded as an antiperovskite, can accommodate a variety of combinations of elements because of its sufficient lattice space28, enabling a unique mixed-anion structure.
The yellow-coloured Ba3SiO5−xNyHz powder was heated under Ar gas flow to monitor the thermal stability of lattice H− and N3−. Upon increasing the temperature from 400 to 650 °C, the sample colour changed from light yellow to light green and finally to dark green (Fig. 1e). Most of the lattice H− and a part of the N3− (from the subsurface region) can be removed by heating at 650 °C in Ar flow (Fig. 1e, Supplementary Fig. 7 and Supplementary Table 5), leading to introduction of a high density of Va sites into the crystal without destruction of the tetragonal Ba3SiO5 framework (Supplementary Figs. 8–11). The colour change due to the introduction of Va sites is well understood by electron paramagnetic resonance (EPR) and DRS analysis (Fig. 1f and Supplementary Figs. 12–14). The as-prepared Ba3SiO5−xNyHz exhibits weak EPR signals at g of approximately 2.004, 2.003 and 2.002 (Fig. 1f and Supplementary Fig. 12). The intensity of these signals was enhanced with the heating temperature and a new EPR signal at g = 1.967 with strong intensity appeared above 600 °C. These two sets of peaks could be attributed to the unpaired electron trapped at the Va of the SiO2NH and Ba6H2 sites. The unpaired electron density of the sample heated at 650 °C was estimated to be 1.1 × 1020 cm−3 (Supplementary Fig. 13), which is smaller than the total electron density (approximately 7.4 × 1020 cm−3) that was evaluated by the iodometric titration method29. This indicates that the sample has both unpaired electrons and paired electrons in the lattice. Moreover, when the dark green Ba3SiO5−xNyHz powder (Ar/650 °C) was heated under ammonia synthesis conditions, the lattice H− and N3− were regenerated and the dark green colour turned to the original yellow (used) (Fig. 1e).
Ammonia synthesis on Ba3SiO5−xNyHz
The fresh Ba3SiO5−xNyHz without any TM site shows continuous ammonia production at approximately 0.37 mmol gcat−1 h−1 without degradation in activity for 150 h at 400 °C and 0.9 MPa (Fig. 2a and Supplementary Table 6). The total amount of ammonia was estimated to be approximately 5.25 mmol (per 0.1 g of catalyst), which is much higher than that of the amount of lattice N3− (0.16 mmol) and H− (0.37 mmol). This indicates that the ammonia produced originates from the activation of molecular N2 and H2 but not from the decomposition of Ba3SiO5−xNyHz (Supplementary Fig. 15). There was no colour change or alteration of the crystal structure after the 150 h reaction (Fig. 2b and Supplementary Figs. 8 and 9), which suggests that the Ba3SiO5−xNyHz is chemically stable under the ammonia synthesis conditions. When the Ba3SiO5−xNyHz was pretreated in Ar flow at 650 °C for 2 h, XRD peaks shifted towards higher angles because of removal of most lattice H− and surface N3− ions (Fig. 2b). The Va-introduced Ba3SiO5−xNyHz exhibited more than three times the NH3 synthesis rate (approximately 1.20 mmol g−1 h−1) than the original one, probably due to the increase of specific surface area from 8.0 to 19.5 m2 g−1. After the ammonia synthesis reaction, the Va sites were re-occupied by H− and N3− (Supplementary Table 5), leading to a shift of XRD peaks towards the original positions and the recovery of the 1H NMR signal (Fig. 2b,c and Supplementary Fig 11a). Neither white Ba3SiO5, Ba3Si6O9N4, BaSi2O2N2 or Ba(NH2)2 nor SiO2 powder exhibits activity for ammonia synthesis, even at temperatures up to 540 °C. By contrast, the Ba3SiO5−xNyHz powder (Ar/650 °C) can effectively activate N2 to produce ammonia at temperatures down to 300 °C (0.20 mmol g−1 h−1, Fig. 2d) with a low apparent activation energy (Ea) of approximately 68.5 kJ mol−1, which outperforms that of the conventional Ru-loaded MgO catalyst (300 °C, 0.01 mmol g−1 h−1, Ea = 114.5 kJ mol−1). TPD and hydrogen temperature-programmed reduction (H2-TPR) analysis results show that lattice N3− ions in conventional Ba–Si oxynitrides with Si–N–Si bonding are very stable and could not be reduced to ammonia up to 900 °C (Supplementary Fig. 16). This is totally different from Ba3SiO5−xNyHz. We suggest that easy thermal desorption of N3− and H− mainly comes from the orthosilicate structure of Ba3SiO5−xNyHz, where SiX4 tetrahedra (X = O, N, H) do not connect with each other and lattice N and H are coordinated by not only Si but also Ba. Therefore, when the Va sites are formed, electrons at Va sites are stabilized by the Coulombic interaction with Ba (Fig. 2c). The lattice H− ions do not directly contribute to hydrogenation of N2 but provide a number of Va sites to capture N2 molecules in the gas phase (Supplementary Fig. 17). It can be expected that lattice H− and N3− ions are continuously exchanged with molecular H2 and N2 via the Va formation on Ba3SiO5−xNyHz during ammonia synthesis. Thus, the Ba–Si orthosilicate oxynitride-hydride was shown to function as a TM-free ammonia synthesis catalyst.
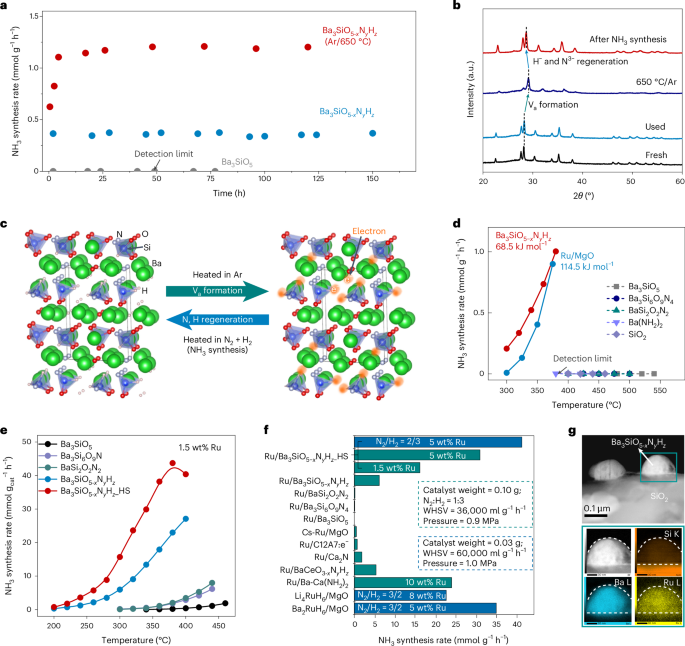
a, Time courses for ammonia synthesis over as-prepared Ba3SiO5−xNyHz, Ba3SiO5−xNyHz pretreated at 650 °C in Ar for 2 h and Ba3SiO5 at 400 °C and 0.9 MPa. b, XRD patterns of as-prepared Ba3SiO5−xNyHz (fresh) and Ba3SiO5−xNyHz pretreated at 650 °C in Ar for 2 h before and after the catalytic test in a. c, Schematic illustration of thermal induced Va and electron formation and the N, H regeneration under NH3 synthesis conditions in Ba3SiO5−xNyHz. d,e, Temperature dependence of the NH3 synthesis rate over TM-free materials (d) and the Ru (1.5 wt%)-loaded samples under a pressure of 0.9 MPa (e). f, NH3 synthesis rates for various Ru-based catalysts at 300 °C. g, HAADF-STEM image (top) and EDX-mapping (bottom) of used Ru/Ba3SiO5−xNyHz_HS.
Source data
The Ru (1.5 wt%)/Ba3SiO5−xNyHz catalyst functioned as an efficient catalyst for ammonia synthesis at above 200 °C (0.32 mmol gcat−1 h−1) and reached 27.1 mmol gcat−1 h−1 at 400 °C (Fig. 2e and Supplementary Fig. 18), which is far beyond that of the Ru/Ba3SiO5, Ru/Ba3Si6O9N4 and Ru/BaSi2O2N2 catalysts. The high ammonia synthesis activity was maintained for more than 170 h without crystal structure decomposition (Supplementary Fig. 19 and Supplementary Table 5), which demonstrates its excellent catalytic stability. This result is in contrast to that of the reported TM-free catalyst, potassium hydride-intercalated graphite composite catalyst (KH0.19C24). The activity of KH0.19C24 is not promoted by the supported TM catalysts19. The Ea of Ru/Ba3SiO5−xNyHz was as low as 64.4 kJ mol−1, which is much lower than that of Ru/Ba3SiO5 (110.3 kJ mol−1) and the reported conventional Ru-based catalysts (85–121 kJ mol−1). When Ru/Ba3SiO5−xHyNz particles (Ru: 1.5 wt%) were dispersed on the SiO2 surface, the resultant sample (Ba3SiO5−xNyHz_HS) with high surface area (105 m2 g−1) (Supplementary Fig. 20) exhibited much higher catalytic performance than that of Ru/Ba3SiO5−xHyNz. After the optimization of the reaction conditions (Supplementary Fig. 21), Ru (5.0 wt%)/Ba3SiO5−xNyHz_HS recorded the highest ammonia synthesis rate among the reported catalysts (Fig. 2f and Supplementary Table 7)12,15,16,30,31,32,33. In addition, the activity of Ru/Ba3SiO5−xNyHz_HS was maintained even after exposure to air for 2 h (Supplementary Fig. 22). The excess SiO2 may improve the stability of the catalyst in air.
High-angle annular dark-field scanning transmission electron microscopy (HAADF-STEM) analysis showed that small-sized Ru nanoparticles (approximately 3 nm) are highly dispersed on the surface of Ba3SiO5−xNyHz (Supplementary Fig. 23). The Ru particle size of Ru/Ba3SiO5−xNyHz is smaller than that of Ru/Ba3SiO5, while the large activity difference between them cannot be explained by the Ru particle size. For Ru/Ba3SiO5−xNyHz_HS, the Ba3SiO5−xNyHz particles with sizes of 100–200 nm are dispersed on the surface of SiO2 (Fig. 2g and Supplementary Fig. 24). As a result, the active Ba3SiO5−xNyHz loaded with tiny Ru nanoparticles (approximately 2.5 nm) is effectively exposed on the catalyst surface for Ru/Ba3SiO5−xNyHz_HS. The valance state of Ru on Ba3SiO5−xNyHz is almost neutral (metallic) but slightly positive according to the Ru K-edge X-ray absorption near edge structure (XANES) (Supplementary Fig. 25) and X-ray photoelectron spectroscopy (XPS) results (Supplementary Fig. 26). This suggests that the electrons are donated from Ru to Ba3SiO5−xNyHz due to the strong Ru–N interaction. This result is rather different from those of conventional Ru-based ammonia synthesis catalysts that require negatively charged Ru to activate N2. The reaction orders of N2 (α), H2 (β) and NH3 (γ) for Ru/Ba3SiO5−xNyHz were determined to be 0.55, 0.48 and −0.63, respectively (Supplementary Fig. 27). In particular, the N2 reaction order (α = +0.55) is only half that of conventional catalysts (α = ~1.0), where the overall reaction rate is limited by the N2 cleavage step. This result indicates the change of RDS from N2 dissociation to other elementary steps over the Ru/Ba3SiO5−xNyHz catalyst. The H2 reaction order for Ru/Ba3SiO5−xNyHz is positive (β = +0.48), which suggests that the Ru/Ba3SiO5−xNyHz is not subject to H2 poisoning.
Isotope-labelled ammonia synthesis on Ba3SiO5−xNyHz
Ammonia synthesis employing a mixed gas flow of 15N2 and H2 at 400 °C was conducted to elucidate the catalytic reaction mechanism over Ba3SiO5−xHyNz and Ru/Ba3SiO5−xHyNz. The m/z = 16, 17 and 18 signals gradually increased with decreasing m/z = 30 (15N2) and m/z = 2 (H2) (Supplementary Figs. 28 and 29), which indicates the effective formation of ammonia over Ba3SiO5−xHyNz in the absence of any TM sites (Fig. 3a). No 29N2 formation indicates that the N2 isotope exchange reaction (N2-IER) does not proceed since the Ba3SiO5−xHyNz does not have direct N2 dissociation ability. In contrast to Ru/MgO (Supplementary Fig. 30), the mass signal intensity ratios of (m/z = 16)/(m/z = 18) and (m/z = 17)/(m/z = 18) over Ba3SiO5−xNyHz were much larger than the theoretical values of 0.8 and 0.075 (Fig. 3b), which indicates the formation of 15NH3 as well as 14NH3. N2 gas with 15N was desorbed from the Ba3SiO5−xNyHz used after the isotope-labelled ammonia synthesis test (Fig. 3c), indicating that lattice 14N3− of Ba3SiO5−xNyHz was partially replaced with 15N3− from gaseous 15N2 during the isotope test. Similar results were observed for Ru/Ba3SiO5−xHyNz (Fig. 3d–f and Supplementary Fig. 31), which suggests the Ru-loading does not change the Va-mediated N2 activation processes. The concentration of lattice 15N3− in Ru/Ba3SiO5−xNyHz reaches approximately 37%, which is more than five times higher than that of bare Ba3SiO5−xNyHz (approximately 7%) and illustrates that loading of Ru nanoparticles would facilitate the formation of Va sites at the Ru–support interface as N2 activation centres. The catalytic cycle for Va-mediated N2 activation to ammonia was further confirmed by switching the reaction gas atmosphere between H2 and N2 (Supplementary Fig. 32). Accordingly, the lattice N3− ions in Ba3SiO5−xNyHz were consumed by hydrogenation and were immediately regenerated by the reaction of Va sites with molecular N2. This shows that the transiently formed Va sites function for N2 activation. To confirm the validity of this model, we examined the effect of Ni (which is known to have weak interaction with N) loading, and found no significant enhancement of activity (2.1 mmol g−1 h−1 at 400 °C and 0.9 MPa) and Va formation compared with the bare Ba3SiO5−xNyHz (Supplementary Figs. 33 and 34).
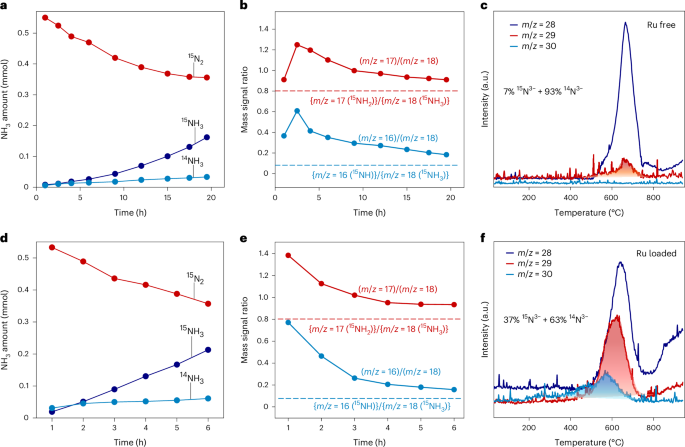
a,b, Reaction time profiles for NH3 synthesis from 15N2 and H2 over Ba3SiO5−xNyHz (a) and the change in mass signal ratio over reaction time (b). c, TPD for Ba3SiO5−xNyHz collected after the isotope-labelled ammonia synthesis. d,e, Reaction time profiles for NH3 synthesis from 15N2 and H2 over Ru/Ba3SiO5−xNyHz (d) and the change in mass signal ratio over reaction time (e). The dotted lines in b and e represent the theoretical fragment ratio (NH2/NH3 = 0.8 and NH/NH3 = 0.075). f, TPD for Ru/Ba3SiO5−xNyHz collected after the isotope-labelled ammonia synthesis. The content of 15N in the desorbed nitrogen gas was calculated from the shaded area in panels c and f.
Source data
Anion-vacancy-mediated N2 activation on Ba3SiO5−xNyHz
N2 activation on the Ba3SiO5−xNyHz catalyst was further examined using diffuse-reflectance infrared Fourier transform spectroscopy (DRIFTS). It should be noted that Ba3SiO5−xNyHz without Ru exhibits a peak centred at around 2,016 cm−1, which is much lower than that of conventional Ru catalysts (Ru/MgO, 2,231 cm−1)34,35 and electride-based catalysts (Ru/C12A7:e−, 2,176 cm−1)12 (Fig. 4a and Supplementary Fig. 35). This is in contrast to N2 adsorption on conventional non-TM sites through electrostatic interaction, where N2 serves as a weak base molecule interacting with acid sites (electropositive sites) resulting in a blue-shift of the N≡N bond frequency36,37,38. In the case of Ba3SiO5−xNyHz, electrons trapped at the Va sites directly interact with N2 and facilitate π backdonation into the antibonding orbital of the N2 molecule, which leads to a red-shift of the N2 adsorption band. The N2 peak position slightly blue-shifts after Ru loading on the Ba3SiO5−xNyHz surface, which indicates that N2 molecules are mainly captured at the Va sites of Ba3SiO5−xNyHz accompanied by the influence of the positively charged Ru site. The N2-IER rate of Ru/Ba3SiO5−xNyHz is negligibly smaller than that of Ru/MgO although Ru/Ba3SiO5−xNyHz showed an over ten times higher ammonia synthesis rate than Ru/MgO (Fig. 4b and Supplementary Fig. 36). This result indicates that the Ru nanoparticles on Ba3SiO5−xNyHz do not function to dissociate N2, which is a striking difference from the well-known role of Ru in NH3 synthesis39,40,41.
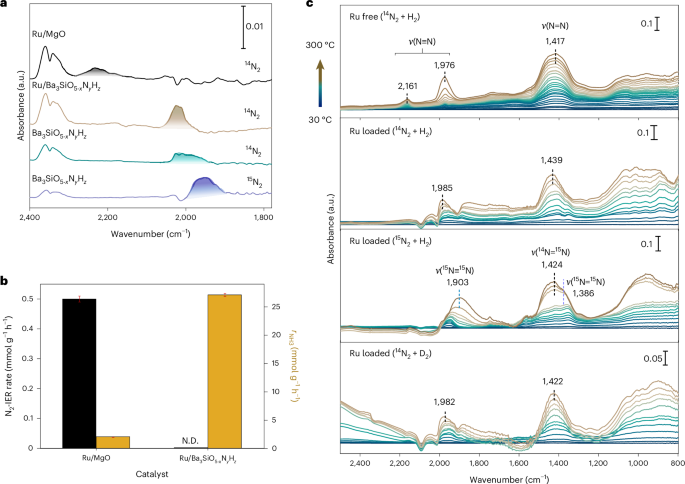
a, DRIFTS N2 adsorption on Ru/MgO, Ru/Ba3SiO5−xNyHz and Ba3SiO5−xNyHz at −170 °C. b, Comparison of N2-IER rate and ammonia synthesis rate (0.9 MPa) at 400 °C for Ru/MgO and Ru/Ba3SiO5−xNyHz. The error bars represent the standard deviation of the mean based on n = 3 independent measurements. N.D., not detected. c, In situ DRIFTS observation of formation of intermediates on Ba3SiO5−xNyHz (Ru free) and Ru/Ba3SiO5−xNyHz (Ru loaded). The measurement temperature was increased from 30°C (blue) to 300°C (brown).
Source data
In situ DRIFTS measurements (Fig. 4c and Supplementary Fig. 37) showed N2 adsorption peaks at 2,161 and 1,976 cm−1, which may be attributed to N≡N stretching of N2 molecules adsorbed at different Va sites close to Si and Ba sites on Ba3SiO5−xNyHz. In particular, the latter peak was red-shifted relative to that observed at −170 °C (2,016 cm−1). This means that the N≡N bond is effectively weakened at reaction temperatures42. In addition, the peak intensity steeply increased with increasing reaction temperature especially above 200 °C. This is due to the accumulation of N2 molecules at the Va sites not only on the top surface but also in the subsurface region of Ba3SiO5−xNyHz. It should be noted that another intense band was observed at approximately 1,417 cm−1, which can be assigned to the N=N bond43. Moreover, the N–H stretching vibration was observed at 3,187–3,244 cm−1 (Supplementary Fig. 37b), which is attributed to the formation of imide species. Similar intermediates were observed for Ru/Ba3SiO5−xNyHz, where N2 peaks above 2,000 cm−1 are immediately consumed to form other nitrogen species, giving negative peaks. Accordingly, NNH species could be generated as intermediates on this catalyst during ammonia synthesis. The N≡N (1,985 cm−1) and N=N (1,439 cm−1) stretching vibration of Ru/Ba3SiO5−xNyHz red-shifted to 1,903 cm−1 and 1,386 cm−1, respectively when 15N2 and H2 flow was conducted (Fig. 4c). The peak shift is reasonably explained by the isotope effect (1,985 cm−1 × (14/15)1/2 = 1,917 cm−1, 1,439 cm−1 × (14/15)1/2 = 1,390 cm−1). The 1,439 cm−1 peak is not due to the H–N–H bending vibration since the peak position is not largely shifted under 14N2 and D2 flow conditions. On the other hand, the NNH bending vibration would appear at around 1,400–1,480 cm−1, overlapping with the broad ν(N=N) band centred at around 1,420 cm−1. The small shift from 1,439 to 1,422 cm−1 is consistent with the isotope effect from the N=N bond in NNH (1,439 cm−1) to NND (1,417 cm−1). From these results, it can be concluded that the N2 molecule is activated at Va sites on Ba3SiO5−xNyHz and sequentially hydrogenated to form NNHx (x = 1–3) species through the associative reaction mechanism.
DFT calculations
A DFT calculation study of reaction pathways was performed using Ba48Si16O40N15H32 loaded with Ru12 clusters and the reference Ru/MgO catalyst (Fig. 5 and Supplementary Figs. 38 and 39). First, H2 was dissociated on Ru with a negligible energy barrier (I → II). The dissociated H* was then migrated from the Ru surface to a nearby lattice N of the support (II → III). Further hydrogenation reactions occurred sequentially to form NH3 and a nitrogen vacancy site (VN) site was formed after NH3 desorption (III → VII). The formation energy of an N vacancy (ENV of Ru/Ba3SiO5−xNyHz (−1.21 eV) is much lower than that of bare Ba3SiO5−xNyHz (−0.87 eV), which indicates that the supported Ru nanoparticles facilitate the formation of VN sites (Supplementary Fig. 40). The adsorption energies of N2 on both Ru and VN sites of Ru/Ba3SiO5−xNyHz are calculated to be −0.4 eV (Supplementary Fig. 41), suggesting that N2 is likely to be adsorbed on both sites. The energy barrier for N2 dissociation on the Ru surface was 0.47 eV, which was lower than that of NNH formation (0.79 eV, TS IV). However, CO adsorption experiments confirmed that the Ru surface was barely exposed on Ru/Ba3SiO5−xNyHz (Supplementary Fig. 42). Therefore, the N2 activation at the VN site is more plausible than that on the Ru surface. The N2 molecule adsorbed at the VN site was coordinated to the adjacent Ba, Si and Ru sites, resulting in elongation of the N–N bond (1.31 Å) (Step IX). The hydrogenation of N2 at the VN site to form *NNH (IX → X) occurs in preference to direct dissociation of N2 (Supplementary Fig. 43). *NNH2 and *NNH3 are generated by sequential hydrogenation (VIII → XII) via the distal pathway44. The energy barriers for the hydrogenation of both lattice N and molecular N2 are similar, in the range 0.44–1.18 eV, indicating that these hydrogenation steps are kinetically significant. Among them, the step for *NNH to *NNH2 (1.18 eV) is the highest and is considered as the RDS. These calculation results agree well with the in situ DRIFTS observation result as shown in Fig. 4c, in which the NNH species is the main intermediate on the Ru/Ba3SiO5−xNyHz catalyst. After NH3 desorption from NNH3, the remaining nitrogen compensates the VN site to restore the initial Ba3SiO5−xNyHz surface. The lattice hydrogen on Ba3SiO5−xNyHz easily migrates and covers the Ru surface (I in Fig. 5) and hydrogen is rapidly transferred to the Ru surface even when the H2 molecule is adsorbed on the VN site (Supplementary Fig. 44). These results support our proposed reaction mechanism, in which N2 and H2 molecules are activated at the VN site and Ru surface, respectively.
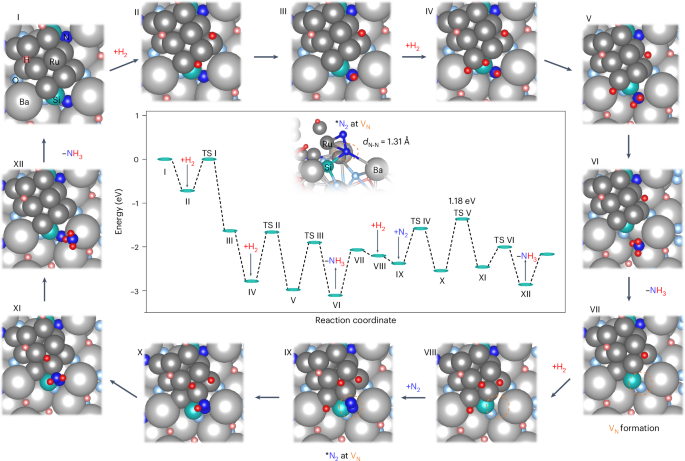
The proposed reaction pathway for Va-mediated ammonia synthesis on the Ru/Ba3SiO5−xNyHz surface. The central plot shows the energy profiles determined from DFT calculations. TS, transition state. The structures of reaction intermediates on Ru12/Ba48Si16O40N15H32 for each elementary step (I–XII) are shown around the outside of the central plot. The structure of *N2 adsorbed on the VN site is highlighted in the central plot.
Source data
Conclusion
In summary, we employed a low-temperature solid-state reaction strategy for the synthesis of a Ba–Si orthosilicate oxynitride-hydride with a high concentration of lattice H− and N3− heteroanions. The anion vacancy of this TM-free oxide-based compound serves as an active site for efficient N2 activation and hydrogenation to ammonia. The ammonia synthesis rate is dramatically increased upon Ru loading (1.5–5.0 wt%), where Ru does not work to dissociate N2 but facilitates the formation of Va sites at the Ru–support interface. Isotope-labelling ammonia synthesis, N2 exchange and DRIFTS N2 adsorption experiments showed that N2 molecules are directly activated by the electron-containing Va sites of Ba–Si orthosilicate oxynitride-hydride and thus facilitate ammonia synthesis via hydrogenation processes with low activation barriers. We suggest that easy formation of Va sites and the flexibility of the crystal structure that allows it to accommodate large amounts of anion vacancies are essential to enable the higher catalytic activity. Our studies of Va-mediated dinitrogen reduction to ammonia over this oxynitride-hydride catalyst illustrate the significant potential for the development of more efficient catalysts for low-temperature ammonia synthesis and other heterogeneous catalysis processes.
Methods
Synthesis of Ba3SiO5−xHyNz
The substitution of oxygen bonded to Si4+ with other anions is generally difficult due to the strong Si–O bonding. We have focused on tribarium silicate (Ba3SiO5) because its crystal structure is composed of isolated (ortho) SiO4 tetrahedra and BaO units (isolated O2− coordinated with Ba2+ ions) and the substitution of the latter oxygen ions is expected to be much easier than the former. This material is generally synthesized by solid-state reaction at elevated temperatures (over 1,200 °C)20,21. Oxygen substitution with other anions such as H− and N3− does not readily proceed at low temperatures22,23. Ba3SiO5−xHyNz powder was prepared by a low-temperature solid-state reaction. Dehydrated SiO2 (Q-3, Fuji Silysia Chemical) and Ba (99.99%, Aldrich) with a molar ratio of 1:3 were set in a stainless-steel reactor operated in an Ar-filled glovebox. Ammonia gas was introduced to the reactor with a flow rate of 50 ml min−1 at a temperature of approximately −50 °C for 30 min to obtain sufficient liquefied ammonia. Ba was dissolved in the liquefied ammonia under magnetic stirring for another 1 h at the same temperature. The well-sealed reactor was then heated under a temperature programme of 50 °C for 30 min, 75 °C for 30 min and 100°C for 1 h to obtain a barium amide–SiO2 (3Ba(NH2)2–SiO2) mixture. The mixture was collected in an Ar-filled glovebox after removal of the unreacted ammonia inside the reactor through discharging to the atmosphere by Ar gas introduction at 50 °C. The obtained powder mixture was then wrapped in molybdenum foil and heated in a quartz-tube reactor under a NH3 flow (100 ml min−1). The heating temperature was increased from room temperature to 400–700 °C with a heating rate of 5 °C min−1 and maintained at the target temperature for 12 h. After cooling to room temperature, the obtained yellow Ba3SiO5−xHyNz powder was collected and stored in an Ar-filled glovebox for further use. High surface area Ba3SiO5−xHyNz_HS powder was prepared by the same method with only the molar ratio of SiO2 to Ba changed from 1:3 to 1:1.05. The effect of TM impurities such as Fe, Co, Ru and Mo in Ba3SiO5−xHyNz after the ammonia synthesis test was determined by inductively coupled plasma atomic emission spectroscopy analysis (ICPS-8100, Shimadzu).
Synthesis of Ba3SiO5, Ba3Si6O9N4 and BaSi2O2N2
Ba3SiO5 powder was prepared by high-temperature solid-state reaction of well-mixed SiO2 and BaCO3 at 1,240 °C in an Ar (95%)/H2 (5%) flow. Typically, BaCO3 (99.95%, High Purity Chemicals) and SiO2 (Q-3, Fuji Silysia Chemical) in a stoichiometric ratio were thoroughly mixed in a small amount of ethanol and ground in an agate mortar for 1 h. After drying, the mixture was calcined at 1,240 °C in a tube furnace under an Ar (95%)/H2 (5%) flow for 12 h. The conventional Ba3Si6O9N4 and BaSi2O2N2 were synthesized by the reported two-step procedures using BaSiO3 and Ba2SiO4 as precursors, respectively45,46. First, a well-mixed BaCO3 and SiO2 mixture with a molar ratio of 1:1 (2:1) was calcined in a tube furnace at 1,150 °C for 5 h under a flow of N2 (95%)/H2 (5%) to obtain BaSiO3 (Ba2SiO4). Subsequently, BaSiO3 (Ba2SiO4) and Si3N4 with a molar ratio of 3:1 (1:1) were well mixed by grinding and the mixture was further calcined in a tube furnace at 1,350 °C for 5 h under the flow of N2 (95%)/H2 (5%) to obtain Ba3Si6O9N4 (BaSi2O2N2).
Loading of TM nanoparticles
The loading of Ru nanoparticles (NPs) on various supports (Ba3SiO5−xNyHz, Ba3SiO5, Ba3Si6O9N4, BaSi2O2N2, Ba(NH2)2, SiO2 and MgO) was performed by the chemical vapour deposition method using triruthenium dodecacarbonyl (Ru3(CO)12, 99%, Aldrich) as a precursor. Typically, a mixture of support powder and Ru3(CO)12 with the desired weight ratio was set in a well-evacuated silica tube and heated in an oven under the following programme: heating from room temperature to 40 °C (2 °C min−1) for 1 h, heating up to 70 °C (0.25 °C min−1) and holding for 1 h, heating up to 120 °C (0.4 °C min−1) and holding for another 1 h and finally heating up to 250 °C (0.9 °C min−1) and holding for 2 h. The samples were collected and stored in an Ar-filled glovebox after naturally cooling to the ambient temperature. The actual amount of loaded Ru NPs on the support was determined using an X-ray fluorescence spectrometer (XRF, S8 TIGER, Bruker) (Supplementary Fig. 18). The Ni/Ba3SiO5−xNyHz was prepared by heating a mixture of nickelocene and Ba3SiO5−xNyHz powder at 250 °C for 2 h in a gas flow of N2 (purity >99.99995%, 2 ml min−1) and H2 (purity >99.99999%, 6 ml min−1) under a pressure of 0.1 MPa. Ba3SiO5−xNyHz powder synthesized at 600 °C showed the highest activity when Ru was loaded and thus its structural and catalytic properties were investigated further. The catalytic activities of Ru/Ba(NH2)2 and Ru/SiO2 were negligibly low at 300 °C and so are not described in the main text.
Characterization
Powder X-ray diffraction (XRD) patterns of the samples were recorded on a diffractometer (D8 Advance, Bruker) with monochromatic Cu Kα radiation (λ = 1.5418 Å) at a voltage of 40 kV and a current of 40 mA. An X-ray transmitting capsule cell was used to avoid oxidation of the sample during the XRD measurements. The sample purity was determined by Rietveld analysis of the XRD pattern using the TOPAS code (Bruker AXS, version 4.2). Temperature-programmed desorption (TPD) experiments were performed on a catalyst analyser (BELCAT-A, MicrotracBEL). The sample (approximately 50 mg) was heated from room temperature to 950 °C with a heating rate of 10 °C min−1 in a stream of pure He gas (>99.99995%) with a flow rate of 30 ml min−1. The desorbed products during the heating process were monitored using a mass spectrometer (BELMass, MicrotracBEL). Calibration of the N2 (m/z = 28) and H2 (m/z = 2) mass peak areas was conducted by monitoring pulses of m/z = 28 and 2 more than five times to obtain average calibration data. The CO-pulse chemisorption experiment was conducted at 50 °C using a He flow (50 ml min−1) and pulses of 0.031 ml (10% CO in He) to evaluate the number of exposed Ru sites by using a catalyst analyser (BELCAT-A, MicrotracBEL). Prior to the experiment, the samples were pretreated with a H2 (5%)/Ar flow (50 ml min−1) at 400 °C for 60 min, followed by a He flow (50 ml min−1) at 400 °C for 15 min to remove hydrogen atoms adsorbed on the Ru surface. The lattice N3− ions cannot be totally desorbed by the heating treatment. Therefore, the actual amount of lattice N3− ions was further confirmed by an acid dissolution method accompanied by ion chromatography (Supplementary Fig. 45). Solid-state 1H MAS NMR and 29Si MAS NMR of Ba3SiO5 and Ba3SiO5−xNyHz were performed on a Bruker Biospin DSX-400 spectrometer (Bruker). The Q0 signal appears at lower magnetic field when O2− ions in the SiO4 tetrahedral unit are replaced with more electropositive H− and N3− ions27. Optical diffuse reflectance spectra were measured at room temperature with a spectrophotometer (U-4000, Hitachi) using MgO powder as a background. The Kubelka–Munk transformation was used to convert the measured spectra into absorption spectra. Electron paramagnetic resonance (EPR) measurements of the Ba3SiO5−xHyNz powder samples were conducted on a spectrometer (E580 X-band, Bruker) (approximately 9.7 GHz) at room temperature. Ru K-edge X-ray absorption fine structure (XAFS) measurements were performed on a synchrotron radiation ring at the NW-10A beamline (Photon Factory, KEK, Japan) using a Si(311) double-crystal monochromator and ionization chambers. A mixture of Ru/Ba3SiO5−xHyNz and dehydrated boron nitride powders was pressed into a pellet with a diameter of 10 mm and well-sealed in a polyethylene pack in an Ar-filled glovebox. The collected data were processed using the ATHENA software package. The filtered k3-weighted χ spectra were Fourier transformed into r space with a k range 3.0–16.0. High-angle annular dark-field-scanning transmission electron microscopy (HAADF-STEM) observations were conducted using a microscope (ARM-200F, JEOL) operated at 200 kV. The mean particle diameter and distribution of Ru NPs on the support were determined by measuring the size of 200 metal NPs in a STEM image. The specific surface area of the catalysts was determined by the analysis of N2 adsorption–desorption isotherms collected on a BELSORP-mini II (MicrotracBEL) at 77 K using the Brunauer–Emmett–Teller (BET) method. X-ray photoelectron spectroscopy (XPS) measurements were performed on a spectrometer (ESCA 3200, Shimadzu) using Mg Kα radiation at <10−6 Pa. The XPS spectra were calibrated with respect to the C 1s signal at 284.8 eV.
Iodometric titration method
First, 10–20 mg of Ba3SiO5−xNyHz heated at 650 °C in Ar was set in a glass vial with 1 ml of pure ethanol in an Ar-filled glove box. Then, 2 ml of I2 solution (5 mmol l−1) and 0.5 ml concentrated hydrochloric acid were added. After magnetic stirring to dissolve the powder, electrons in the sample were consumed by the reduction of I2 into I− ions. Then, the residual I2 was titrated using a standard sodium thiosulfate (Na2S2O3) solution (4 mmol l−1). To confirm the endpoint of the titration, a few drops of starch solution were added, which induced a violet colouration. The measurements were repeated three times to obtain an average value.
Ammonia synthesis reactions
Ammonia synthesis over various catalysts (0.1 g) was conducted in a stainless-steel reactor in a gas flow of N2 (purity >99.99995%, 15 ml min−1) and H2 (purity >99.99999%, 45 ml min−1) with a pressure of 0.9 MPa and under a steady-state temperature in the range 200–500 °C. The ammonia gas produced was trapped in a 5 mmol l−1 sulfuric acid solution to obtain NH4+ solution and the concentration of NH4+ was then monitored using ion chromatography (Prominence, Shimadzu) with a conductivity detector. All the catalysts were treated under the ammonia synthesis conditions at 400 °C for 20 h to remove surface carbon species that remained after the chemical vapour deposition processes for TM loading, as well as to reach a stable catalytic state. The apparent Ea of the measured catalysts was calculated from Arrhenius plots of the ammonia synthesis rates at different temperatures. To avoid the thermal equilibrium effect, the ammonia yield for Ea calculation was less than 20% of that at equilibrium. For comparison with the most active catalyst (Ba2RuH6/MgO) reported, we also measured the activity under similar experimental conditions (0.03 g catalyst, 1.0 MPa).
Kinetic analysis
The reaction orders of N2 (α), H2 (β) and NH3 (γ) were measured at a steady-state temperature of 340 °C and pressure of 0.9 MPa with a weight hourly space velocity (WHSV) of 36,000 ml g−1 h−1. The activity of the catalysts measured under these conditions was far from the thermal equilibrium to avoid the effects of thermodynamic limits. Calculation of the ammonia synthesis rate (r) was based on equation (1), while equations (2)–(5) were used for the kinetic analysis.
where r, W, y0, q and (1−m) represent the NH3 synthesis rate, the catalyst weight, the outlet NH3 mole fraction, the total volume flow rate and the reaction order with respect to NH3 (γ), respectively. k and k2 are the rate constants. Finally, the α and β parameters can be determined by plotting the logarithm of a constant within the limited range q (C) versus the partial pressure of N2 (PN2) or H2 (PH2).
Isotope-labelled experiment and isotopic N2 exchange measurement
Ammonia syntheses over Ru/Ba3SiO5−xNyHz and conventional Ru/MgO from heavy 15N2 (purity 98%) and H2 were performed in a closed U-shaped glass circulation reactor connected to a gas chromatograph (GC, GC-8A, Shimadzu) with a Chromosorb 103 column and a quadrupole mass spectrometer (M-101QA-TDM, Canon Anelva) using He as the carrier gas. Before the reaction, the catalyst set in the closed glass circulation reactor was evacuated using a vacuum pump with a liquid nitrogen trap to remove the adsorbed water on the catalyst. The mixture of 15N2 (15.0 kPa) and H2 (45.0 kPa) gases was introduced into the glass reactor and kept circulating using an electromagnetic drive gas circulator. The catalyst (0.1 g) set in the system was heated at 400 °C. The gases produced were abstracted with a gas-sampling loop and flushed out with He gas (0.1 MPa) and then injected into the GC. The outlet gases from the GC were then analysed using the quadrupole mass spectrometer and the corresponding masses of m/z = 2, 16, 17, 18, 28, 29 and 30 were monitored as a function of time. The isotope N2 exchange experiments were conducted using the same system. A mixed gas flow of 15N2 (4 kPa) and 14N2 (16 kPa) was introduced and circulated in the system over the catalyst (0.1 g) heated at 400 °C and the mass signals of m/z = 28, 29 and 30 were monitored with respect to the reaction time. The influence of H2O for this measurement can be ignored because the mass signal of m/z = 18 was not increased with reaction time when 15N2 was replaced with 14N2 (Supplementary Fig. 29).
DRIFTS of N2 absorption experiments
All the samples for DRIFTS of N2 absorption analysis were pretreated under the ammonia synthesis conditions for 20 h. To confirm the role of Va sites in N2 activation, both Ba3SiO5−xNyHz and Ru/Ba3SiO5−xNyHz catalysts were heated at 650 °C under an Ar atmosphere before the DRIFTS measurements. The powder samples were placed in an alumina sample cup and introduced into a stainless-steel heat chamber equipped with a KBr window (STJ-0123-HP-LTV, S.T. Japan). The samples were heated to above 400 °C in an Ar flow (10 ml min−1) for 5 h to remove surface adsorbed species and were then well evacuated. After the pretreatment, the samples were cooled to −170 °C under vacuum to obtain a background spectrum. The catalysts were then exposed to pure 14N2 (99.99995%) or heavy 15N2 (98%) to collect infrared spectra for adsorbed N2. The infrared spectra were measured using a spectrometer (IRTracer-100, Shimadzu) equipped with a mercury–cadmium–tellurium (MCT) detector at a resolution of 4 cm−1.
In situ DRIFTS observations
The powder samples were placed in an alumina sample cup and introduced into a stainless-steel heat chamber equipped with a BaF2 window (160-1147, S.T. Japan). The samples were placed under a flow of 14N2 (or 15N2) (3 ml min−1) and H2 (or D2) (9 ml min−1) at 30 °C for 1 h and the spectra were measured as the background spectra (Supplementary Fig. 37a). Then the sample was gradually heated from 30 to 300 °C and the spectra at different reaction temperatures were recorded on a spectrometer (FT/IR-6XV, JASCO) equipped with a mercury–cadmium–tellurium (MCT) detector at a resolution of 0.25 cm−1. Figure 4c shows the difference spectra using the spectra measured at 30 °C under the same reaction gas atmosphere as the background spectra (Supplementary Fig. 37a). The band at 1,424 cm−1 due to the v(15N=14N) is also observed, which may be caused by the recombination of lattice 14N and 15N in Ba3SiO5−xNyHz at the elevated temperature.
DFT calculations
All structure relaxation and electronic structure calculations were performed using the DFT method as implemented in the Vienna ab initio simulation package (VASP)47. The calculation settings of 600 eV cutoff energy and Γ-centred k-points with a mesh resolution of 2 × 0.04 Å were adopted for all structures. To obtain the total energy, the possible structures were fully relaxed using the Perdew–Burke–Ernzerhof (PBE) functional with the projector augmented wave (PAW) method until the convergence criteria of energy and force were met (less than 1.0 × 10⁻⁶ eV and 1.0 × 10⁻² eV Å−1, respectively)48. On the basis of the chemical stoichiometry determined by the experiments, the computational models Ba3SiO5−2xNxHx (N–H pair replaces O–O pair), Ba3SiO5−yH2y (H–H pair replaces oxygen) and Ba3SiO5−2x−yNxHx+2y (N–H pair replaces O–O pair with an extra H–H pair) were derived from the optimized Ba3SiO5 primitive cell. As for the H–H pair, two hydrogen atoms were placed at one oxygen site with the H–H distance set to approximately 0.8 Å for charge compensation. Among all the computation models listed in Supplementary Tables 2-4, the computation model of Ba3SiO5−2x−yNxHx+2y with x = 1 and y = 0.5 (that is Ba3SiO2.5NH2) well reproduces the experimental result (Supplementary Table 1) and therefore, it was selected as a benchmarking computational model for further reaction pathway calculations. The density of states of the Ba3SiO2.5NH2 system was calculated using the tetrahedron method with a Γ-centred k-point mesh of 7 × 7 × 4. The atom-projected densities of states were evaluated with Wigner–Seitz radii (R_WS) of 1.62 Å satisfying R_WS = (3Vcell/4πN)1/3, where Vcell is the unit cell volume (682.89 Å3) and N is the number of total atoms in the unit cell (N = 38). The calculation settings of 400 eV cutoff energy and a Monkhorst–Pack mesh k-point grid of 2 × 2 × 1 were adopted for surface structures. The bottom two layers were fixed for the slab model. The Ba3SiO2NH2(001) surface is the most stable among the low-index surfaces calculated using the DFT method. At the (001) surface, SiO2NH units are preferentially exposed over Ba6H2 units. Therefore, the anion vacancy site is formed at SiO2NH units on the Ba3SiO2NH2(001) surface in our simulation. The convergence criteria were set as 1.0 × 10⁻⁵ eV in energy and <1.0 × 10⁻² eV Å−1 in force for the structure relation (1.0 × 10⁻⁵ eV in energy and <5.0 × 10⁻² eV Å−1 in force for intermediates and transition state structures in the climbing image nudged elastic band method49,50, reaction path analysis). These calculation conditions are almost the same as those in the previously reported work for the simulation of catalytic ammonia synthesis51.

Responses