Unequal roles of cities in the intercity healthcare system
Main
Cities are increasingly important in shaping people’s health outcomes1. Not only are they often the epicenters of disease origins and transmissions2,3, but they are also crucial in delivering healthcare services4. Although cities have long been recognized as providers of healthcare to their local populations4, there is a growing trend of people seeking healthcare outside their residence cities5,6. Under the fast urbanization, the scarcity and uneven distribution of healthcare services, particularly high-quality ones, is common and causes the worldwide patient mobility between cities, regions and national jurisdictions5,6,7, as found in the USA, Turkey, Italy, Iran, Laos, Thailand, India and China7,8,9,10,11,12. Cities have thus developed the function of providing healthcare to nonlocal patients who reside in other cities. The resulting interdependence of healthcare provision and demand among cities indicates the formation of what we term an intercity healthcare system (IHS) (Fig. 1).
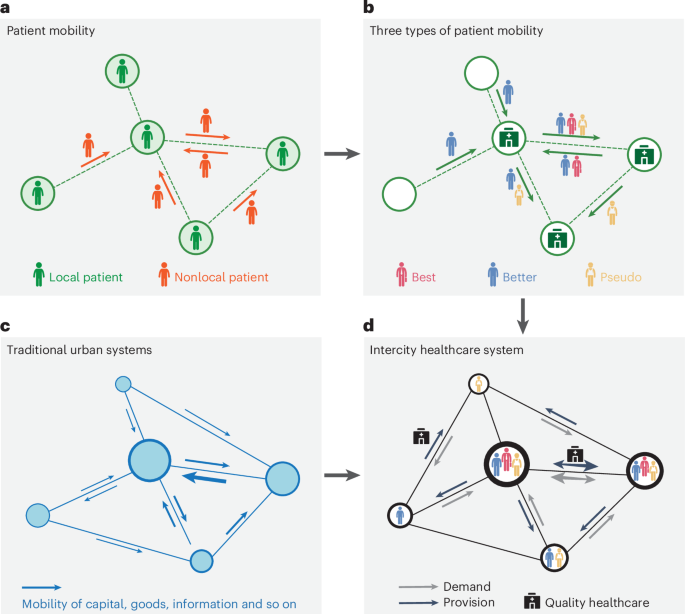
a, The dichotomy of local and nonlocal patients. b, Three types of patient mobility with different purposes. ‘Best’, mobility for the best treatment/diagnosis; ‘Better’, mobility for better treatment and diagnosis; ‘Pseudo’, pseudo patient mobility. c, The urban system formed through the mobility of capital, goods, information and so on. d, The IHS formed through three types of patient mobility.
The IHS can be explored through the lens of patient mobility6,7,8. Previous studies have examined which groups obtain healthcare not from their residence cities and why6,10, as well as the size, networks and temporal–geographical patterns of patient mobility11,12. Early studies considered patient mobility detrimental to healthcare access equity by exposing social disparities in the ability to travel for healthcare5,6 and the underlying multiple purposes, which range from the wealthy population’s desire for the best treatment and diagnosis to the deprived populations’ needs for better or even basic ones6. Recent studies have pivoted to understand patient mobility as conducive to the improvement of healthcare efficiency and equity, in particular, repairing the spatial mismatch of healthcare provision and demand7. This shift guides the current policy framework toward encouraging patient mobility. For instance, the European Union launched a directive to secure patients’ rights to utilize healthcare in other European Union countries13; China launched national reforms to remove the institutional barriers to cross-city healthcare utilization and announced a regional healthcare center plan to encourage patients’ trips to nearby hub cities with adequate healthcare14.
Nevertheless, how patient mobility with different purposes forms an IHS and the role of cities in it are yet to be fully explored. Three key questions remain unsettled: (1) How can the features of an IHS be identified through patient mobility? (2) What roles do the cities play in the IHS? and (3) How unequal are the roles of cities regarding benefits gained from the IHS?
Leveraging the emerging human mobility big data15,16,17, this study answers the research questions and reveals the IHS in China. Three interrelated analyses constitute our inquiry (Supplementary Fig. 1). First, we identify the visits of nearly 2 million nonlocal patients to 1,404 first-class hospitals from the daily movements of over 300 million cell phone users in China and discern three types of patient mobility according to the purpose, in particular, including the pseudo patient mobility, which refers to the temporary return of migrant workers from megacities to healthcare-deprived home cities for treatment and diagnosis. We use the term ‘pseudo’ to describe this patient mobility, drawing from ‘pseudo-urbanization’, which is widely used to depict the insufficient supply of infrastructure, public services and social welfare amid the rapid concentration of migrant labor in urban areas. Second, based on a full picture of nationwide patient mobility, we classify the roles of Chinese cities in providing and demanding healthcare. Third, we examine the interdependence among cities regarding healthcare provision and demand and reveal the hidden benefit structure regarding how cities exploit the IHS to offset or strengthen their structural (dis)advantages in local healthcare provision.
The importance of this study is threefold. First, we harness the potential of human mobility big data to discover the features of IHS by delivering a full picture of nationwide patient mobility, thereby supplementing existing studies that use incomplete healthcare records and questionnaire surveys11,18. Second, we offer insights into the horizontal diversification of cities’ roles in urban systems under fast population mobility, that is, intercity healthcare provision versus demand roles. It thus extends the current focus of urban system studies beyond focusing solely on economic interdependence and hierarchy19,20,21. Third, we deepen the understanding of healthcare access equity by combining cities’ dual roles to reveal the benefit structure of the IHS, providing valuable implications for planning healthcare resources, whereas previous studies have addressed the issue mainly from individual affordability, accessibility, capability, hospital locations and community contexts22,23,24,25.
Results
Three types of patient mobility interweave to form an IHS
We proposed a method to more fully identify cross-city healthcare utilization (Methods) and found that three types of patient mobility interweave to form an IHS (Fig. 2a). Primarily, mobility for better treatment and diagnosis accounts for 76% of all cross-city healthcare utilization, and only 5% is for the best treatment and diagnosis. The pseudo mobility of migrant workers accounts for 19%; they return to their healthcare-deprived home cities for treatment and diagnosis owing to being excluded from the healthcare welfare system in the megacities26 or a lack of family support27 and familiarity with healthcare providers in the megacities28. In China, the hukou (household registration) system and the multilayered and municipally administered healthcare insurance system deny migrant workers’ full rights to local healthcare welfare12,29 (Supplementary Note 4), and over 380 million of the population are migrant workers who often live in the megacities separately from their families30.
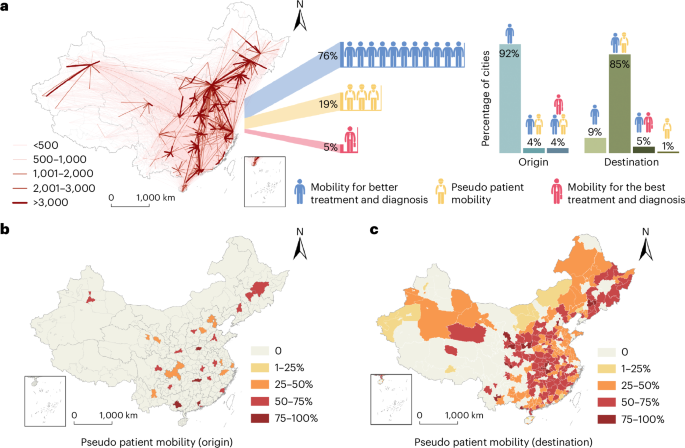
a, The percentage of three types of patient mobility in total, and the percentage of cities that have different types of patient mobility as origins and destinations. b, The percentage of pseudo patient mobility in outflowing patients of origin cities. c, The percentage of pseudo patient mobility in inflowing patients of destination cities.
Cities are not equally involved in the IHS as the origins and destinations of patient mobility (Fig. 2a,b); 92% of 364 Chinese cities (336) are the origin only of the mobility for better treatment and diagnosis, while 13 cities are the origin of both the mobility for better treatment and diagnosis and pseudo mobility. Only 15 cities (4%) are the origin of all three types of mobility; these are often China’s most developed cities, including Beijing, Shanghai and Shenzhen.
Only 273 cities act as destinations of patient mobility, among which 24 cities host only the mobility for better treatment and diagnosis. Two cities host only the pseudo patient mobility, 15 cities (5%) host both the mobility for the best and for better treatment and diagnosis, while the other 232 cities (85%) host both the mobility for better treatment and diagnosis and pseudo patient mobility. Notably, cities with over 50% of hosted mobility as the pseudo patient mobility are mainly provinces in the middle of China, including Hubei, Hunan and Jiangxi (Fig. 2c), where the amount of outflowing migrant workers is among the highest in China.
Role of cities in intercity healthcare provision
To discern the role of cities in intercity healthcare provision, we cluster the 273 cities into four types according to the size and type of patients they host and other city attributes related to healthcare provision to nonlocal patients (Methods). Type A cities exhibit the highest number of nonlocal patient origins (mean 235, P < 1%; Fig. 3b), generating the largest catchment area and serving the highest number of nonlocal patients (mean 53,362; Fig. 3c). The 13 type A cities provide 35% of all the intercity healthcare resources, meeting the needs for the best (mean ratio 15%) and better (mean ratio 85%) treatment and diagnosis (Fig. 3g). Both the abundance in quality healthcare and high transport accessibility (Fig. 3d,e) determine type A cities’ uppermost attractiveness to nonlocal patients. Hence, we refer to type A cities as national healthcare hubs, as exemplified by Beijing, Shanghai and Chengdu.
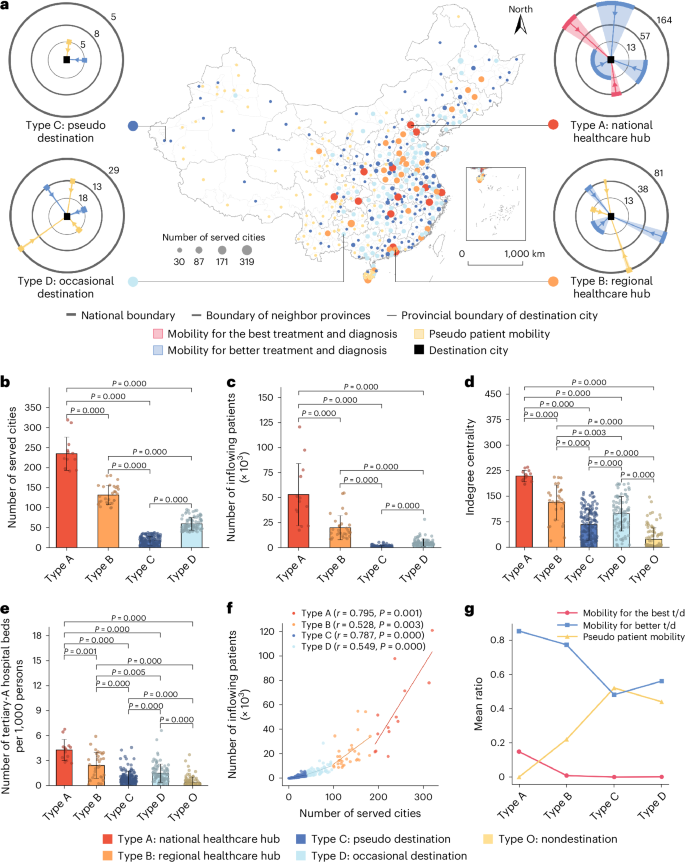
a, The spatial distribution of cities with types A and B mostly located in East China. The four conceptual graphs: the angle of each fan with an inward arrow indicates the average volume of inflowing nonlocal patients, and the number on each circle indicates the average number of served cities at the corresponding spatial scale. The number of cities is 13 for type A, 30 for type B, 141 for type C, 89 for type D and 91 for type O. b, The number of served cities. c, The number of inflowing patients. d, Transport accessibility measured by indegree centrality of cities in national railway networks. e, The capability of quality healthcare measured by the number of tertiary-A hospital beds per 1,000 persons. f, The relationship between the number of served cities and the number of inflowing patients. g, The average ratio of the three types of patient mobility in the four types of cities (‘t/d’ refers to ‘treatment and diagnosis’). A Shapiro–Wilk test is used for normality testing, and not all the variables for each type of cities are normally distributed. In b–e, the included P values correspond to two-sided Mann–Whitney tests for each comparison between different types. The error bars represent the standard deviation, and the center values correspond to the means, which are the height of the bars.
Type B cities exhibit the second-highest diversification of nonlocal patient origin cities (mean 132). They serve a considerable but much lower number of nonlocal patients than do type A cities (mean 20,387, P < 1%). Having fewer quality healthcare services than type A cities (P < 1%), type B cities attract a lower ratio of nonlocal patients from nonadjacent provinces (Supplementary Fig. 5a). Rather than serving a nationwide catchment area, type B cities serve the nearby cities of their own and adjacent provinces and mainly meet the needs for better treatment and diagnosis (mean ratio 77%). Hence, we refer to type B cities as regional healthcare hubs, as exemplified by Kunming, Shenyang and Fuzhou.
Type C cities exhibit the lowest number of nonlocal patients (mean 1,268) and the fewest patient origin cities (mean 18; Fig. 3f). With the least richness of quality healthcare, type C cities attract few nonlocal patients, and the majority of the nonlocal patients they do serve are returning migrant workers (mean ratio 52%) from the province’s capital city. After excluding pseudo patient mobility, the number of origin cities of nonlocal patients served by type C cities is minimal (Supplementary Fig. 6a,c). Hence, we refer to type C cities as pseudo patient destinations.
Type D cities differ from type C cities by having a higher number of nonlocal patients (mean 5,623, P < 1%) and origin cities (mean 60, P < 1%). They provide healthcare to meet the needs for better treatment and diagnosis (mean ratio 56%) and of returning migrant workers (mean ratio 44%). In contrast to type C cities, returning patients in type D cities come from a variety of megacities rather than mainly from their own provincial capital city (Supplementary Fig. 6c,d). After excluding pseudo patient mobility, type D cities serve a much smaller number of nonlocal patients than type B cities (Supplementary Fig. 6b). Hence, we refer to type D cities as occasional destinations with a very limited function of serving nonlocal patients.
Type O cities do not serve any nonlocal patients. The poorest transport accessibility and the lack of quality healthcare mean that such cities are rarely a destination for nonlocal patients, even if they have outflowing migrant workers. Type O cities are often remote cities near border regions (Fig. 3a).
Figure 3a conceptualizes the four types of cities regarding the function of intercity healthcare provision. With substantial catchment areas constitutive of a wide range of cities, type A and B cities have a real function of serving other cities that lack quality healthcare; they account for 12% of Chinese cities (13 and 30, respectively). Accounting for 63% of Chinese cities (141 and 89, respectively), type C and D cities host mainly the returning migrants and occasional visits from nonlocal patients with few functions of serving nearby cities.
Role of cities in intercity healthcare demand
We use the same clustering method to discern the role of cities in intercity healthcare demand (Methods), with four types of cities classified. Type 1 cities exhibit the highest number of outflowing patients (mean 33,097, P < 1%; Supplementary Fig. 7a), and the patients go the farthest (mean 660 km; Fig. 4c) to reach the greatest diversification of destinations for healthcare (mean 176, P < 1%; Fig. 4b). On average, 59% of the patients go outside their province (Supplementary Fig. 8a). Type 1 cities are often the developed megacities, which are the richest in quality healthcare (Fig. 4e), and the populations’ education conditions and social networks are also the best, allowing the residents to know the best physicians and hospitals in other cities for treating their illnesses10,31. After excluding pseudo mobility, almost half of their outflowing patients (mean ratio 49%) travel to obtain the best treatment and diagnosis (Supplementary Fig. 9a). This suggests that the residents in type 1 cities are mobile nationwide to obtain the best diagnosis and treatment.
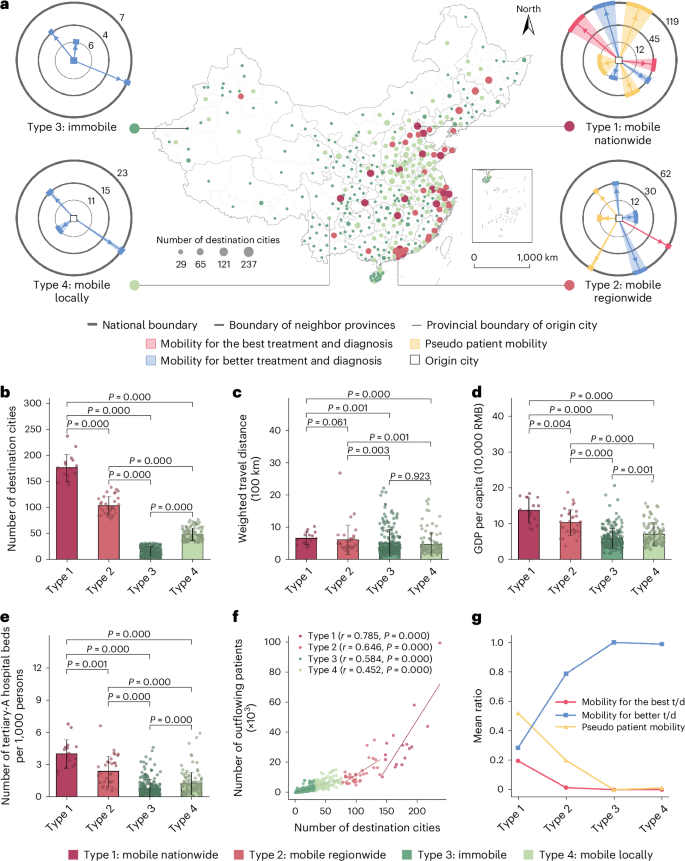
a, The spatial distribution of cities with types 1 and 2 mostly located in East China. The four conceptual graphs: the angle of each fan with an outward arrow indicates the average volume of outflowing nonlocal patients, and the number on each circle indicates the average number of destination cities at the corresponding spatial scale. The number of cities is 16 for type 1, 33 for type 2, 203 for type 3 and 112 for type 4. b, The number of destination cities. c, The weighted travel distance of outflowing patients. d, The GDP per capita. RMB, renminbi. e, The number of tertiary-A hospital beds per 1,000 persons. f, The relationship between the number of destination cities and the number of outflowing patients. g, The average ratio of the three types of patient mobility in the four types of cities (‘t/d’ refers to ‘treatment and diagnosis’). A Shapiro–Wilk test is used for normality testing, and not all the variables for each type of cities are normally distributed. In b–e, the included P values correspond to two-sided Mann–Whitney tests for each comparison between different types. The error bars represent the standard deviation, and the center values correspond to the means, which are the height of the bars.
Type 2 cities exhibit the second-highest number of outflowing patients, but this number is still much lower than for type 1 cities (mean 12,610, P < 1%). The same is true of the diversification of destinations (mean 103). On average, about 42% of the outflowing patients from type 2 cities go outside their province to seek quality healthcare. Even though type 2 cities are relatively rich in local healthcare (Fig. 4e), the majority of their outflowing patients pursue better treatment and diagnosis outward (mean ratio 78%). Only one-third of type 2 cities have pseudo patient outflows, as they are not the major host cities of migrant workers. Type 2 cities are often medium-sized cities in the developed eastern coastal region that have good transport accessibility and economic conditions, so their residents can travel to reach nearby healthcare-rich cities (Fig. 4d and Supplementary Fig. 7b). This suggests that the residents in type 2 cities are mobile regionwide for better diagnosis and treatment.
Type 3 cities exhibit a minimal number of outflowing patients (mean 1,858) and destinations (mean 16; Fig. 4f), and only 25% of the patients go outside their province (Supplementary Fig. 8a) to several cities in nearby provinces (mean 11). Type 3 cities are the most deprived of quality healthcare (Fig. 4e), while the worst transport accessibility and economic conditions limit the residents’ ability to travel far and wide to obtain healthcare. Type 3 cities are often small cities in the less developed western inland region (Fig. 4a). This indicates that the residents in type 3 cities are immobile regarding obtaining better diagnosis and treatment.
Type 4 cities differ from type 3 cities in having a higher percentage of outflowing patients going beyond the province boundary (mean ratio 35%) and a higher number of destinations (mean 48, P < 1%). The much better transport accessibility (P < 1%) enables the residents of type 4 cities to travel to more nearby healthcare-rich cities, although they suffer from poor economic conditions and a shortage of quality healthcare similar to type 3 cities. They are often small cities in central and coastal China. This indicates that the residents in type 4 cities are mobile locally to obtain better diagnosis and treatment (Fig. 4g).
Figure 4a conceptualizes the four types of cities regarding the function of intercity healthcare demand. Accounting for only 4% of Chinese cities, type 1 cities create 27% of the intercity healthcare demand, among which most is for the best diagnosis and treatment by their residents moving nationwide. Not rich in quality healthcare and accounting for 9% of Chinese cities, type 2 cities demand 20% of the intercity healthcare resources by their residents traveling regionwide for better diagnosis and treatment. The remaining 87% of cities are type 3 and 4 cities, which demand 53% of the intercity healthcare resources (Fig. 5).
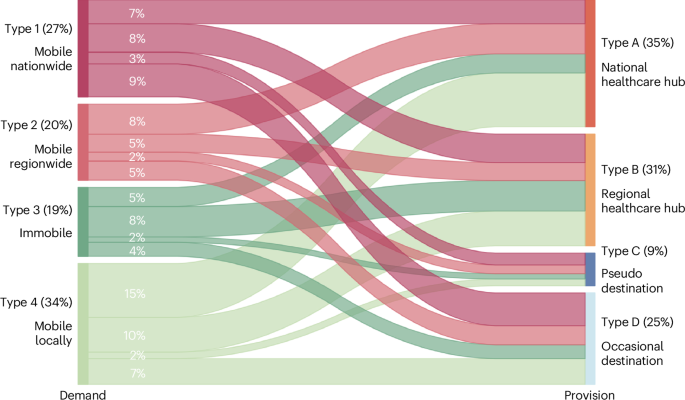
The numbers in brackets refer to the percentage of cross-city healthcare utilization of the corresponding type.
Interdependent function and the benefit structure
The patient flows among different types of cities reflect the interdependency between the healthcare provision and demand cities, with flow size indicating intensity of interaction (Fig. 5). National hub cities serve type 4 cities the most (15%) rather than the most disadvantaged type 3 cities, indicating that accessibility to healthcare-rich cities offsets the local shortage of healthcare. Meanwhile, regional hub cities provide healthcare substantially to both type 3 and 4 cities. The advantaged type 1 cities depend substantially on occasional destination cities to provide healthcare to their residents (9%). One possible reason is that type 1 cities, mostly China’s first-tier megacities, have a concentration of jobs involving frequent traveling32. Therefore, they generate healthcare demands during business trips to a wide range of cities33,34. It is notable that the unnoticed pseudo destination cities function to serve the advantaged type 1 and 2 cities, which host the majority of China’s migrant workers.
We discern the benefit structure of the IHS by examining the dual roles of cities. Combining the provision and demand roles yields nine compound modes involving more than three cities (Fig. 6a). For each city, we consider (1) the sufficiency of local healthcare provision for the local population and (2) the ability to obtain intercity healthcare provision for the local population. As a city both gains and loses healthcare resources within the IHS, we measure each city’s relative gains of intercity healthcare resources (Methods). The results indicate significant differences in the two attributes among different compound modes (Fig. 6b,c). Accordingly, we infer which compound modes benefit from the IHS regarding ensuring healthcare provision to the local population.
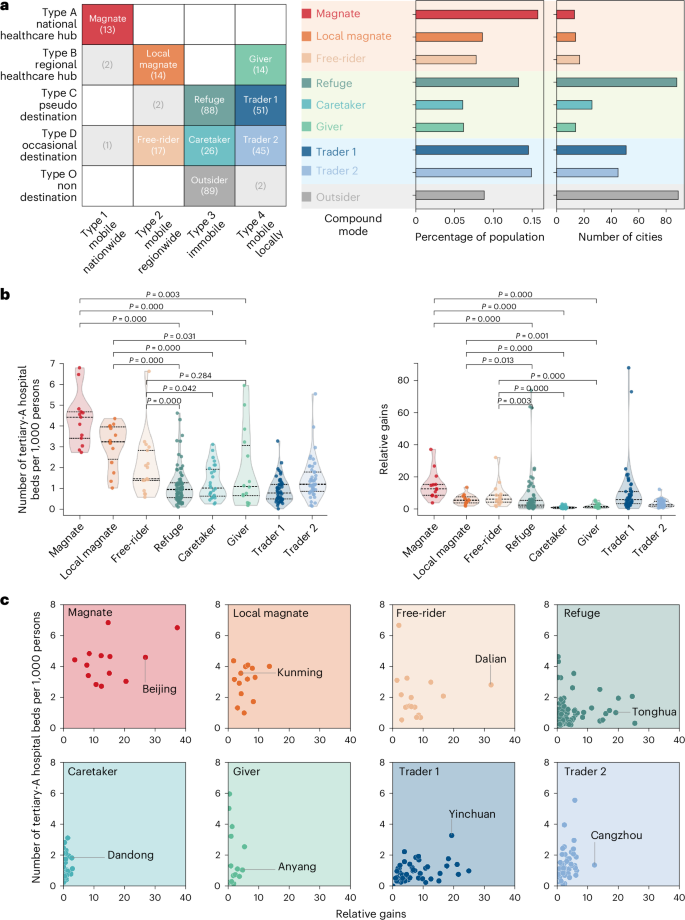
a, Nine compound modes combining the provision and demand roles. The numbers in the brackets refer to the number of cities at each junction. b, The sufficiency of local healthcare provision to the local population measured by the number of tertiary-A hospital beds per 1,000 persons (left), and the ability to obtain intercity healthcare provision to the local population measured by the relative gains of each mode under the IHS (right). A Shapiro–Wilk test is used for normality testing, and not all the variables for each mode of cities are normally distributed. The included P values in b correspond to two-sided Mann–Whitney tests for each comparison between different modes. c, The relationship of each mode between the sufficiency of local healthcare provision and the ability to obtain intercity healthcare provision.
Referring to Fig. 6a, cities at the junction of type A and type 1 are labeled as magnates, which means that they have rich healthcare resources while leveraging the nationwide IHS to further strengthen local healthcare provision. Accordingly, cities at the junction of type B and type 2 are local magnates. They benefit less from the IHS and depend mainly on a regional base. We describe cities at the junction of type D and type 2 as free-riders in that they do not contribute local resources to the IHS while obtaining intercity resources to compensate for the local shortage of quality healthcare.
We refer to cities at the junction of type C and type 4 as traders, which means that they offer local resources to remediate the megacities’ supply deficiency in meeting the healthcare needs of migrant workers, while obtaining intercity resources to serve local residents. They thus exchange benefits with other cities in the IHS. Similarly, cities at the junction of type D and type 4 are also traders that exchange their service function of meeting occasional healthcare demand from megacities for the supply to their local populations.
By contrast, refuges, which refers to cities at the junction of type C and type 3, can scarcely benefit from the IHS; they do not obtain intercity resources to offset their shortage of supply to the local population while providing substantially local resources to returning migrant workers. At the junction of type D and type 3, caretakers are also disadvantaged in the IHS. They do not obtain additional supply from other cities to serve local populations while providing the scarce local resources to meet the occasional healthcare demand from megacities. Givers are cities at the junction of type B and type 4, which share self-sufficient local resources with nearby cities but obtain few resources from the IHS.
In total, magnates, local magnates and free-riders constitute the winners of the IHS, respectively accounting for 4%, 4% and 5% of Chinese cities and accommodate 16%, 8% and 8% of the Chinese population. On the other side are refuges, caretakers and givers, which respectively account for 24%, 7% and 4% of Chinese cities and accommodate 13%, 6% and 6% of the Chinese population. Traders (27%) are in an ambiguous position in the benefit structure. Interestingly, 24% of the cities are at the junction of type O and type 3; they accommodate 9% of the population of China and are outsiders, as they demand little from the IHS and provide nothing in return. The results point toward a Matthew effect of accumulated advantage. The cities rich in local healthcare provision get richer through the IHS.
Discussion
Studies on patient mobility have informed policymaking on how to improve healthcare efficiency and equity. However, the IHS behind the growing and diverse patient mobility remains insufficiently understood. This Article addresses the knowledge gap by utilizing human mobility big data to establish a typology of roles of Chinese cities based on their functions in providing and demanding intercity healthcare resources. Moreover, it reveals the benefit structure of the IHS, emphasizing the imbalanced intercity dependence. The study draws three significant conclusions.
First, the interweaving of three types of patient mobility in cities shapes the IHS. The pseudo patient mobility by migrant workers is highlighted, which adds complexity to the role of cities in providing and demanding healthcare. The fast yet unequal urbanization in China and other developing countries8,9,10,11,12, which involves massive labor flows into a few megacities and the institutional exclusion of migrant workers from the urban welfare system, poses significant challenges to ensuring equal rights to adequate healthcare. Pseudo patient mobility not only reflects the unfair urbanization but also highlights the unjust exploitation of healthcare resources in less developed cities to sustain the economy and labor regime of developed megacities.
Second, cities’ roles show distinct disparities regarding intercity healthcare provision and demand. A small proportion (8%) of cities, specifically national and regional hubs, play a role in addressing the healthcare shortage in other cities, while a majority (63%) of cities compensate for the healthcare rights migrant workers are denied in megacities. However, China’s current national healthcare reform focuses primarily on strengthening the function of regional hub cities, thus overlooking the importance of pseudo destination cities in promoting equity in healthcare access. The study suggests that the unnoticed pseudo destination cities should receive attention and investments to enhance their function. This is crucial considering the uneven urbanization pattern in China and the institutionalized spatial mismatch between work and welfare provision for migrant workers.
Third, cities are involved unequally in the IHS. The IHS exhibits a Matthew effect, where a few already advantaged cities benefit more and can strengthen their structural advantages in meeting healthcare demand of the local population. By contrast, the many cities (35%), while facing healthcare shortages, are further disadvantaged in ensuring adequate healthcare for their local populations. Although the IHS offers the potential for compensating and supplementing the local healthcare provision, the already advantaged cities take greater advantage of this opportunity, especially in relation to providing healthcare for migrant workers. Accordingly, the IHS generates new structural inequalities in healthcare access while addressing the spatial mismatch between healthcare provision and demand. Policies aimed at enhancing healthcare access equity should consider improving the benefit structure of the system toward more balanced configurations, such as by the development of more regional hub cities near the disadvantaged cities. This helps to improve the position of disadvantaged cities, including refuges, caretakers and givers, to more advantaged ones, such as traders.
The Matthew effect suggests that the imbalanced healthcare distribution model, that is, the concentration of resources in a few megacities to pursue agglomeration effects, may reduce healthcare efficiency. It can cause an overconcentration of welfare effects in a few megacities, leading to massive inflows of patients and populations, hospital and urban congestions, and other agglomeration diseconomies effects. It may further harm healthcare equity, as only the citizens of the advantaged megacities and the few populations with high mobility capability can enjoy the welfare effects of the healthcare system more fully. Hence, the Matthew effect supports China’s ongoing national healthcare reform toward decentralization of quality healthcare resources from a few megacities (for example, regional medical center plan).
While providing a new perspective of urban system to tackle equity in healthcare access, this study enhances our understanding of the vertical (function beyond job creation and economic agglomeration) and the horizontal (interdependent function between cities) extension of cities’ roles in urban systems. Manuel Castells35 introduced the concept of space of flows to redefine a place as a nexus of flows of people, capital, goods and information. Cities develop interdependent functions upon these flows36. Previous studies have focused on how intercity economic flows interweave to form an urban system and to shape the global cities as centers of economic command and control19,21. However, our study reveals that cities also extend their functions to provide or demand healthcare mutually alongside the increasing mobility of populations seeking healthcare. The study highlights the interconnectedness of healthcare provision and demand within the urban system, emphasizing the importance of understanding cities’ extended roles beyond economic functions.
Although the main aim of this research is to reveal the role of cities in the IHS, information about disease types would provide valuable insights into the specific roles of cities in specialty care. Patients with different diseases exhibit different healthcare-seeking behaviors and preferences for healthcare providers, along with varying sensitivities to travel distance, time and cost37,38,39. The human mobility big data approach used in this research is limited in differentiating patient mobility by disease type.
Methods
Data on human mobility
Cell phones communicate with transceivers regularly, and the communication log can be used to decipher the locations and moving trajectories of users at a full temporal coverage40. In this study, we used a set of cell phone-user trajectory data collected between 1 and 31 December 2022 from China Unicom, which is one of China’s top three telecom companies whose cell phone users account for about 20% of the market share in China41. The data cover over 300 million cell phone users in China during the study period. No individual-level attributes are available in the dataset, and all trajectories are aggregated at the city level. This study is exempt from institutional review board review at Peking University according to the Human Research Protection Program.
Data on location and areas of hospitals
In China, patients travel mainly for quality healthcare rather than basic healthcare12,42,43. We thus include the nonlocal patients’ visits to the top hospitals in the analysis. In China, tertiary-A hospitals are officially recognized by the Chinese government as the hospitals offering the highest-quality healthcare12. Hence, in this study, patient mobility is calculated as a patient’s movement to utilize the healthcare of a tertiary-A hospital located in a city other than the patient’s city of residence. A list of tertiary-A hospitals was provided by the National Health Commission of the People’s Republic of China in 2022, which is the highest authority in charge of China’s national healthcare system. In total, 1,404 tertiary-A hospitals were included. We searched the location of each tertiary-A hospital on Baidu map (https://map.baidu.com/) and collected the area-of-interest (AOI) data of each tertiary-A hospital using a web crawler.
Data on locational attributes of cities
The analyses of this study involve the data on cities’ attributes related to cross-city healthcare utilization. For the local healthcare provision level, the number of hospital beds is widely used as a measure9,12, and we collected the data from official website of each hospital. We measured the local economic development level by the annual gross domestic product (GDP) of 2022 and collected the data from China Statistical Yearbook (https://www.stats.gov.cn). We measured local transportation accessibility by the degree centrality of cities in national railway networks and collected the data from the online ticketing system of China’s railways administration (https://www.12306.cn/index/).
Patient mobility identification
We used a three-step analysis (Supplementary Fig. 14) to identify patient mobility from the trajectory data and AOI data: (1) a residence city is calculated as the city in which a cell phone user had the longest stop during nighttime (from 21:00 to 8:00) over the previous 12 months; (2) a cross-city healthcare utilization is calculated as a cell phone user’s visit to the area of a tertiary-A hospital not in the residence city, and the stay in the area of the tertiary-A hospital was over 30 min; and (3) a nonlocal patient is defined as a cell phone user who visited and stayed in the area of a tertiary-A hospital not in the residence city for over 30 min. The threshold of a 30 min stay in the area of a hospital is determined on the basis of a survey of Chinese public tertiary hospitals that indicates that the shortest waiting time of patients in hospitals is about 30 min (ref. 44).
Finally, we identified almost 19 million (18,993,351) visits to 1,404 tertiary-A hospitals in China from over 300 million cell phone users’ daily movements generated in December 2022, among which 1,984,448 were cross-city healthcare utilizations made by nonlocal patients.
Classifying patient mobility based on purpose
According to the literature, there are three main types of patient mobility in China, and we used a three-step method to identify them (Supplementary Fig. 15). The first follows the classical pull–push theory of amenity-driven migration45 whereby a patient travels to another city for better treatment and diagnosis. Accordingly, we calculate the patient mobility from the residence city to a city richer in quality healthcare as the mobility for better treatment and diagnosis.
The second is when a patient travels to another city for the best treatment and diagnosis, which is common especially among the wealthy populations6. We thus calculate the patient mobility from a residence city that is the richest in quality healthcare to another city that is also the richest in quality healthcare as the mobility for the best treatment and diagnosis.
The third is when a migrant worker returns from the city where they work and reside to their home city for healthcare, and the home city is less rich in healthcare resources than the host city, which is inconsistent with the push–pull theory8. This emerged especially in developing countries that have fast and uneven urbanization. China’s urbanization since the 1990s was characterized by the inflow of massive populations from villages, towns and small cities to megacities for job opportunities46, while the migrant workers have largely been excluded from the megacities’ social welfare system including the healthcare insurance system26. Thus, migrant workers return to the home city for healthcare during holidays and work leave27.
The 4 first-tier cities (that is, Beijing, Shanghai, Shenzhen and Guangzhou), another 2 municipalities directly under the central government (that is, Tianjin and Chongqing) and 22 provincial capital cities (excluding Haikou, Yinchuan, Lhasa and Hohhot), where over 110 million of the migrant workers are concentrated, host over 30% of all the floating populations in China47. They are also rich in quality healthcare (Supplementary Fig. 16) and have the strict hukou-based welfare system that excludes migrant workers. We thus calculate the mobility of patients who reside in the 28 major cities to the cities that are prominently deprived of quality healthcare as the pseudo patient mobility.
A city’s lack or richness of quality healthcare is measured by the capacity of all the tertiary-A hospitals of the city, and the capacity of a tertiary-A hospital is measured by the number of hospital beds. We use the Jenks natural breaks algorithm to determine the threshold value of the level of capacity of quality healthcare. The cities in the category of the highest level (level 1) of tertiary-A hospital capacity are defined as being the richest in quality healthcare, and the cities in the last two levels (3 and 4) are defined as being significantly deprived regarding quality healthcare and are recognized as the destination of pseudo patient mobility from the 28 major cities (Supplementary Fig. 16).
Clustering cities’ dual roles in patient mobility
We cluster all 364 Chinese cities according to their role as the origin (demand) and destination (provision) of patient mobility. All 364 cities had an outflow of patients, and they are all included in the clustering analysis of origin cities. However, only 273 cities had an inflow of nonlocal patients, and they are thus included in the clustering analysis of destination cities. The remaining 91 cities hosting no nonlocal patients are placed into one group manually.
For clustering destination cities, we consider three dimensions of the seven attributes that depict a city’s capacity for serving nonlocal patients (Supplementary Table 1): (1) the scope of services, including (1a) the vertical scope regarding the geographical depth of catchment areas, which is measured by the weighted average distance between the destination and origin cities of the served nonlocal patients, and (1b) the horizontal scope regarding the diversity of origin cities, which is measured by the number of origin cities of the served nonlocal patients; (2) the necessity of services, including (2a) the healthcare deprivation of served origin cities, which is measured by the weighted number of tertiary-A hospital beds per 1,000 persons of origin cities of the served nonlocal patients; and (2b) the economic level of served origin cities, which is measured by the weighted GDP per capita of origin cities of the served nonlocal patients; and (3) the type of mobility of the inflowing patients, which is measured by the percentage of mobility for the best diagnosis and treatment, mobility for better diagnosis and treatment and pseudo patient mobility.
For clustering origin cities, we consider four dimensions of the seven attributes that depict the ability and motivation of a city’s residents to move to access nonlocal quality healthcare (Supplementary Table 2): (1) the scope of mobility including (1a) the vertical scope regarding the geographical depth of destination cities that is measured by the weighted average distance between the origin city and the destination cities of outflowing patients, and (1b) the horizontal scope regarding the diversity of destination cities, which is measured by the number of destinations of outflowing patients; (2) the motivation to move regarding the deprivation of the local quality healthcare, which is measured by the number of tertiary-A hospital beds per 1,000 persons; (3) the economic ability to move, which is measured by GDP per capita of the city; and (4) the type of mobility of the outflowing patients, which is measured by the percentage of mobility for the best diagnosis and treatment, mobility for better diagnosis and treatment and pseudo patient mobility.
The bisecting k-means is used for clustering cities. This is an unsupervised clustering algorithm that is based on the traditional k-means method but is deemed a more efficient and more accurate technique48. As a divisive hierarchical clustering algorithm, the bisecting k-means assigns all data points to one cluster at first, and the k-means is repeatedly applied to the parent cluster, which is known as ‘C’ to obtain the best subclusters, which are then known as ‘C1’ and ‘C2’49. The formal procedure of the bisecting k-means is as follows: (1) assigning a parent cluster C to be split; (2) using k-means to split C into subclusters C1 and C2; (3) calculating the intercluster similarity (for example, Euclidean distance) for C1 and C2 until a fixed number of iterations is achieved; (4) selecting the subclusters with the highest intercluster dissimilarity (for example, biggest sum of squared errors); and (5) repeating steps 2 and 3 until k clusters are formed.
The elbow index (sum of squared errors) and the silhouette coefficient are used in the bisecting k-means to determine the number of clusters, and the best cluster number is 4 both for the origin and for the destination cities (Supplementary Fig. 17).
Measuring relative gains in IHS
Here, we assume that the IHS operates similarly to the trade system where a city both imports and exports healthcare resources. The patient outflows and inflows indicate the volume of import and export. Hence, we introduce the concept of Vollrath’s revealed comparative advantage50 to construct the relative import advantage index (equation (1)) to measure a city’s relative advantage in obtaining intercity healthcare resources, and the relative export advantage index (equation (2)) to measure a city’s relative advantage in providing intercity healthcare resources. Finally, we use the ratio of relative import advantage to relative export advantage (equation (3)) to measure a city’s relative gains in IHS. The larger the value, the more a city gains from IHS.
where ({{{mathrm{RG}}}}_{{mathrm{in}}_{i}}) refers to the relative import advantage of city i, ({V}_{{{mathrm{out}}}_{i}}) refers to the number of outflowing patients of city i and ({V}_{{{mathrm{all}}}}) refers to the total cross-city healthcare utilization in the IHS.
where ({{{mathrm{RG}}}}_{{{mathrm{ou}}}{{mathrm{t}}}_{i}}) refers to the relative export advantage of city i, ({V}_{{mathrm{in}}_{i}}) refers to the number of inflowing patients of city i and ({{{mathrm{Num}}}}_{{{mathrm{be}}}{{mathrm{d}}}_{i}}) refers to the number of tertiary-A hospital beds of city i; ({{{mathrm{RG}}}}_{i}) refers to the relative gains of city i.
Statistics and reproducibility
No statistical method was used to predetermine sample size. No data were excluded from the analyses.
Reporting summary
Further information on research design is available in the Nature Portfolio Reporting Summary linked to this article.
Responses