Urine electrooxidation for energy–saving hydrogen generation
Introduction
Reducing electricity consumption and minimizing the use of noble metals are the key priorities for lowering the overall cost of hydrogen (H2) production through water electrolysis.1,2,3,4,5,6 A widely explored strategy to achieve these objectives involves developing cost–effective electrocatalysts that reduce the overpotential for water splitting. Nevertheless, the energy–saving potential of this approach is still constrained by high thermodynamic barrier of the oxygen evolution reaction (OER).5,6 To address this limitation, a promising way is to replace the anodic OER with other thermodynamically favorable oxidation reactions involving abundant reactants.7,8,9,10 Urea, as a hydrogen carrier, has a lower thermodynamic decomposition barrier than that of water,11,12,13 making urea oxidation reaction (UOR) a promising alternative to OER for energy–saving hydrogen production.14,15 Currently, the UOR primarily employs alkaline conditions with nickel (Ni)–based catalysts and pure urea solution.16,17,18,19,20,21,22,23 However, since urea is valuable as fertilizer and its industrial production process has involved carbon emissions,24 relaying on pure urea as feedstock for electrooxidation is neither economical nor aligned with the intention of “green hydrogen” production. Additionally, due to the OER competition at high potential, the energy–saving ceiling of UOR is notably diminished under large current operation on Ni–based catalysts.17 Therefore, considering the market price of urea and required voltage via techno–economic analysis (TEA, Fig. 1a and Supplementary Fig. 1), the use of pure urea for UOR is impractical, which hardly competes with water electrolysis for cost–saving H2 production.
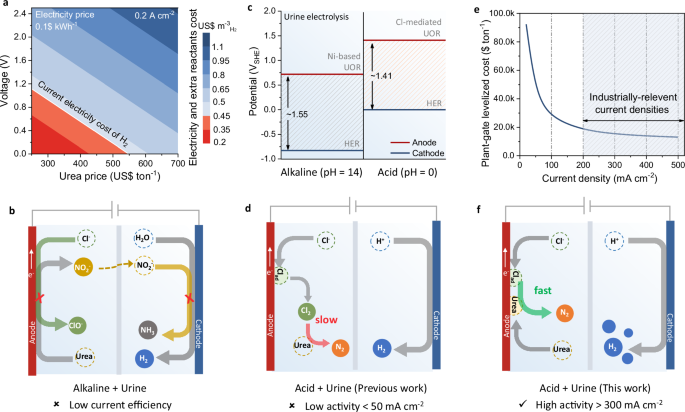
a TEA revealing reactants and electricity cost as a function of voltage and urea price in alkaline UOR using pure urea as additive. b Scheme illustrating the existing issues in alkaline urine electrolysis. c Comparison of the theoretical overall potential of urine electrolysis under alkali and acidic conditions. d Schematic illustration of the sluggish urea oxidation via indirect Cl2 mediation in urine electrolysis. e The function of plant–gate levelized cost and current density in urine electrolysis based on TEA. f Schematic illustration of the rapid–oxidation mechanism proposed in this work via direct coupling of adsorbed urea and Cl on Pt surface for boosted urine electrolysis in acid. Source data for Fig. 1a, c, and e are provided as a Source Data file.
The only viable route to carry out UOR for cost–saving H2 production requires the cost–free and abundant source of urine as the feedstock. Nevertheless, apart from sufficient amount of urea (−167−583 mM), urine from human contains magnesium (Mg2+,~2.1−11.2 mM), calcium (Ca2+, −1.7 mM), and chloride ions (Cl−, −40−224 mM).25 These additional constituents negatively affect alkaline UOR by forming precipitates or poisoning catalysts. Particularly, a relatively large amount of Cl− ions in urine will trigger chlorine evolution reaction (ClER) under industrial–scale current operation, leading to irreversible corrosion of the electrode and electrolyzer.26 Moreover, urea is mainly converted into nocuous nitrite (NO2−) under Ni catalyzed UOR.27,28,29 Due to the easier reduction of NO2− than that of water, the NO2− would migrate to the cathode under electric field effect to compete with hydrogen evolution reaction, leading to the decreased current efficiency of hydrogen production (Fig. 1b).30 All these are ineluctable and severely limit the prospects of alkaline UOR. Therefore, designing new systems to address these issues and advance the energy–saving urine electrolysis is of great importance for H2 production.
Benefiting from the low thermodynamic equilibrium potential of Cl−/Cl2, acidic urine electrolysis offers an avenue to avoid NO2− generation via triggering Cl2–assisted urea oxidation (6Cl− → 3Cl2 + 6e−; 3Cl2 + CO(NH2)2 + H2O → CO2 + N2 + 6HCl) and contributes to a reduced overall potential for H2 production in theory (Fig. 1c).31,32,33,34,35 However, due to the limitation of the mass transfer, this indirect urea oxidation in the presence of Cl2 shows a sluggish kinetics and potential corrosion, leading to a low current density and disappointing stability in urine electrolysis (<50 mA cm−2, Fig. 1d).36,37,38 Such poor performance does not satisfy industrial–scale requirements, seriously increasing the cost of hydrogen production (Fig. 1e), which demands urgent improvement via excavating reaction mechanism with alternative intermediates and accelerated kinetics.
Herein, we propose a kinetic favorable Cl–mediated UOR (denoted as Cl–UOR) pathway for the cost–effective hydrogen production. Differing from the sluggish indirect oxidation mechanism involving Cl2 generation and participation, we demonstrate the Cl–UOR can be accelerated on the Pt surface by direct coupling of adsorbed Cl (Clads) with adsorbed urea to form N–chlorourea, which then converts into N2 via intermolecular N–N coupling with *OH assistance (Fig. 1f). This Cl–mediated oxidation pathway/mechanism in urine electrolysis avoids Cl2 generation, contributing to the enhanced performance of this process. Compared to the Ni–based urea electrolysis (5.62 kWh Nm−3) and water electrolysis (4.98 kWh Nm−3 in alkali and 4.70 kWh Nm−3 in acid), the optimized Pt–catalyzed urine electrolysis shows a lowest value of 4.05 kWh Nm−3 under 300 mA cm−2 operations, demonstrating a notable reduction of the electricity cost for H2 production in practical electrolyser. This work highlights the prospects of acidic urine electrolysis for energy–saving H2 production and urine remediation.
Results
Performance comparison for urine electrolysis in alkali and acid
We started this study by evaluating the difference between pure urea and simulated urine as additives during electrolysis in both alkaline and acidic electrolytes at gas–tight H–type cell with two–electrode configuration. Simulated urine was prepared by adding the corresponding metal salts with specified concentrations to urea solution as shown in Fig. 2a and Supplementary table 1. Ni foam (NF) and Pt/C were selected as electrodes for alkaline and acidic electrolysis because they are commonly used in previous studies on urea electrooxidation.14,39 Linear sweep voltammetry (LSV) tests show that NF exhibits increased current density from potential of 1.3 V in pure urea–contained 1 M KOH, demonstrating good activity toward urea electrooxidation (Fig. 2b and Supplementary Fig. 2). However, once pure urea is replaced with simulated urine, the NF activity notable decreases at high potentials with an obvious current decay within 1 h test (Fig. 2b and Supplementary Fig. 3). Similar behavior is also observed for high–activity Ni(OH)₂/NF electrode (Supplementary Fig. 4 and Supplementary note 1), indicating that Cl− in simulated urine inevitably corrodes Ni–based catalysts at high potentials, thereby leading to the activity loss during UOR. Contrarily, Pt/C catalyzed electrooxidation of pure urea or simulated urine in acid exhibits the opposite results. No noticeable current increase for Pt/C in 0.5 M H2SO4 is observed when pure urea is added whilst a notable boost in the current is recorded after replacing urea with simulated urine. Compared to NF, the activity of Pt/C for UOR with simulated urine as additive in 0.5 M H2SO4 could achieve 118.9 mA cm−2 at 2 V, which is ~13 times higher than that with pure urea as additive, and well–maintained within 1 h test (Fig. 2c and Supplementary Fig. 3). All these results demonstrate the performance limitations of Ni–based catalysts for hydrogen production through urine electrolysis, in contrast to the enhancement observed in the Pt/C catalyzed process.

a Physiological ranges of presented ions in healthy human urine and their concentrations in simulated urine. Comparison of the b polarisation curves and c histograms of current densities at voltage of 2 V for NF // NF and Pt/C // Pt/C two–electrode systems respectively recorded in 1 M KOH and 0.5 M H2SO4 with simulated urine and pure urea as additives. d Histograms of comparative current densities at potential of 1.8 VRHE for Pt/C in configured electrolyte with different ions as additives. e Time–dependant urea concentration changes for urease containing simulated urine stored under different condition. f LSV curves for Pt/C in urease–containing simulated urine under different storage conditions. Source data for Fig. 2a–f are provided as a Source Data file.
To investigate the underlying factors of the UOR enhancement in simulated urine, the effects of various ions present in the simulated urine on UOR performance for Pt/C were assessed individually. As shown in Fig. 2d, except for Cl−, the presence of other ions in urine does not notable affect activity of Pt/C in UOR under acidic conditions (Supplementary Fig. 5), confirming Cl− present in urine play a crucial role on UOR promotion. The influence of acidic conditions (pH) on UOR improvement for Pt/C was then explored (Supplementary Fig. 6). Apparently, as the electrolyte shifted from alkaline or neutral to acidic, the UOR activity increased notably. Although a slight decrease in activity was observed under mildly acidic conditions (pH 1 or 2), the Pt–catalyzed UOR still maintained energy–saving benefits with higher current density than that for IrO₂–catalyzed OER at high potentials (Supplementary Fig. 7). This finding suggests that mildly acidic electrolytes (pH 1 or 2) hold promise for practical urine electrolysis, balancing performance with engineering feasibility for energy–efficient hydrogen production. Additionally, the controlled enzymolysis experiment indicated that acidified urine can prevent enzymatic urea hydrolysis, maintaining stable urea concentration during storage, in contrast to non–acidified urine (Fig. 2e Supplementary Fig. 8, and Supplementary note 2). Consequently, UOR activity in acidified stored urine remained high, comparable to that observed for fresh urine, while non–acidified stored urine showed negligible UOR activity (Fig. 2f). All these results demonstrate the key roles of present Cl− and acidic conditions in enhancing Pt–catalyzed urea oxidation for hydrogen production.
In situ differential electrochemical mass spectrometry (DEMS) with controlled additives was conducted to explore the possible pathway for Pt–catalyzed urine electrolysis in acid (Supplementary Fig. 9). As shown in Supplementary Fig. 10, the detected signal for Cl2 gradually increases at −1.35 V vs. RHE (VRHE) in KCl contained in electrolyte (0.5 M H2SO4), indicating the triggered ClER. However, when adding urea into this electrolyte, the previously observed Cl2 disappears, and the increased signals of CO2 and N2 at 1.5 VRHE are visible (Fig. 3a). More importantly, the controlled cyclic voltammetry (CV) scan across ranges of the equilibrium potential for ClER (1.36 VRHE) reveals that besides the peak of Cl2 reduction, the Clads desorption peak under tailored scan range also disappears once urea is additionally fed into electrolyte (Fig. 3b and Supplementary Fig. 11). All these results indicate Clads serves as active mediator beyond Cl2 for Cl–UOR on Pt.

a In situ DEMS with the corresponding CV curve for Pt/C in 0.5 M H2SO4 electrolyte with urea/KCl mixture to monitor generated gas during electrolysis, scan rate = 10 mV s–1, no iR correction. b Comparison of the CV scan for Pt/C catalyst under different potential ranges in KCl containing 0.5 M H2SO4 with or without urea as additive, scan rate = 50 mV s–1, no iR correction. Product FEs for c NF and d Pt/C conducted in 0.5 M H2SO4 and 1 M KOH with simulated urine as an additive under different potentials within 1 h electrolysis. Error bars correspond to the standard deviation of three independent measurements. e Comparison of time–dependent changes in current density, reactant concentrations, product concentrations, and product FEs for Pt–catalyzed Cl–UOR at 1.8 VRHE. The experiments were tested once by using an electrode with increased geometric area (1 × 2 cm2) in 8 mL electrolyte to improve test efficiency for urea consumption. Source data for Fig. 3a–e are provided as a Source Data file.
Ultraviolet–visible (UV–vis) spectra further demonstrate that N–chlorourea and N, N’–dichlorourea are generated as liquid products during Cl–UOR depending on the applied potential (Supplementary Fig. 12 and Supplementary note 3).40 Moreover, no significant free Cl species (Cl radicals, Cl₂ and HClO) were detected in the solution after Cl–UOR within 1 h (Supplementary Fig. 13 and 14), indicating reduced ClER in our system. The potential dependence of Faradaic efficiencies (FEs) for each product generated in NF–catalyzed alkaline UOR and Pt–catalyzed acidic Cl–UOR after 1 h electrolysis (Supplementary Fig. 15–18) are summarized in Fig. 3c, d and Supplementary table 2, 3. As expected, N–chlorourea predominates as main product at low potential while it is gradually replaced by N2 as potential increases for the Pt–catalyzed acidic Cl–UOR. Compared to UOR on NF, the FE of N2 for Cl–UOR on Pt/C reaches a maximum of 73.1 % at 1.9 VRHE (Fig. 3c, d), demonstrating the advantage of acidic Cl–UOR on Pt, which contributes to conversion of urea into N2.
The time–dependent changes in activity, reactants and products were further investigated for Cl–UOR at 1.8 VRHE (Fig. 3e, Supplementary Fig. 19 and Supplementary table 4). It was observed that the current density gradually decreased during electrolysis, which can be attributed to the consumption of urea and Cl⁻ in the solution. However, differing from the results of the 1–hour electrolysis above, the concentration of free Cl in the solution increased with prolonged electrolysis. Particularly, when the urea concentration decreased to −0.074 M, the free Cl concentration exhibited a notable rise. This result highlights the competition between UOR and ClER, where ClER will become more dominant as urea is depleted. Therefore, for long–term electrolysis, it is crucial to adopt appropriate strategies, such as timely replenishment or replacement of the electrolyte with fresh urine, to suppress ClER and ensure Cl–UOR efficiency (Supplementary Fig. 20). Moreover, the FE of N₂ increased, while the FE of chlorourea decreased with urea consumption during long–term electrolysis, indicating that chlorourea serves as a secondary reactant during Cl–UOR. Notably, although no chloramine signals were observed in DEMS and UV results (Supplementary Fig. 21 and Supplementary Note 4), NH₄⁺ and its eletrooxidation derivative, NO₂⁻, were detected in the reaction solution and gradually increased with prolonged electrolysis (Fig. 3e and Supplementary Figs. 22 and 23). This finding suggests that chloramine may transiently form as intermediates during the reaction but does not persist as final products, as it is unstable and easily converted to N2 under acid condition. According to computation, the chloramine intermediates contribute to a small portion of the total N₂ generated (Supplementary Note 4), confirming that the conversion of N–chlorourea to chloramine and subsequently to N₂ is not the dominant pathway in our system, which suggests a distinct pathway of Cl–UOR in our system.
Kinetic study of Cl–UOR
To gain a deep understanding of Cl–UOR on Pt, the RuO2 catalyst was selected for the purpose of comparison because of its high activity in ClER.41 Differing from the observed activity promotion on Pt/C, the activity of Cl–UOR on RuO2 was much lower as compared to the ClER (Fig. 4a, Supplementary Figs. 24 and 25), evidencing the uniqueness of Pt in boosting Cl–UOR process. Kinetic studies were conducted by correlating the concentration of Cl (CCl−) with activity (Supplementary Figs. 26 and 27). As shown in Fig. 4b, the dependence of CCl− on the Cl–UOR activity is obvious on RuO2 with a linear slope of 1.25, whilst it is zero on Pt, indicating an altered kinetics of Cl–UOR on Pt compared to RuO2. Notably, the slope of the linear dependence between CCl− and Cl–UOR activity is similar to that for ClER on RuO2 (Supplementary Fig. 26), demonstrating that Cl–UOR on RuO2 follows a Cl2–assisted oxidation process, which is consistent with the reported studies.38 Nevertheless, the situation on Pt/C is more complex and shows two stages (Fig. 4c). When CCl− is below 0.5 M, the dependence of activity is linear for both Cl–UOR and ClER with a slope of 0.65 and 0.78, respectively. However, as CCl− increased over 0.5 M, the slope of linear ClER activity is maintained while it approaches zero for Cl–UOR. The altered correlation observed for these reactions with CCl− demonstrates that the rate determining step (RDS) for Cl–UOR on Pt/C does not involve the Cl− induced Cl2 generation (Supplementary Note 5). More importantly, compared to ClER, the activity of Cl–UOR is less affected by mass transfer of Cl−, whilst it apparently varies with the urea concentration following a volcano trend on Pt/C (Supplementary Figs. 28–30), further evidencing the important role of urea on the Cl–UOR kinetics instead of Cl− in solution. Therefore, we speculate that urea is concurrently adsorbed on the Pt surface to combine with Clads, thereby accelerating the kinetics of Cl–UOR.

a Comparison of LSV curves for ClER and Cl–UOR on Pt/C and RuO2, no iR correction. b Comparison of the dependence of the Cl–UOR current density on CCl– for Pt/C and RuO2. (c) Comparison of the dependence of the ClER and Cl–UOR current density on CCl– for Pt/C. For rigorousness, all the currents for the catalysts in b and c were taken at the onset potential to exclude the diffusion influence, while additional KNO3 was introduced to maintain a constant ionic strength of the electrolyte. d CV curves for Pt/C catalyst in 0.5 M H2SO4 with urea or KCl additives to identify both adsorbed urea and Cl–on the Pt surface during Cl–UOR, scan rate = 5 mV s–1, no iR correction. The numbers represent the value of charge for HUPD region. e Cl 2p XPS spectra of Pt/C following Cl–UOR and ClER at 1.3 VRHE. Schematic illustration of Cl–UOR on f RuO2 and (g) Pt/C. Source data for Fig. 4a–e are provided as a Source Data file.
To verify this speculation, we explored the underpotential deposition of hydrogen (HUPD) on Pt/C. In comparison to the CV of Pt/C in 0.5 M H2SO4, the presence of urea or Cl− causes a decrease in charge of HUPD as shown in Fig. 4d42. Additionally, an increase of the potential for OH− adsorption is observed in the presence of urea or Cl− in solution.43 All these findings provide evidence for adsorption of urea and Cl on Pt surface. Moreover, an additional couple of peaks belonging to organic Cl species (N–chlorourea) are identified in Cl 2p X–ray photoelectron spectroscopy (XPS) spectra, which increase with applied potential following reaction in KCl/urea–mixed electrolyte as compared to those observed in KCl electrolyte only (Fig. 4e, Supplementary Fig. 31).44 Since the selected reaction potential (1.3 VRHE) for XPS test did not trigger ClER (Fig. 4e), the organic Cl species originating from the reaction of Cl2 with urea was excluded here, thereby confirming coupling of adsorbed urea with Clads. Furthermore, the tertiary butanol quenching experiment demonstrates the Cl radicals are not generated and involved in urea oxidation within the potential range used during Cl–UOR (Supplementary Fig. 32 and Supplementary Note 6). All these results support our hypothesis that Cl–UOR initiated on Pt/C follows a rapid oxidation process where urea and Cl are concurrently adsorbed on the Pt surface to undergo direct coupling (Fig. 4g), differing from the slow indirect oxidation involving Cl2 participation on RuO2 (Fig. 4f).
Catalyst evolution during Cl–UOR
To further elucidate the underlying reason for boosting urea–to–N2 conversion on Pt/C, the potential–dependent adsorption of intermediates during Cl–UOR was assessed via in situ attenuated total reflectance infrared absorption spectroscopy (ATR–IRAS, Supplementary Fig. 33). As shown in Fig. 5a, a C–N stretching vibration and C=O vibration peak at −1475 cm−1 and ~1686 cm−1 are increasing downward respectively with the applied potential from 1.3 VRHE to 1.5 VRHE (Supplementary Table 5), demonstrating that urea is adsorbed in N–terminal configuration on the Pt surface and gradually consumed within the potential range to form N–chlorourea.42 In sharp contrast, once the potential increased to 1.5 VRHE, the peak of C=O vibration reversed and shifted to ~1656 cm−1, a new OH− vibration peak at −3490 cm−1 appeared, evidencing N–chlorourea and *OH began to adsorb on the Pt surface via O–terminal configuration.42,45,46 This finding correlates with the revealed N2 formation under 1.5 VRHE, suggesting alteration of the reaction pathway of Cl–UOR due to the potential–induced local environment change, which is the key to the urea–to–N2 conversion.

a In situ FTIR spectra of Pt/C for Cl–UOR under varying potentials. b In situ k3–weighted Pt L3–edge EXAFS spectra of Pt/C catalysts during Cl–UOR test under varying potentials. c Coordination numbers of Pt–Pt, Pt–O and Pt–Cl bonds for Pt/C during Cl–UOR testing under varying potentials. d DEMS spectra of the gaseous products for Pt/C during Cl–UOR with N isotopic–labelled urea (90%14N urea + 10% 15N urea) as additive. e Comparison of the polarisation curves for Pt/C recorded for three electrodes test system in KCl containing 0.5 M H2SO4 with urea analogs and NH3 H2O as additives, no iR correction. f Schematic illustration of the whole reaction mechanism for Cl–UOR on Pt for conversion of urea to N2. Source data for Fig. 5a–e are provided as a Source Data file.
Accordingly, in situ X–ray absorption spectroscopy (XAS) was employed to assess the valence states and coordination environment change of Pt during Cl–UOR (Supplementary Figs. 34–38 and Supplementary Note 7). The wavelet transform analysis alongside Pt L3–edge extended X–ray absorption fine structure (EXAFS) spectra of Pt/C show a notable transition in the primary scattering peak from Pt–Pt to Pt–Cl and Pt–O with the potential rise from open circuit potential (OCP) to 1.6 VRHE during Cl–UOR (Fig. 5b and Supplementary Figs. 39 and 40), demonstrating the dynamic change in Pt coordination structure throughout the course of Cl–UOR. The coordination numbers (CN) of Pt–Pt and Pt–O bonds show a consistent decrease and increase with applied potential, respectively, whilst that of Pt–Cl exhibits a volcano trend (Fig. 5c, Supplementary Figs. 41–43 & Supplementary Tables 6 and 7). Particularly, an increase in CNPt–O is visible along with CNPt–Cl decreasing to zero above 1.5 VRHE during Cl–UOR, and remains almost constant even at the potential returning back to OCP (Fig. 5c). This obvious change in CNPt–O and CNPt–Cl corresponds closely to the emergent OH− adsorption band at 1.5 VRHE on FTIR spectrum, demonstrating the decreased coverage of Clads due to Pt oxidation with adsorbed OH−. Given this finding, the original step that Clads combined with adsorbed urea was restrained, instead replaced by the adsorbed *OH interacting with Cl− from solution to generate HClO. Such potential–dependent HClO generation can be evidenced by the Pourbaix diagram for saline electrolytes as earlier reported .24 Therefore, all these results indicate that HClO become the major mediator in Cl–UOR above 1.5 VRHE that plays an important role in urea–to–N2 production.
N isotopic–labelled urea was further utilized to track N–N coupling process of N2 generation during Cl–UOR. As shown in Fig. 5d and Supplementary Fig. 44, when using the 14N urea (90%) and 15N urea (10%) mixture as reactant for Cl–UOR test, only 14N15N and 14N14N signals were detected on DEMS, whilst no obvious 15N15N signal appeared, demonstrating intermolecular N–N coupling is the main pathway for N2 generation during Cl–UOR. Moreover, the controllable electrooxidation using urea analogs reveals that the activity of 1,1–N, N–dimethylurea on Pt/C above 1.5 VRHE is higher than that of 1, 3–N, N–dimethylurea (Fig. 5e), demonstrating that the primary amine moiety is critical for activity promotion at high potential, which is necessary condition for intermolecular N–N coupling. In addition, ammonia exhibited much lower activity at high potential compared to urea, ruling out the possibility of intermolecular N–N coupling of ammonia due to urea hydrolysis during Cl–UOR (Fig. 5e), and evidencing the C–N cleavage for N2 and CO2 release occurring after the step of intermolecular N–N coupling.
Based on the above analysis, the entire mechanism for boosted Cl–UOR on Pt/C is proposed (Fig. 5f). Under a low potential, urea is adsorbed via N–terminal configuration on the Pt surface accompanied by Clads, resulting in fast kinetics of N–chlorourea generation via direct coupling. With increasing potential, due to the surface oxidation of Pt, *OH starts to adsorb on the surface above 1.5 VRHE. This altered behavior of adsorption leads to the HClO formation as redox mediator, facilitating oxidation of N–chlorourea into N, N’–dichlorourea. As the coverage of N, N’–dichlorourea on the Pt surface increases, the intermolecular N–N coupling is spontaneously triggered yielding N2 and CO2 with the aid of *OH via breaking C–N bond, thereby enabling the urea–to–N2 conversion.
Practical device performance for acid urine electrolysis
To evaluate the viability of Pt–catalyzed Cl–UOR as alternative for OER for hydrogen production, we assembled a flow–type electrolyser using Pt/C loaded carbon cloth (CC) as both anode and cathode, separated by a polyphenylene sulfide (PPS) diaphragm (Fig. 6a and Supplementary Fig. 45). Correspondingly, the two types of water electrolysers having the same assemble mode as commercial catalysis were implemented for the purpose of comparison (Fig. 6b). To reduce cost of the catalyst used, lower amount of catalysts was applied here for electrolysis (details in Method).47 As shown in Fig. 6c, along with increasing applied potential, the Pt–catalyzed simulated urine electrolysis showed a noable boost of current density for hydrogen production compared to both acidic and alkaline water electrolysis. Moreover, a much higher stability was observed assuring a stable operation over 210 h at the current density of 10 mA cm−2 for hydrogen production (average FE of 98.5%, Supplementary Fig. 46), greatly surpassing acidic water electrolysis under the same conditions (Fig. 6d).

Schematic diagram of a urine electrolyser and b water electrolyser for H2 production. Note that the loading masses of Ni(OH)2, Pt/C, and IrO2 on the corresponding substrates are 12.5 mgcat cm−2, 0.35 mgPt cm−2, and 0.4 mgIrO2 cm−2, respectively. c Comparison of polarization curves for urine electrolysis and water electrolysis for the catalysts used in two–electrode–assembly cells at 25oC, no iR correction. d Comparison of long–term stability test for Pt–catalyzed urine electrolysis and water electrolysis in acid at current density of 10 mA cm–2, no iR correction. The texts presented in the legend represents the used anodic catalysts and the corresponding operation conditions for electrolysis. Source data for Fig. 6c, d are provided as a Source Data file.
Furthermore, we compared the Pt–catalyzed simulated urine electrolysis with other typical urea (urine) electrolysis systems using Ni(OH)2 or RuO2 as anodic catalysts (Supplementary Fig. 47). To fulfill industrial requirements for large–scale hydrogen production, the temperature for electrolysis was raised to 60 °C. As results, the Pt–catalyzed simulated urine electrolysis was further improved at 60 °C, attaining a current density of 341.4 mA cm−2 at 2 V, which is 1.15 and 1.54 times higher than those of Ni(OH)2–catalyzed urea and simulated urine electrolysis in alkali. This value meets the requirements of industrial–scale electrolysis that has not been assessed and achieved in previous urine electrolysis studies (Supplementary table 8), and is also higher compared to the water electrolysis, RuO2–catalyzed urine electrolysis in this work (Fig. 7a and Supplementary Fig. 48), underscoring the energy–saving advantage of our system and its practical potential for hydrogen production. Notably, a higher activity can be achieved, e.g., ~531.7 mA cm−2 by tuning concertation of Cl− to 0.5 M via additionally introducing the saline during Pt–catalyzed simulated urine electrolysis, which further proves its applicability for industrial operations (Fig. 7a). In addition, Pt demonstrated enhanced stability, maintaining an average cell voltage of −2.23 V during simulated urine electrolysis for over 20 hours of operation and 10 cycles at 300 mA cm−2 (Fig. 7b, Supplementary Fig. 49 and Supplementary Note 8), whereas Ni(OH)2 and RuO2 showed a serious activity decay within 2 hours in the corresponding electrolytes, attributed to Cl2 corrosion (Supplementary Fig. 50). Due to the high N2 FE of Pt–catalyzed simulated urine electrolysis, the NO2−–induced current efficiency decrease during H2 production in Ni–based alkaline electrolysis is greatly alleviated. Consequently, the H2 FE for Pt–catalyzed simulated urine electrolysis is notably improved and exhibits a value of ~94%, exceeding the ~85% for the Ni(OH)2 under alkaline conditions (Fig. 7b and Supplementary Fig. 50c). This production of H2 accompanied by N2 in Pt–catalyzed simulated urine electrolysis eliminates explosion risks associated with O2 crossover in traditional water electrolysis and ensures high purity of hydrogen product (>99.9%), which contributes to the safe manufacturing and green urea degradation.

a Comparison of polarization curves recorded for simulated urine electrolysis and urea electrolysis by using the corresponding catalysts in two–electrode–assembly cells at 60oC, no iR correction. b Chronopotentiometry curve of the Pt–catalyzed and RuO2–catalyzed simulated urine electrolysis electrolysis operated at 60 °C, no iR correction, with the inset showing the FEs of H2 and N2 for Pt–catalyzed simulated urine electrolysis. The light–yellow position represents the renewal of electrolyte, which ensures a sufficient urea concentration for continuous electrolysis. Error bars correspond to the standard deviation of three independent measurements. c Concentration analysis of urea and Cl– in collected raw urine sample. d Comparison of polarization curves recorded for Pt–catalyzed raw urine electrolysis using different collected samples in two–electrode–assembly cells at 25oC, no iR correction. e Comparison of polarization curves recorded for Pt–catalyzed raw urine and simulated urine electrolysis at 60 oC, no iR correction. f Comparison of the electricity expense and extra cost of reactants in different electrolysis systems for H2 production. The text presented in the legend represents the used anodic catalysts and the corresponding operation conditions for electrolysis. Source data for Fig. 7a–f are provided as a Source Data file.
Beyond assessing electrolysis of simulated urine, the electrolysis system was further operated by using raw urine as feedstock, directly collected in batches from the author. To minimize electrode fouling from organic matter during electrolysis, raw urine samples were acid–stabilized and pretreated with a PTFE membrane (0.22 μm) filter to remove organic impurities and macromolecules (Supplementary Fig. 51).48 As shown in Fig. 7d, variations in Cl–UOR activity were observed across different batches of raw urine sample, which is attributed to differences in the concentrations of effective components (Cl− and urea) based on dietary intake levels (Fig. 7c). When the author consumed less water and more salt to control the metabolism, the Cl–UOR activity of the resulting urine (Sample 4) notably increased, reaching levels comparable to those seen for simulated urine (Fig. 7d). Similar result can be achieved by adding low–cost coarse salt to the raw urine (denoted as Sample 1, 0.2 M Cl−), demonstrating the important role of Cl− in urine for Cl–UOR enhancement. Moreover, at a testing temperature of 60 °C, raw urine assured high Cl–UOR activity comparable to that obtained for simulated urine (Fig. 7e). All these results further validate the viability of our system in practical applications.
The electricity expense and energy efficiency (EE) of each electrolysis system for H2 production was calculated based on the achieved H2 FE and cell voltage (Fig. 7f, Supplementary Figs. 52 and 53). Impressively, Pt–catalyzed simulated urine electrolysis assured a notable reduction of electricity and promoted EE (80.1%) in H2 production under 300 mA cm−2 operations. The electricity expense for H2 production reaches 4.42 kWh Nm−3 and can be even optimized to 4.05 kWh Nm−3 by increasing Cl− concentration (Fig. 7f). These results notably outperform the urea electrolysis for H2 production (5.62 kWh Nm−3) and are also lower than that of both alkaline and acidic water electrolysis (4.98 kWh Nm−3 and 4.70 kWh Nm−3) under the same configuration. Moreover, the cost estimation based on the price of electricity and extra reactants for Pt–catalyzed urine electrolysis reveals a prominent economic benefit compared to other electrolysis systems, further verifying its feasibility to compete with the current urea and water electrolysis routes for cost–saving H2 production. While an energy–saving H2 production from urine electrolysis was demonstrated, some challenges remain in our work, including the use of high–cost noble metal catalysts and the difficulties in urine collection. Accordingly, future efforts should focus on developing low–cost, high–performance catalysts to further reduce costs and enhance electrolysis efficiency of the system. Additionally, design and deployment of urine–diversion toilets will be urgent for efficient urine collection, which is essential for practical implementation of urine electrolysis in H2 production.
Discussion
In summary, an acidic urine electrooxidation system was developed for energy–saving H2 production. Unlike the traditional urea oxidation process, a rapid mediated–oxidation mechanism for urine electrolysis that utilizes Cl− contained in urine is demonstrated with a boosted activity and stability. Electrochemical and in situ spectroscopic investigations show that the rapid mediated–oxidation proceeds via direct coupling of adsorbed urea and Clads to form N–chlorourea, followed by intermolecular N–N coupling to release N2. Practically, the optimized urine electrolysis under concentrated Cl− exhibits an industrially required current density of 531.7 mA cm−2 at 2.0 V and requires smaller electricity consumption of 4.05 kWh Nm−3 for H2 production under 300 mA cm−2, outperforming the Ni–based urea electrolysis and water electrolysis. We expect that our work will stimulate the future research in direct urine electrolysis for H2 production and urea degradation for environmental remediation.
Methods
Chemicals
Nickel hydroxide (Ni(OH)2, AR), potassium hydroxide (KOH, AR), concentrated sulfuric acid (H2SO4, 98%) and RuO2 catalyst were purchased from Sigma–Aldrich. Argon (Ar, 99.999 %) was purchased from BOC Gas (Australia). Pt/C catalysts with 20% mass loading were purchased from Fuel Cell store. All chemicals were used as received without further modification. Water (18 MΩ*cm) used in experiments was prepared by using an ultra–pure purification system. The simulated urine used in experiments was prepared by adding suitable chemicals into water that are present in natural urine such as calcium chloride, sodium chloride, potassium chloride, magnesium chloride, ammonium chloride, sodium sulfate, potassium phosphate monobasic and urea. All these chemicals were AR purity and purchased from Sigma–Aldrich. The carbon cloth was purchased from CeTech Co., Ltd (Taiwan), specifically the model of W1S1011 (hydrophobic, thickness: 0.38 mm). The final composition and the corresponding molarity of simulated urine are listed in Supplementary Table 1.
Electrochemical measurements
Electrochemical oxidation of urea was conducted in a gas–tight H–cell (purchased from Gaossunion, China) separated by a proton exchange membrane (Nafion 117, treated in 5 wt.% H2O2 solution at 80oC for 1 h). Unless otherwise specified, all electrochemical tests were conducted using a three–electrode system. A micro–Ag/AgCl electrode (4.0 M KCl) and Hg/HgO electrode (1 M NaOH) were used as the reference for acidic and alkaline tests, respectively. Graphite rod was used counter electrodes. The catalyst–loaded carbon paper was used as a working electrode (active area: 1 x 0.5 cm, 0.5 cm2). To fabricate the working electrode, the specified amount of catalysts (4 mg) was dispersed in 0.4 mL of EtOH with 10 µL of 5 wt% Nafion solution and then 30 μL of solution was dropped onto carbon paper. The amount of loaded catalysts on carbon paper was controlled to ~ 0.3 mg cm−2. The electrolytes were simulated urine in 1.0 M KOH (pH = 13.89 ± 0.03) or 0.5 M H2SO4 (pH = 0.09 ± 0.02) solutions or others mentioned in the manuscript. All electrolytes were prepared using the corresponding reagents and stored in volumetric flasks. Each compartment of H–cell contained 15 mL of electrolyte with ca. 20 mL headspace. Ar was delivered to the anodic compartment (connected directly to GC (Agilent 8890B)) at a constant rate of 20 sccm and allowed to purge for 30 min prior to experiment. For long–term urea degradation tests (Fig. 3e), an additional exhaust collection bottle was connected between the H–cell and the GC to collect any potential Cl₂ loss from the electrolyte caused by Ar purging (Supplementary Fig. 19). Furthermore, a smaller volume of anodic electrolyte (8 mL) and a larger geometric area of the electrode (1 x 2 cm²) were utilized to improve test efficiency. All the reaction was tested on CHI760e electrochemical workstation by LSV with a scan rate of 10 mV s−1 or chronoamperometry under selected potential. Gaseous products were analyzed via GC equipped with a PLOT MolSieve 5 A column and a Q–bond PLOT column. If not mentioned, the readouts of electrochemical data were recorded with 80% ohmic iR drop correction, which was automatically implemented through the program on the CHI760e electrochemical testing software. Potentials are given against RHE computed from the Nernst equation: ERHE = Evs Ag/AgCl + 0.059 V × pH + 0.210 V. The FE of reaction products was computed using the following formulae: FE = eF × n / Q = eF × n / (i × t), where e is the number of electrons transferred, F Faraday constant, Q charge, i current, t running time and n total of product (mole).
Determination of free and total chlorine
Chlorine in solution was quantitatively determined via N, N’–diethyl–p–phenylenediamine (DPD) colorimetric method. 4.88 g of sodium phosphate dibasic, 8.12 g of sodium phosphate monobasic and 0.16 g of disodium ethylenediaminetetraacetate dihydrate were dissolved in 200.0 mL of 1.0 M NaOH to prepare a buffer reagent (reagent A).100 mg of DPD was dissolved in 100.0 mL of deionized water to obtain the chromogenic reagent (reagent B). and 50 g of potassium iodide was dissolved in 50.0 mL of deionized water to obtain the reducing reagent (reagent C). To quantitatively determine the amount of free chlorine (Cl2 and ClO− in solution), 5 mL of diluted sample solution was added to a test tube to which 0.5 mL of reagent B and 0.5 mL of reagent A were successively added. Following mixing and standing for 1 min, absorption value at 520 nm was quickly determined on DR 900 UV–vis colorimeter (Hach). For total chlorine determination (Cl2, ClO− and N–chlorourea in solution), an additional 0.1 mL of reagent C was added into test tube and standing for 3 min, then absorption value evaluated by colorimetry. The concentration–dependent absorption spectra were calibrated using standard active chlorine solution of different concentrations. The amount of N–chlorourea or N, N’–dichlorourea can be calculated through active chlorine content using the following equations: nN–chlorourea = ntotal Cl − nfree Cl or nN, N’–dichlorourea = (ntotal Cl − nfree Cl) / 2, where n is the amount of product (mole). Moreover, the concentrations of urea and chlorourea in long–term electrolysis were also determined via 12C NMR (Supplementary Fig. 23b).
Urine electrolysis
The electrolysis was performed in a two–electrode–assembly flow cell configuration having two titanium backplates with a 4.0 cm2 serpentine flow field. The catalyst deposited gas–diffusion electrodes (GDEs) including Pt/C–deposited Ti felt, IrO2–deposited Ti felt and Ni(OH)2–deposited NF were used as anodes and Pt/C–deposited carbon cloth as cathode. The cathode and anode were pressed onto both sides of a PPS diaphragm. The gap between the electrodes was minimized as ~0.5 mm to reduce ohmic loss. The catalyst deposited GDEs were prepared by loading selected catalysts onto the corresponding gas diffusion layers via the airbrush technique. The loading of catalysts was determined by weighing the gas diffusion layer prior and after air–brushing and controlled at 12.5 mgNi(OH)2 cm−2, 0.35 mgPt cm−2 (Ti felt), 0.2 mgPt cm−2 (carbon cloth) and 0.4 mgIrO2 cm−2 for corresponding GDEs. The electrolyte (simulated urine in 1.0 M KOH or 0.5 M H2SO4 solutions, 50 mL for each of the catholyte and anolyte) was circulated through the cell at 50 mL min−1 using a peristaltic pump. The resistance of the two–electrode–assembly cells was 325 ± 14.9 mΩ, measured via electrochemical impedance spectroscopy under open-circuit voltage conditions. The UOR performance for two–electrode–assembly cells were evaluated by LSV or chronopotentiometry using an AUTOLAB PGSTAT 302 N (Metrohm Autolab) electrochemical workstation with a current amplifier. The gas products were periodically transported into GC via Ar purging for analysis. The EE of electrolysis system for H2 production is based on the following equation: EE = (Eoutput / Einput) = (MH₂ (g) × HHVH₂ (kJ g⁻¹) × 1000) / (I (A) × U (V) × t (s)), where MH₂ is the mass of hydrogen produced determined by GC, HHVH₂ is the higher heating value of hydrogen (141.7 kJ g⁻¹), and I, U, and t represent the operating parameters of the urine electrolysis system.
In situ DEMS measurement
In situ DEMS spectra were recorded on a HPR–40 DEMS system (Hiden Analytical Ltd.). A home–made electrochemical single–cell furnished with Pt wire counter electrode and Ag/AgCl reference electrode was used for electrochemical testing (Supplementary Fig. 9). An Au–sputtered porous Polytetrafluoroethylene (PTFE) membrane (pore size 0.02 μm, Hangzhou Cobetter Filtration Equipment Co.) coated with catalysts served as a working electrode. The electrolytes were 1 M KOH containing with or without 0.33 M urea and 0.3 M KCl. For isotope experiments, the electrolyte was prepared using 15N-labeled urea as the reactant. CV was used for electrochemical tests and determined at a scan rate of 5 mV s−1 in the specified electrolyte. Gaseous products generated on the electrode surface during the test were directed into a mass spectrometer via vacuum pump and detected under specific mass–to–charge ratio. The ion currents are plotted directly without any deconvolution.
In situ ATR–IRAS measurements
In situ ATR–IRAS data were obtained on a Nicolet iS20 spectrometer equipped with an HgCdTe detector and a VeeMax III (PIKE Technologies) accessory. The measurements were determined on a home–made electrochemical single–cell equipped with Pt wire and Ag/AgCl as counter and reference electrode, respectively (Supplementary Fig. 33). A gilded silicon prism (60°, PIKE Technologies) coated with catalyst embedded on the bottom of the cell served as a working electrode. Prior to testing, the detector was cooled with liquid nitrogen for ca. 30 min to maintain a stable signal. Chronoamperometry was used for UOR testing accompanied by spectrum collection (32 scans, 4 cm−1 resolution). All spectra have background subtracted.


Responses