Management practices and manufacturing firm responses to a randomized energy audit
Main
Many projections of what it would take to address global climate change target energy use in industrial manufacturing1,2,3. The Intergovernmental Panel on Climate Change attributes 33% of global CO2 emissions to industrial energy use, including fossil fuels used in electricity and heat production4. In these settings, improving energy productivity (or reducing energy required to produce a unit of output) has often been characterized as one of the most important and cost-effective means for mitigating greenhouse gas emissions from industry5. One recent study estimated CO2 emissions abatement potential to be about five gigatons, or 10% of global emissions today6.
Calls for improving energy productivity in industry have focused on the importance of firm awareness of their energy use and targeted interventions as part of a broader portfolio of policy targets for process energy efficiency, international standards for energy management and subsidies for energy-saving investments and training programmes. Yet, despite a proliferation of initiatives, the impact of interventions to raise firms’ awareness of their energy use and reduction opportunities has rarely been studied empirically, especially in the developing world, where the benefits are expected to be large7.
Despite broad interest, causal evidence on the effect of informational interventions such as an energy audit and the role of structured management practices on energy productivity is scarce. Management practices may interact with these choices, to the extent that they capture employees’ awareness and tracking of processes or incentives to improve them. Prior literature that finds structured management practices are related to economic performance in manufacturing firms8,9,10. Because a firm’s economic performance is partially driven by input choices, including energy, we study the relationship between these practices and the adoption and impact of energy efficiency recommendations. We implement a randomized controlled trial to evaluate whether an energy audit intervention (focusing exclusively on electricity) that aims to reduce both electricity use and electricity expenditure affects a firm’s physical electricity use and the cost per unit of electricity used (hereafter ‘unit cost’), which is calculated by dividing electricity expenditure by physical electricity use. We measure management practices by interviewing managers, separately scoring firms on lean operations, target setting, monitoring and human resource management based on the survey instrument in Bloom and Van Reenen8 and by implementing a survey of energy-management practices. Our study setting is a metal component manufacturing cluster in Shandong Province, China, where electricity is provided almost exclusively by coal-fired power plants. These plants emit relatively high greenhouse gas carbon dioxide (CO2) per kilowatt-hour compared to other electricity types.
Our study makes three contributions. First, we experimentally quantify the impact of an energy audit intervention in a cluster of similar industrial firms that use electricity for metal processing, including machining, casting and forging. We find that the effect of the energy audit intervention was to reduce firms’ average unit energy cost but not energy use. This observation can be explained by the outsized effect of one recommendation that directed managers to correct a pre-existing distortion in the firm’s electricity input price. Second, we provide insight into how firm responses to external interventions interact with their pre-existing management practices, starting with recommendation adoption. We find that management practice scores are positively associated with the adoption of energy efficiency recommendations. Third, we examine management practices as a driver of recommendations’ impact. Management practice scores are negatively associated with impact on unit electricity cost and not significantly associated with impact on energy use. The unit cost effects are highly heterogeneous across recommendations, and one recommendation category, electricity tariff optimization based on a more accurate assessment of transformer size, is an outsized driver of the net decrease in unit cost. Our results add an internal organizational factor to our prior understanding of largely external factors that influence energy efficiency that may be relevant to developing and emerging countries, such as energy subsidies, poor power quality, non-technical losses and capital constraints7.
Experimental setting and theoretical predictions
Manufacturing firms contribute to climate change by emitting CO2, a major greenhouse gas, directly from production processes and indirectly by sourcing CO2-intensive inputs (for example, electricity). Using electricity more efficiently is one way a firm can potentially reduce both its indirect CO2 emissions and its input cost. Scholars have observed that many energy efficiency measures expected to be profitable are often not adopted, suggesting an ‘energy efficiency gap’11,12. Existing analyses have focused primarily on developed countries and found widespread evidence of incomplete adoption of energy efficiency measures, relative to what is projected to be profitable11,13,14,15. Decisions in developing countries are less well understood7. An observational study of small- and medium-sized firms in China found that very few firms had considered adopting measures to improve energy efficiency16.
Reasons given for the energy efficiency gap include hard-to-measure costs associated with the adoption of energy-saving practices17,18,19 and behavioural explanations11,20. DeCanio21 finds that firm characteristics are generally important predictors of adoption. In a related study, firm performance, location and industry correlated with participation in a generic and voluntary energy-saving programme for lighting17. Dowell and Muthulingam22 find that the extent of disruption, number of prior local adopters and strength of environmental norms influence firms’ adoption of energy efficiency initiatives.
Structured management practices, which have been linked to increased productivity, could theoretically help to explain the energy efficiency gap observed in firms. A growing body of studies connects structured management practices, such as lean operational practices, target setting and monitoring and human resource management, to economic8,23,24,25 and social26,27,28 measures of performance. Recent randomized controlled trials in India9 and in Mexico10 further causally relate management practices to improved economic performance outcomes. There has been some cross-sectional evidence showing that structured management practices are associated with lower energy and associated CO2 emissions. Bloom et al.26 found that the adoption of a set of structured management practices in UK firms was associated with a reduction in energy intensity (energy expenditure per value of output) of 17% when moving from the 25th to the 75th percentile on management score. Martin et al.27 studied the relationship between ‘climate friendly’ management practices, organizational structure and energy efficiency in UK firms and found adoption increased when the firm had an environmental manager with direct links to the chief executive officer. A study of US firms found that most management techniques were associated with lower energy intensity, suggesting that spillovers from general management practices to energy efficiency could lead to an ‘energy-management gap’ in firms with less structured practices28.
Our study examines the impact of structured management practices on the outcomes of an energy audit intervention in an experimental setting. We examine the adoption and impact margins separately as prior literature suggests effects may be distinct. On adoption, firms with less developed structured practices may be on average less likely to take up energy efficiency measures, because managers lack the information or internal coordination to assess the value of doing so29. In contrast, firms with well-developed practices may be more likely to recognize potential benefits and be able to coordinate implementation, similar to observations in Zhu et al.30. However, at baseline, even if adoption (measured as a binary ‘yes/no’ variable) is similar, the extent of prior implementation and potential for impact may vary as a function of management score. We first consider the impact of an energy audit intervention on energy use and energy cost and ask which recommendations drive that impact. Second, we probe whether a firm’s management practices interact with recommendations’ adoption and impact. This study includes and builds on material presented previously in a working paper31.
Our experiment is conducted in a metal processing industry cluster in Shandong Province, China. China uses more energy and emits more CO2 than any other nation. Its vast and energy-intensive manufacturing sector is directly or indirectly responsible for approximately 55% of the nation’s energy use32, equivalent to more than 12% of the global total33. Whereas much of this energy use is concentrated in industries with high energy intensity (iron and steel, cement, refined oil, chemical products and mining and other metals production), manufacturing activities with a higher share of value added also account for substantial energy use. Energy used in these activities primarily takes the form of electricity, an energy carrier that is generated from primary fuels. High value-added manufacturing accounts for over 12% of China’s total energy use32. Globally and especially in China, primary fuels used to generate electricity remain dominated by fossil fuels, especially coal, which when combusted generate climate-warming CO2 and local air pollutant emissions.
Two competing effects could influence a firm’s post-intervention energy intensity change based on existing energy efficiency and firm management studies26,28,34: first, a ‘baseline’ effect, in which reductions are greatest among firms with weak structured practices, because the intervention draws employee attention to energy-saving possibilities that firms with stronger practices have already exploited; and second, a ‘cognition’ effect, in which firms with well-developed management practices can more consistently and accurately recognize and implement productivity-improving adjustments to firm practices30. These adjustments may have either a positive or negative effect on total energy use and associated environmental impacts35,36, as described in Supplementary Appendix A. The main outcomes of interest in our experiment are recommendation adoption, physical electricity use (and intensity) and a firm’s unit cost of electricity (electricity expenditure divided by physical electricity use). We include the unit cost of electricity because our energy audit intervention and recommendations target both firms’ energy expenditure and use and offer firms the ability to adjust on both margins. The relationship of the intervention to unit energy cost, energy productivity (the inverse of energy efficiency) and energy use (which correlates with climate change and other environmental externalities) and the theorized mediating role of management practices is shown in Supplementary Fig. 1. We focus on electricity in this study because it is accurately reported monthly and can be verified by electricity bills, while we were unable to verify the reported consumption of other energy types. The net impact on each of these outcomes is expected to depend on the relative magnitude of the cognition effect and the baseline effect. We examine the net impact of the energy audit intervention on each empirically.
Impact of the intervention
We begin by presenting the causal impacts of our energy audit intervention, before turning to the role of structured management practices. As shown in Fig. 1, the likelihood of an applicable recommendation being adopted, calculated as the share of adopting firms within a specific recommendation category relative to the total number of firms for which the recommendation was applicable, ranged from 0.4 (for other equipment) to 0.9 (for lighting) at our second follow-up visit.
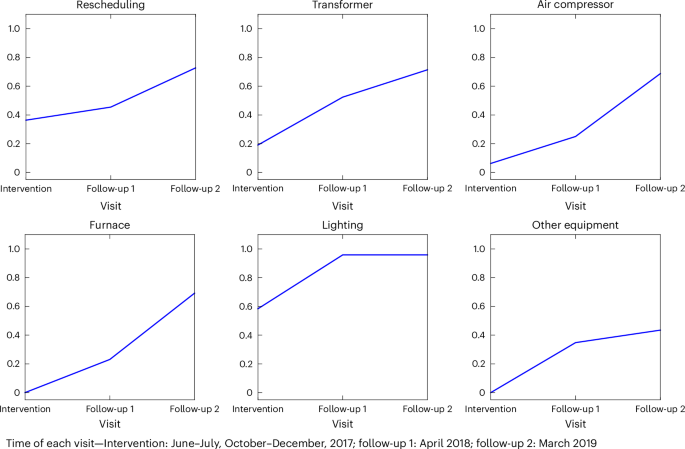
Adoption likelihood is the number of firms that adopted a recommendation, by category, divided by the number of firms for which a recommendation was applicable.
Although consultants based their evaluations on a consistent set of recommendations, not all recommendations were equally applicable to every firm. For example, not every firm had a furnace or air compressor, and three out of 24 firms shared a transformer, constraining potential transformer adjustments. Some recommendations had already been adopted before training. At the time of the second post-treatment follow-up visit, aside from lighting recommendations, which had an adoption rate of 90%, adoption rates for other categories ranged from 40% to 70%. This is despite the fact that the consultants provided advice to firms on tailoring recommendations to their production conditions and that recommendations were expected to be paid back within three years at maximum.
Estimates of the average impact on firms that received treatment show that our intervention reduced firms’ average unit cost of electricity but did not have a statistically significant effect on electricity use. We focus on electricity use as the main outcome variable instead of an intensity measure following recent experimental and quasi-experimental studies of energy efficiency19,37,38,39. These studies note that accurate output/service level measures for calculating energy intensity are usually unavailable, and poorly measured proxies can confound the estimation of the relationships of interest, which we expect to be similarly true in our setting. Furthermore, changes in energy use and CO2 emissions, unlike intensity measures, are more directly related to environmental impact.
We also focus on firms’ monthly average unit cost of electricity as one main outcome variable to capture the fact that managerial choices can influence a firm’s effective input prices, a reality ignored in most studies that do not observe energy quantity and expenditure at the firm level. During the study period, industrial users in China faced a ‘two-part’ tariff structure, set by the government, as indicated in Supplementary Table 1. The pricing scheme is so-called two-part as it contains charges for both electricity consumption (unit: kWh) according to an ‘energy rate’ (unit: yuan kWh−1) and peak load (unit: kW) or transformer capacity (unit: kVA) according to a ‘demand rate’ (unit: yuan kW−1 or yuan kVA−1). The latter part is to recover the network cost of the utility company to serve the peak load of an industrial user. This type of design dates back many decades, as discussed in Chung and Aigner40 and Aigner and Hirschberg41 for the United States and in Aigner et al.42 for Israel, and it is still widely adopted in the United States43, Germany44 and China45 for industrial users. One unique feature of China’s two-part tariff scheme is that an industrial user can choose either its peak load or self-reported transformer capacity as the basis for calculating the demand rate. This flexibility, however, can lead to a situation in which a manager might incorrectly report a sub-optimal value for transformer capacity to the grid company (which in our setting was usually much higher than its actual peak load). In this case, a firm would face a substantially higher unit cost of electricity. We observe that it is common for firms in our study with idle transformer capacity to use it to meet the peak load in high seasons and report the same capacity number in low seasons, paying more for electricity than they otherwise would. In practice, our transformer adjustment recommendation may have helped firms reduce the basis for calculating demand charges and lowered their effective unit cost of electricity, a possibility we formally test in our regression analysis.
The main effect of our intervention was to reduce firms’ unit cost of electricity with no change in use. On average, a treated firm experienced an 8% decline in its unit cost, and this effect is statistically significant at the 5% level (column (1) in Table 1). When the data series is extended to 2020, the treatment effect is still visible, as shown in Supplementary Table 2. The data during 2020 are noisier due to the impact of the COVID-19 pandemic on firm production schedules. We therefore focus on treatment effects estimated through the end of 2019. Whereas noteworthy, it is perhaps unsurprising that our intervention did not affect total electricity use (column (2) in Table 1), because it imposed no limit or disincentive. For example, only about 33% of the sample firms (14 out of 43) had an energy-saving target according to our energy-management questionnaire results, as described in Supplementary Table 3, but none proposed a target for controlling absolute energy use or CO2 emissions. We also considered the outcome of electricity use intensity, which could only be measured annually, and found no statistically significant impact of our treatment, as shown in columns (1) and (2) in Supplementary Table 4 and Supplementary Fig. 2. Because firms could have adjusted their inputs and/or production levels in response to the new information, the predicted effect on both total physical electricity use and electricity intensity is ambiguous (Supplementary Section A1 for an explanation, based on a simplified analytical model). The subset of levers that held potential to directly reduce the unit cost of electricity would in theory increase electricity use and electricity intensity.
We consider whether our main treatment effects differ by major process type. Although all firms in our study sample are metal processing firms and should belong to this manufacturing sector, we can further divide them into two groups based on whether firms employ metal casting or forging processes, which are in general more electricity intensive. In Supplementary Table 5, we show descriptive statistics of casting/forging firms and non-casting/forging firms, by treatment status. As expected, casting/forging firms have significantly higher electricity intensity. Within each sub-sector, the main statistics are balanced between treatment and control firms. In Supplementary Table 6, we show regression results when the intervention is interacted with a process dummy. We do not find any statistically significant differences in treatment effects.
We conduct robustness checks by trimming the 43-firm sample using different approaches. In Supplementary Tables 7–9, we drop outliers according to firm size, electricity intensity and management scores and run the main regression again. The estimated treatment effects on electricity use and the unit cost of electricity remain effectively unchanged.
In addition, we conducted an in-space placebo test to assess the robustness of the estimated treatment effects on the unit cost of electricity46,47,48. The distribution of estimated placebo effects is shown in Supplementary Fig. 3. The estimated treatment effect on the unit cost of electricity from the main regression (−0.08) is then compared against the distribution of estimated placebo effects to calculate p values. The two-sided p value (the frequency that the absolute values of the placebo effects are greater than or equal to the absolute value of the estimated treatment effect) is 0.02, further supporting that our estimated treatment effect bears statistical significance.
We also plot an event study graph showing unit cost and total electricity use outcomes by time for treated firms relative to control firms in Fig. 2a,b, respectively. Consistent with the results in Table 1, we find a visible and statistically significant reduction after the start of the treatment in Fig. 2a but no significant effect on use in Fig. 2b. The effects over time can also be observed by looking at the trends after treatment (Supplementary Fig. 4).

a,b, Treatment on firms’ unit cost of electricity (a) and electricity use (b). The figure shows the treatment effect by time using equation (4). The month before the treatment is omitted as the reference month. Solid lines represent estimated coefficients of interest and dashed lines represent 95% confidence intervals calculated using robust standard errors clustered at the firm level.
We are aware of the well-studied ‘rebound effect,’ in which an increase in energy efficiency leads a firm to substitute other inputs for energy, increasing output and offsetting the reduction in total energy used. We investigate and discuss this issue in Supplementary Section A and generate a back-of-the-envelope estimate of the direct rebound effect of 0.5 in our study setting. This estimate should be interpreted with caution because the effect on output in particular is noisily estimated. However, our estimate falls within the wide range of estimates given by the energy rebound literature using various methods49,50,51.
Management practices and recommendation adoption
We next consider how management practices interact with the intervention’s adoption and impact. Our intervention’s main effect is a statistically significant reduction in unit cost of electricity of approximately 8% on average (in log points). We relate a firm’s management practice score to both adoption and unit cost outcomes. Before treatment, we surveyed the pre-treatment adoption status of the treated firms. We provide granular data on recommendation applicability and adoption in Supplementary Table 10. Comparing column (2) in Supplementary Table 10b,c, the number of firms (out of 12) adopting each category of recommendation before training was similar among firms with above-median versus below-median management scores. At the end of 2021, we further visited 18 out of the 21 firms remaining in the control group and provided them with applicable recommendations. At the same visit, we asked about the ‘pre-treatment’ adoption status of these recommendations. The insignificant coefficient on management score in pre-treatment regressions suggests no relationship between management score and pre-treatment adoption, shown in Supplementary Table 11 for both the 24-firm sample (treated firms only) and the 42-firm sample (24 treated firms plus 18 control firms). This is consistent with prior studies that find a limited awareness of energy efficiency measures among firms in developing countries7,16. In an end-line survey, we asked managers if the firm had received energy-related consulting or advice within the last five years, and none of the respondents answered yes.
We estimate the relationship between management practices and adoption by regressing post-treatment adoption for treated firms (with and without a series of controls) on management practice scores. Supplementary Table 12 shows the coefficient estimates of ordinary least squares regressions that examine the correlation between general management scores and adopting a recommendation (or receiving an estimate of cost savings). Our management measure is positively and significantly associated with adoption. Columns (1) and (2) show that a one standard deviation increase in management score increases the probability of adoption by 20–23 percentage points, which is statistically significant at the 5% level. Controlling for recommendation category, we find a significantly higher probability of adopting recommendations that required the least customization (lighting and furnace recommendations), compared to the omitted group, other equipment, which required the most customization among the categories (Fig. 1, ‘Other equipment’ panel). These results are in agreement with the raw data, reported in Supplementary Table 10b,c, which shows better-managed firms have higher rates of post-treatment adoption (column (6)).
One potential channel by which management practices could influence adoption is if they increased managers’ awareness and access to data about energy use, allowing consultants to estimate the energy savings of a specific recommendation. Although we strongly encouraged the consultants to provide their best estimate of the available savings and costs for each recommendation, they expressed that the task was very demanding, with detailed reasons explained in Methods. However, to ensure the financial attractiveness of recommendations in general, we asked the consultants to provide recommendations that were expected to be paid back within three years. Column (3) of Supplementary Table 12 shows that on average, a one standard deviation change in management z-score was associated with a 19% increase in the probability of receiving a savings estimate for a particular recommendation category. It should be noted that beyond documenting a common positive relationship with management practices, we are not able to distinguish the effect of receiving a savings estimate from the effect of management practices on adoption. This means that we cannot rigorously estimate the effect of savings estimate availability on recommendation adoption because adoption can also be directly affected by management practices.
Finally, we consider whether specific management practices are correlated with recommendation adoption, by replacing the general management score with each management sub-score in the regressions predicting adoption in Supplementary Table 13. Here we find that monitoring, targets and incentive scores are all positively correlated with adoption. There is no significant relationship for lean operational practices, although the coefficient is also positive. Supplementary Fig. 5 shows the contribution of each sub-score using a random forest method similar to Distelhorst et al.52, which further affirms the importance of monitoring and only a minor role of lean practices. This is consistent with prior findings that lean practices are not associated with improved environmental performance26,52. This is also in line with cross-sectional evidence that lean measures are uncorrelated with energy intensity in Bloom et al.26.
Why were firms with better generic management practices more likely to adopt energy efficiency recommendations? One possibility is that management practices, both general and energy specific, are complementary, consistent with evidence found in Zhu et al.30. We examine correlations between the generic and energy-centric management practice measures for our sample in Supplementary Table 14. We find strong positive correlations between general management practice scores and multiple measures of energy management, including energy-management practice scores derived from the average of ten questions in our baseline energy-management survey (0.53), whether the firm has adopted standards (0.42), whether the firm has a dedicated energy-management team (0.43) and whether the firm has adopted energy-saving targets (0.35). Firms may have endogenously developed energy-management capabilities to limit the impact of energy cost on their economic performance. These firms’ energy-centric practices may also have translated into receptivity to energy-related advice from the consulting team, even when the potential for impact was limited.
Management practices and recommendation impact
Next, we focus on the impact margin, which is the actual change in energy use or unit energy cost that resulted from any technical, process or behavioural changes undertaken by the organization in response to the intervention. In most settings, adoption is often interpreted as leading to energy savings that are calculated ex ante but rarely measured ex post. Our setting allows us not only to measure impact ex post but to use the detailed operational data we collect to localize it to specific recommendations and associate them with particular management disciplines.
We first examine the pre-treatment correlation between management score and both electricity unit cost and use. We find that a one standard deviation change in management score is associated with a 7% lower unit cost of electricity prior to treatment (column (1) in Supplementary Table 15). We find a negative but insignificant relationship between management score and electricity use before treatment (column (2)). To explore the robustness of our results, we exploit our 91-firm sample, shown in Supplementary Table 16. We find that patterns are similar. We do not find any evidence either that ‘better-managed firms’ (firms with scores above the median, compared to firms with scores below the median categorized as ‘poorly managed firms’) were growing faster before treatment, which could potentially cause a diminished effect on electricity use. The pre-treatment revenue growth rates (that is, revenue in 2015 divided by revenue in 2013) for the two groups of firms exhibit no statistically significant differences, as shown in Supplementary Table 17.
Focusing on the impact of our treatment on unit cost, we turn to column (3) in Table 1. The interaction term of treatment with management z-score is positive and significant at the 10% level. We find no significant coefficient on the same interaction term in the quantity regression in column (4). Limiting the interaction to just the bottom quartile of low-scoring firms, we find that this group is largely responsible for the unit cost effect, driving the overall unit cost reduction (significant at the 1% level): on average, firms in the bottom management quartile realized a unit cost reduction of 17% on average (column (5)), which is statistically significant at the 5% level. Being in the top management quartile, by contrast, was not associated with any unit cost reduction (column (6)). The results are qualitatively consistent when using the median of the management score as the dummy in our interaction term, as shown in column (3) of Supplementary Table 18.
To examine whether specific recommendation categories were driving the observed effects, we interacted a dummy for recommendation adoption by category with treatment status. We found that one recommendation, transformer adjustment, had large effects, responsible for a 16% reduction in electricity unit cost on average (column (7)). This recommendation was applicable to both groups when the consultants presented it, but it was disproportionately implemented, and its effect on unit cost largest, among the low-scoring firms. It is likely that only firms that would face a lower electricity bill made the adjustment. This is consistent with the large magnitude of the local average treatment effect (LATE) reported in column (8), which captures the average effect of adopting the transformer adjustment recommendation, consistent with this margin as the primary driver of the unit cost change. When we examine the correlation between management scores and electricity unit cost or use two years after the intervention (in 2019 and 2020), we no longer find a significant relationship, as shown in Supplementary Table 19.
A deeper examination of interview transcripts and adoption data suggests why the transformer adjustment recommendation proved so impactful. Transformer adjustment in practice could involve one of three actions: first, purchasing a new transformer more closely matched to the firm’s maximum load; second, optimizing transformer configuration (in cases where firms had multiple transformers) to use only those matched to maximum load; and third, calling the grid company and reporting maximum load more accurately, so that the grid company could adjust the fixed portion of the tariff accordingly (many firms were paying on the basis of higher maximum load than they were actually using). As shown in Supplementary Table 1, firms paid a fixed fee in proportion to either transformer capacity or reported maximum load (a firm can choose either of these two fee bases). A manager could simply lower this tariff by taking the third option and more accurately reporting the firm’s maximum load. This option was by far the easiest of the three for most of the firms in our sample to implement. Many of them immediately requested the recommended adjustment. Given that these changes would be expected to take effect right away, it is perhaps not surprising that the unit cost impact of the treatment quickly became visible in the event study figure (Fig. 2a).
As in the case of adoption, we can investigate whether specific management practices are associated with the treatment effect on unit cost. Results are shown in Supplementary Table 20. We find that monitoring practices have the strongest association, while targets and incentives show weak significant relationships. Operations (including lean) practices are uncorrelated with the observed unit cost reduction, consistent with our observations for adoption. As for adoption, we find that higher monitoring, target setting and incentive practice scores are associated with smaller treatment effects, perhaps because the unit cost was already lower for these firms before the treatment, as shown in Supplementary Table 21.
Conclusion and discussion
Our results examine the potential and limitations of energy audit interventions to influence energy outcomes in developing country manufacturing firms. This research advances prior work in several ways: first, by using an experimental set-up in which access to a tailored energy auditing intervention is exogenous, permitting causal estimation of its effects on firms; second, by quantifying how the treatment’s adoption and impact interacted with structured management practices in a relatively homogeneous, collocated set of firms; third, by exploring which practices drive the pre-treatment relationship between management practices and energy outcomes; and fourth by identifying which recommendations contributed most to the observed impacts. Below, we discuss the major implications of our findings.
First, our findings show how management practices interact with firms’ baseline energy use and how managers respond to energy audit information. Specifically, we find that firms with higher management scores increased adoption, while firms with lower management scores reported higher unit costs of electricity at baseline and that this gap closed after our intervention. Well-developed management practices may ensure energy audit information reaches firm decision-makers, although the result may be actions aligned with firm objectives such as cost savings and productivity. Impacts of the audit on energy efficiency are thus ambiguous and depend on alignment with firm objectives.
Second, our findings show that the impact of an audit can be highly uneven, and potentially even offsetting, across recommendations. The menu of recommendations in our treatment closely resembles real-world energy audit and consulting services that target both higher energy efficiency and lower energy expenditures. Whereas interventions often assume proportional and directionally similar impacts on cost and use53,54,55, our findings show that impacts on energy unit cost and energy use do not always move together. Moreover, studies that take energy prices as exogenous may overlook the potential for management or other practices to affect prices endogenously, generating economic advantages but offsetting reductions in correlated emissions. The impact of our intervention was found to be driven by a single recommendation category, transformer adjustment, which led to reductions in energy unit cost but not energy use (or GHG emissions). The effect on unit cost due to this recommendation category may have been so large that it eclipsed any combined effect of the other recommendations in improving energy efficiency and/or reducing energy use. This finding underscores the importance of recognizing the potentially heterogeneous and interactive effects of the various components of energy audit interventions.
Third, our findings suggest that despite high expectations for energy efficiency to reduce firms’ energy-related CO2 emissions5,6,33, energy audit interventions may preferentially deliver energy cost savings but achieve more limited physical energy use reduction, especially in emerging market settings, by narrowing the ‘energy-management gap’28. A firm’s emissions of CO2 are a function of output scale, energy use quantity and the CO2 intensity per unit of physical energy used56. In settings such as ours, where energy efficiency information and incentives are generally low, and firms face limited external pressure to reduce physical fossil energy or greenhouse gas emissions (for example, via an emissions price), the effects of implementing cost-saving recommendations may dominate.
Our findings support the notion that a firm’s response to an energy audit programme may depend on its broader objectives and institutional constraints. Energy audit interventions may not be a silver bullet for reducing energy use and associated GHG emissions. Structured management practices may increase managers’ willingness and ability to try out recommendations that are potentially economically and environmentally beneficial. However, the extent of physical reductions achieved may depend on a broader range of factors. More research is needed to understand whether a price or binding constraint on CO2 emissions would harness managerial ability to reduce physical energy use. In this respect, internal practices and external constraints such as climate policies could work in tandem to enable managers to cost effectively reduce CO2 emissions.
Methods
Sample selection
We worked closely with our local partner, Shandong Energy Conservation Association (SECA), in Jinan City, Shandong Province, to select firms and implement the training. SECA is a non-governmental organization that arranges energy-saving training and provides energy-saving consulting for industrial and commercial firms. A team from SECA obtained a full list of ‘above-scale’ (annual revenue higher than 20 million yuan in any year between 2010 and 2015) metal processing firms from Jinan City that were actively producing in the spring of 2016 (231 firms in total). All managers gave their informed consent for inclusion before they participated in the on-site interview, the intervention itself or provided their energy use information. The intervention was conducted in compliance with the US Federal Policy for the Protection of Human Subjects, with the approval of the Massachusetts Institute of Technology (MIT) Institutional Review Board. We interviewed on site the firm’s highest-ranking manager available and successfully obtained general and energy-management scores and energy use data for 100 out of the 110 firms that agreed to a visit. If the firm had an energy manager, they joined for the energy-management interview. Our study involved a baseline survey of these 100 firms in 2016, followed by a randomized experiment involving a subset of 48 firms from the original surveyed group, implemented between 2017 and 2020.
Firms in our sample fall within a 50-mile radius and are spread across Jinan City’s eight districts/counties, making all firms comparable on dimensions of local climate (which can substantially impact energy use), governance at the city level and above (thus policy environment is common to all firms) and market conditions (including electricity price schedules and labour force composition). Jinan City also has a distinct industrial history, as some manufacturing processes and product types have remained unchanged for thousands of years. Firms we visited represented seven two-digit industries (in China’s industry classification system, each industry is designated with an industry code, of which the first two digits refer to major industry types): 31—ferrous metal smelting or rolling, 33—metal products, 34—general equipment, 35—special equipment, 36—automobile, 37—other transportation equipment and 38—electrical equipment. These industries were chosen because electricity was their main energy source for production. All of the firms in our sample are served by North China’s electricity grid, which has a relatively high CO2 intensity per kilowatt-hour (Supplementary Fig. 6).
Of the original set of 100 firms for which we obtained both management scores and energy use information, we dropped eight outliers that did not contain any of the three energy-intensive process categories related to metal processing: machining, casting and forging; we also dropped one firm that reported dramatic shifts in energy intensity between 2014 and 2015. We analyse the data collected on the remaining 91 firms in the descriptive part of our analysis. Many of the firms in our sample manufacture multiple products using a fixed set of production equipment that is powered by electricity. Two-thirds of our 91-firm samples consisted of single-plant firms. We solicited firms’ willingness to participate in our randomized controlled trial and cut off intake after 48 firms responded. The 48 firms at least shared one energy-intensive process, metal machining. Descriptive statistics for the 91- and 48-firm samples in 2015 from the baseline survey are shown in Supplementary Table 22. Comparing these two samples, we do not see any statistical differences for a range of characteristics.
Although we selected our sample from metal processing firms from Jinan City, Shandong Province, we show that they are not different in a statistically significant sense from a larger sample of above-scale manufacturing firms in China, strengthening the external validity of our findings. To assess potential differences, we use the Chinese Industrial Enterprise Census57 that covers all the above-scale industrial firms in China and choose firms from the same sectors as our sample firms to compare. We focus on the comparison in terms of revenue. In Supplementary Table 23, we show that the mean revenue in 2013 of the 91-firm sample is not significantly different from the census sample (12,811 firms), which includes firms from the same seven sectors; and the mean difference is not statistically significant either, even if we compare our firm sample to a broader sample that assembles the 36,708 firms in the census from all the manufacturing sectors (excluding the energy-intensive sectors, defined by the National Bureau of Statistics (2016)58, as these sectors were targeted by major existing energy and climate policies and not within scope for this study). We also find that the distribution of electricity intensity of the 91-firm sample (mean: 0.03 kWh per yuan; standard deviation: 0.04 kWh per yuan) largely overlaps the electricity intensity distributions of the seven metal processing sectors (0.01–0.10 kWh per yuan, calculated by dividing sectoral electricity consumption from the China Statistical Yearbook59 by sectoral output value adopted from the 2015 input–output table60). Therefore, interventions designed for firms in our sample and related findings may apply to these broader industries with similar characteristics. In addition, our sample of manufacturing firms is comparable with populations of firms in China and other emerging economies in the same industry on measures of general management8 and energy-specific management34. Moreover, the size and co-location of our sampled firms are similar to previous studies focused on the role of internal practices9,61.
Randomized experiment
Among the 48 firms in the baseline sample, we generated matched firm pairs as described in Bruhn and McKenzie62. Firms were matched using the Mahalanobis distance, which is computed on the basis of electricity use quantities (kWh), sales (yuan), electricity intensity (in quantity terms, kWh per yuan), ratio of sales in 2015 to sales in 2013, management score and energy-management score. We randomly picked one firm from each pair as the treated firm. Information about our experimental protocol can be found on the American Economic Association Randomized Controlled Trial Registry63. We conduct power calculations using the baseline data (for 2013 to 2015) by assuming a hypothetical reduction in energy expenditure or use for treated firms in all 12 months of the year 2015. We ran 1,000 iterations and randomly dropped four firms in each iteration to allow for possible sample attrition. Our data can detect a 3% reduction in electricity unit cost or a 9% reduction in electricity use at the significance level of 10% with a probability of 80%.
With the help of SECA, we recruited local energy-management experts to perform the intervention. These experts were specialists in the types of equipment and processes used in our sample of metal processing firms. The energy audit treatment was administered in two waves, one running from June to August 2017, and the other from October 2017 to December 2017. Each treated firm received a one-day site visit from two experts. These experts gathered information in discussions with firm managers and then examined energy-intensive equipment and production processes for opportunities to reduce operational energy requirements and electricity bills. The experts then presented preliminary recommendations and best practices for energy management to firm managers verbally at the end of the visit. Within one month of the visit, the experts followed up with a formal document that included an itemized list of recommendations and energy-management practices that were tailored to firm conditions. Two rounds of follow-up visits to evaluate the adoption of recommendations were performed in spring 2018 and spring 2019, and end-line surveys on electricity use for 2018 and 2019–2020 were collected in spring 2019 and fall 2021, respectively. Two treated firms and three control firms dropped out of these end-line surveys due to unstable production or major business changes, leaving 43 firms for estimation of treatment effects. The t-test on key variables between the 48-firm sample and the post-attrition 43-firm sample in Supplementary Table 24 shows no statistically significant differences. The distributions of 43 firms’ general management scores and energy-management scores are shown in Supplementary Figs. 7 and 8. To strengthen the robustness of our adoption results, in the fall 2021 our team visited 18 of 21 control firms to assess the applicability and prior adoption of the same menu of recommendations.
For each recommendation, we strongly encouraged the experts to provide their best estimate of the available financial savings for each recommendation. We also asked them to provide their best estimate of the cost of adoption (initial investment). However, our experts expressed that they found this second request difficult and very demanding. First, experts cited that equipment and material prices were highly volatile. They also indicated that the labour costs associated with adopting the recommendation were highly uncertain, making it challenging to provide an accurate cost estimate without misleading the firm. Second, for recommendations highly tailored to specific equipment and production processes, experts found estimating savings more difficult, as there was no template or experience to work from. For example, an expert could suggest that insulating a furnace could save substantial energy, reducing ambient heat losses. However, if a firm had never measured the heat efficiency of the furnace (which was common in our sample), estimating the improved efficiency or cost savings was impossible. Therefore, we were only able to obtain estimated savings from the experts for a subset of recommendations, which we provided to firms when available. Otherwise, we indicated to the firm that an estimate was not available. As a general rule of thumb, and to increase the likelihood that recommendations would be considered, experts focused on providing recommendations that were expected to be paid back within three years based on their experiences with similar recommendations adopted in other firms.
Recommendations were categorized into six groups based on the equipment or end-use targeted for efficiency improvement. In Supplementary Table 10, we summarize the number of recommendations provided to treated firms and the applicability, pre-treatment adoption and availability of information about the estimated energy savings within each of the six groups. The first five categories of recommendations are listed roughly following the order from the most bespoke to the most standard, reflecting differences in the customization required and firms’ self-reported feedback on the technical and behavioural complexity of implementation. For example, most lighting system recommendations are relatively standard because they typically only involve replacing old inefficient light bulbs with more energy-efficient light-emitting diodes, whereas recommendations related to the configuration of the transformer are generally less standard. This category includes changing to another electricity rate plan that would be less costly for the firm. The rate plan options are the same for all firms, but the optimal electricity tariff depends on a firm having a detailed understanding of its own patterns of energy use. Specifically, making the most of a rate plan update further requires firms to optimize their own parameters, for example, transformer capacity or maximum load, which must be reported to the local utility company. This category of recommendations explicitly targets unit electricity cost. Recommendations grouped in the category ‘others’ target energy-intensive equipment that is uncommon or belongs to specific vintages, for example, a decoiler machine or a shot blasting machine. A manager would need to locate customized parts or components if she wished to retrofit the equipment. An example of detailed recommendations provided to one of the firms in our sample is shown in Supplementary Table 25. The target and expected outcomes of each category of recommendations are explained in Supplementary Table 26. We further provide a summary of all the recommendations delivered to the 24 treated firms in Supplementary Table 27.
Baseline data collection and preparation
The general management practices questionnaire followed the methodology of the World Management Survey very closely8, with minor adjustments to localize concepts to the Chinese context. To make this information more accessible, we include the World Management Survey questionnaire used for the general management survey in Supplementary Table 28. The survey included 18 questions in four categories (operations, targets, monitoring and incentives, that is, human resource practices), each of which was scored on a 1–5 scale by the interviewer. Sub-scores for each of the four categories are averaged to generate one general management score per firm. Scoring outcomes were not shared with the interviewee. Team members attended a one-day orientation on survey administration, followed by a mock interview round to ensure consistency in teams’ understanding of the survey questions and scoring procedure. Starting with a Mandarin Chinese translation of the management survey based on Bloom and Van Reenen8, question translations were vetted for accuracy of meaning and potential for misinterpretation by multiple Chinese speakers within the global consultancy, the Massachusetts Institute of Technology and local Shandong teams. Before fielding the survey, the team performed a dry run of the full interview with one company. Adjustments were made to reflect managers’ feedback and to shorten the energy-management questionnaire to keep the entire process under one hour.
We collected our baseline survey over two months in March and April 2016. The two-part survey covering management and energy management was designed and administered by a collaborative team including an analyst, two associates and one junior partner from the China offices of a global management consultancy and researchers from MIT and Tsinghua University. The team administered the survey with logistical support from SECA. Over a period of five weeks, two groups (each comprised of one MIT or Tsinghua researcher and one consultancy analyst or associate) conducted on-site interviews on general management and specialized energy-management practices in Mandarin Chinese at all 100 firms. The teams visited two to four sites per day, depending on travel time between sites, and interviewed one member of the company’s general management and, when available, one energy specialist. Completing the full interview (including its general management and energy-management components) required approximately one hour.
The energy-management questionnaire incorporated specific practices required by China’s national standard for energy-management GB/T 23331, which closely follows the international energy-management standard ISO 50001. Questions attempted to measure the firm’s general awareness and experience with energy-saving measures and the existence and extent of the company’s internal energy-management system. A copy of the energy-management questionnaire is provided in Supplementary Table 3. Both general management scores and energy-management scores are calculated as unweighted averages of scores on individual questions. In Supplementary Tables 29 and 30, we have included descriptive statistics for sub-scores of questions. Scores were converted to z-scores for ease of interpretation in regression analysis.
In parallel, monthly electricity use and production information was obtained through periodic surveys disseminated by SECA. We collected these data in early 2016 for the years 2013–2015 for the 91-firm sample and for a further five years (2016–2020) for the 48 firms included in the experiment in three waves, once during the first half of 2018, again in the first half of 2019 and then again during the second half of 2021. Electricity consumption data, including physical use in kilowatt-hours and expenditure in value terms, were obtained at monthly resolution for all eight years. Firms were notified that raw data provided would be deidentified before use in our analysis. SECA is not involved in regulatory enforcement and regularly interacts with government offices at the county level and with firms directly, leading to a high degree of trust and raising the chances of obtaining data that represent an honest collection effort. Firms’ submissions were cross-checked against metered electricity bills for a subset of firms to ensure consistency. We were unable to verify reported consumption of other energy types, which represented a modest share of the overall total. These energy types were largely used for space heating and could not be substituted by electricity. Therefore, we focus on electricity in this study. None of the firms in our 48-firm sample had any unrecorded electricity use (for example, self-generation).
Empirical methods
Impacts of the intervention
We estimate the treatment effect on the firms’ electricity unit cost or use with the following specification:
where the dependent variable (log ({y}_{im})) denotes the log unit cost (yuan per kWh) or quantity (kWh) of firm i in month m. The binary variable tm is the treatment status, equal to 1 for post-treatment months and zero otherwise. The binary variable treatmenti indicates whether a firm is in the treatment group. The treatment effect is estimated by the coefficient β1. γi and τt are firm fixed effects and time (month) fixed effects, respectively. Results are displayed in column (1) (for unit cost) and column (2) (for quantity used) of Table 1.
Columns (3)–(6) further explore the interaction between treatment effects and management scores using the following specification:
The following specification is adopted to distinguish the top and bottom quartiles:
where mgmt_zscorei is the management z-score and tp/bm_mgmt_zscorei is a dummy representing whether a firm has a management z-score in the top quartile (tp—high scoring) or the bottom quartile (bm—low scoring). β2 is the estimated interaction between treatment effects and management scores. In columns (7) and (8), we zero in on the effect of the adoption of transformer-related recommendations. Column (7) interacts treatment timing with the treatment group and a transformer adoption dummy that equals 1 for firms that adopted the transformer-related recommendation and zero otherwise. Column (8) shows the result of the local average treatment effect (LATE) estimation using an instrumental variable regression specification based on equation (1). Here treatmenti now equals 1 for firms that adopted the transformer-related recommendation and zero otherwise. It is instrumented by a binary variable indicating whether a firm is in the treatment group. If we consider that the treatment effect on the unit cost is mainly driven by the adoption of transformer-related recommendations, the treatment effect estimated in column (1) can be considered an intent-to-treat (ITT) effect. This approach is similar to experimental settings in Fowlie et al.19 and Couture et al.64.
We conduct robustness checks to validate our results for the log unit cost treatment effect using the Ibragimov and Mueller65 procedure and a permutation-based test, as described in greater detail in Bloom et al.9. First, Ibragimov and Mueller65 propose a robustness test that is useful for small samples with a large number of repeated observations, as is the case in our setting. On the basis of Ibragimov and Mueller65, we estimate the effect for each firm separately and then conduct a standard t-test to compare the grouped means between the treated firms and the control firms. This method requires that the firm-by-firm parameter estimates be independent and distributed Gaussian, which can be justified by the large number of repeated observations. The p value of the Ibragimov–Mueller t-test is 0.02, and the calculated critical value in the permutation-based test is 0.03, so we reject the null hypothesis at the significance level of 5% in both tests, supporting the robustness of our results.
Second, we employ a permutation-based test that uses the Wei–Lachin statistic as described in Greevy et al.66. Our dataset for the impact evaluation included 22 treated firms and 21 control firms. If there is no effect of treatment, each possible candidate value of the Wei–Lachin statistic will occur with the same probability, regardless of which 22 firms among the 43 are treated. To establish the empirical distribution of the Wei–Lachin statistic, we conduct 1,000 permutations that randomly assign 22 treated firms and 21 control firms and calculate the Wei–Lachin statistic for each permutation. We compute a critical value of the permutation-based test and reject the null hypothesis of no treatment effect if the real Wei–Lachin statistic exceeds the predicted value for its corresponding quantile.
We conduct an in-space placebo test to assess the robustness of the estimated treatment effects on the unit cost of electricity using the ‘DIDPLACEBO’ package in Stata48. ‘DIDPLACEBO’ automatically captures our main regression and then estimates again with the same command using a fake treatment variable to yield a placebo treatment effect. Specifically, it implements 500 repetitions, and in each repetition, firms were randomly selected as fake treatment units. After many repetitions, a distribution of estimated placebo effects is obtained. For statistical inference, the estimated treatment effect is then compared against the distribution of estimated placebo effects to calculate two-sided, left-sided and right-sided p values.
Additional robustness checks are conducted by trimming the 43-firm sample using different approaches. Specifically, we drop outliers that are above the 95th and below the 5th percentile of the firm size (revenue in 2015), electricity intensity and management scores and run the main regression again.
We also plot an event study graph showing unit cost and total electricity use outcomes by time for treated firms relative to control firms using the following specification:
where ({I}_{im}^{n}) is a dummy variable. If the gap between the month of observation m and the time of receiving the treatment for firm i is n, ({I}_{im}^{n}) equals 1; otherwise, it equals 0. Other variables are defined similarly to those in equation (1). We take one month before receiving the treatment as the reference period, enabling us to observe the differences in unit cost and total electricity use between treated firms and control firms in other periods compared with the reference period.
The management–adoption relationship
We estimate the relationship between management practices and adoption (or receiving a saving estimate) using the following specification:
where Dependentij equals 1 if the recommendation in category j provided to firm i is adopted (or with a saving estimate) and zero otherwise. Here a recommendation for a category is considered adopted if a firm self-reported implementation of any of the measures in this category provided by the consulting team. mgmt_zscorei is the management z-score or management sub-z-scores (operations, monitoring, targets and incentives), Xi denotes firm control variables, including firm size, firm age and state ownership dummy and γj denotes recommendation category dummies. We choose the recommendations targeted at ‘other equipment’ as the default group or the ‘omitted group’ for the categorical variable (‘Recommendation category control’) that indicates to which group a specific recommendation belongs.
Pre-treatment baseline correlation
We examine the pre-treatment correlation between management score and both electricity unit cost and use with the following specification:
where the dependent variable Dependentit is either electricity unit cost, quantity of electricity use or electricity intensity of firm i in time period t, mgmt_zscorei is the management z-score or management sub-z-scores (operations, monitoring, targets and incentives), Xi denotes firm control variables, including firm size, age and state ownership dummy and τt denotes time dummies (month for electricity unit cost and quantity of electricity use, year for electricity intensity).
The role of specific practices
As in the case of adoption, we can investigate whether specific management practices are associated with the treatment effect on unit cost using the following specification:
where mgmt_sub_zscorei is management sub-z-score (operations, monitoring, targets and incentives).
Impacts on other outcomes
We estimate the treatment effect on the firms’ electricity intensity, revenue and labour productivity on a yearly basis with the following specification:
where the dependent variable (log ({y}_{it})) denotes the log revenue (yuan), electricity intensity (kWh per yuan) or labour productivity (yuan per employee) of firm i in year t. The binary variable postt is the treatment status, equal to 1 for post-treatment years (t ≥ 2017) and zero otherwise. The binary variable treatmenti indicates whether a firm is in the treatment group. The treatment effect is estimated by the coefficient β1. γi and τt are firm fixed effects and time (year) fixed effects, respectively.
The following specification is adopted to distinguish potential differences between better-managed firms and poorly managed firms:
where better_managed_firmsi equal to 1 if management score of firm i is above the median, and zero otherwise.
Reporting summary
Further information on research design is available in the Nature Portfolio Reporting Summary linked to this article.
Responses