Governance and resilience as entry points for transforming food systems in the countdown to 2030
Main
Achieving transformative change in food systems is necessary to meet the Sustainable Development Goals (SDGs), Paris Agreement targets, Global Biodiversity Framework and many other global goals1,2. Food systems impact all sectors, populations and ecosystems. Consequently, understanding and tracking transformation is particularly important. The Food Systems Countdown Initiative (FSCI) provides annual monitoring updates of systems-wide indicators across five thematic areas: (1) diets, nutrition and health; (2) environment, natural resources and production; (3) livelihoods, poverty and equity; (4) governance; and (5) resilience3,4. This Analysis presents the first update relative to the 2023 baseline3 with new quantitative analysis of time trends since 2000 and qualitative assessments of interactions between indicators. Interactions between indicators mean that changes in one area (for example, diets) can (directly or indirectly) affect others (for example, environment)5,6. Interactions may present tradeoffs or synergies and illuminate entry points for governance action to steer food systems towards desired outcomes or to unlock roadblocks to change.
Food systems span multiple domains, actors, governance systems, spaces and time horizons, and decisions may be made without structured, systematic consideration of these multiple dimensions or the diverse outcomes to which food systems contribute. For example, policies targeting short-term objectives to ensure calorie sufficiency may not consider the long-term impacts of large-scale monocropping on biodiversity or pest adaptation nor the impacts of staple-focused policies on nutrition5,6. As a result, many food systems challenges have arisen owing to unintended consequences and systemic conflicts among multiple objectives. For example, maximizing crop and livestock productivity through intensive systems has not only led to increased food availability but also contributed to environmental degradation, declining diet quality for some populations and increased inequality between small- and large-holder production systems7,8,9,10,11,12. Part of understanding, addressing and preventing these pernicious unintended outcomes is making food systems’ interactions more explicit so that they can be directly managed and governed.
Governance, therefore, has a specific role in navigating these interactions, especially through decision-making processes that consider potential consequences across domains13. Appropriate governance for food systems transformation has been gaining recognition on the global political agenda. Recent analysis of country progress along national food system transformation pathways shows 70 countries reporting efforts since 2021 to strengthen food systems governance14. Governance impacts food system transformation through multiple channels. Corporate concentration and influence on policymaking through lobbying and campaign contributions can bias governments against policies that are important for food environments and diets15,16,17. Political polarization and electoral turnover can impede policy momentum and detract attention from long-term policymaking18. The countries with weak institutional capacity may be unable to manage risks from economic or climate shocks, thereby affecting their ability to drive food systems change and undermining prior gains19,20. Geopolitical conflicts have cross-jurisdictional impacts on food systems, as demonstrated by the Ukraine war’s impact on global food security21. Ongoing civil conflict also stresses global humanitarian resources, especially food assistance, and strains relationships that shape the multilateral system on which global humanitarian systems depend22,23. In summary, governance is cardinal to accelerating transformative change. The thematic focus of this Analysis is on governance indicators in both the monitoring update and the analysis of interactions, on the premise that governance quality is linked to whether synergies are enabled, and tradeoffs are identified and managed.
To identify the network of interactions across food systems, we build on growing literature on food system interactions from multiple disciplines focused on food, environment, water, health, socioecological, political and economic systems12,24,25,26,27. These studies underscore that data limitations, lack of interoperability and gaps across domains, geographies and scales pose challenges to understanding complex food systems interactions. Yet the imperative for urgent, widespread transformation can not delay action; societies and individuals must make decisions despite uncertainty and incomplete information. In this context, we use qualitative expert elicitation to identify where theory supports a direct causal relationship between each pair of indicators at the global level12. Recognizing the foundational role that governance plays in navigating these interactions, we ground these global results through two related analyses focused on interactions involving governance indicators. First, in-country qualitative expert elicitations explore how interactions involving governance have become more or less important for food systems change over time in the context of Ethiopia, Mexico and the Netherlands. It highlights different potential synergies, tradeoffs and entry points for action and how considering interactions explicitly helps to identify trajectories for change relevant to each country’s unique context and food system transformation pathway goals. Second, a systematic literature search (automated search with manual screening) suggests where there is likely to be conceptual validity for these relationships involving governance indicators and highlights priority evidence gaps to drive change.
Results
Global trends of the FSCI indicators with time series data reported for 2000–2022 update the static view presented in the global baseline3 with all available new data points and trends over time (Fig. 1). Thirteen indicators use survey data collected at different times per country (or different countries per year) and, therefore, can not be analysed for trends (including all diet quality, social protection, female landholdings, child labor and coping strategies indicators). Twenty of the remaining 42 indicators have changed in a desirable direction (positive or negative defined in Supplementary Table 1). The 15 indicators desirably (and statistically significantly) increasing over time are (in order of magnitude of the average annual percentage change over the period analysed from greatest to smallest): access to information, mobile phone use (an infrastructure and connectedness proxy), safe water access, conservation of animal genetic resources, social capital, fruit yield, vegetable availability, beef yield, government effectiveness, conservation of plant genetic resources, milk, vegetable and cereal yields, fruit availability and nitrogen use efficiency. The five indicators desirably declining are (in order of greatest to least average annual percentage change): emissions intensity for beef and milk, food supply variability, the prevalence of undernourishment and the percent of the population who can not afford a healthy diet. Indicators with undesirable trends (7/42) are the cost of a healthy diet (reflecting inflation), the proportion of the population experiencing moderate or severe food insecurity, rural underemployment, pesticide use, food price volatility, civil society participation and government accountability. Remaining indicators (12/42) show no change (coefficients of zero), which is also undesirable (see Supplementary Table 4 for full results, Supplementary Figs. 1–5 for regional variation in time trends and Supplementary Figs. 6–21 for data for all countries, by region and income group.

Coefficients of a linear (least squares) regression of the indicator on time (year) for all indicators with data from more than 1 year. Indicator data (response variable) are normalized by minimum–maximum scaling and multipled by 100 before regressing on the variable year with country fixed effects; the original units are defined in Supplementary Table 1. The results are interpreted as average percentage change in the indicator per year over the period analysed. Note the number of country-years differs per indicator. Change defined as desirable if the results per indicator meet the following criteria: (1) the trend line is statistically significantly different from zero, (2) the coefficient estimate is >0 when rounded to the nearest tenth and (3) the sign agrees with the desirable direction of change (defined in Supplementary Table 1). Conversely, the estimates were labelled as changing in the undesirable direction if they were statistically significant with a non-zero coefficient when rounded to the nearest tenth and a sign opposite the desirable direction of change. Coefficients that round to zero, even if statistically significant, are classified as no change, since the magnitude of the coefficient is not practically meaningful. The regressions are weighted by the weighting variables defined in Supplementary Table 1. The sample size (number of countries and years) per indicator included in the analysis is provided in Supplementary Table 4. Excluded indicators do not have time series data and include All-5, minimum dietary diversity (women and children), soft drink consumption, zero fruits or vegetabls (adult and children), NCD-protect, NCD-risk, functional integrity, fisheries health index, social protection coverage, social protection adequacy, child labour, female landholdings and reduced coping strategies.
Region-year marginal effects—defined as an indicator’s predicted value at each year-region combination, from a linear regression interacting region and year, allowing slope and intercept to vary by region (see ‘Trend analysis’ section in Methods)—help explain the global results (Supplementary Figs. 1–5). Of the indicators changing in a desirable direction, some show relatively uniform trends across regions, including access to safe water, vegetable availability, percent of the population who can not afford a healthy diet, fruit, cereal and milk yields, emissions intensity for milk, access to information, mobile phone subscriptions and plant genetic resources conservation, suggesting common trends in the desirable direction even when starting from very different starting points. For other indicators, the global trend moves in the desirable direction despite some regions heading away from it. These indicators (and the region(s) trending undesirably) are the prevalence of undernourishment (Northern Africa and Western Asia), fruit availability (Oceania), beef yields (Southern Asia), nitrogen use efficiency (Central Asia, Sub-Saharan Africa and Oceania), emissions intensity for beef (Sub-Saharan Africa), government effectiveness (Northern America and Europe, Oceania, Latin America and the Caribbean, Sub-Saharan Africa), conservation of animal genetic resources (Northern America, Europe and Oceania), social capital (Northern Africa and Western Asia, Latin America and the Caribbean and Oceania).
Focusing on the governance theme, one indicator that illuminates how countries are combatting the multiple forces—including corporate influence—that result in unhealthy food environments is the presence and type of health-related food environment policies in place16,28,29,30. Some countries have implemented economic policies, such as taxes on certain foods and ingredients or subsidies for healthier items31. Others use regulatory instruments, such as restricting what can be served, sold or marketed to children, requiring front-of-pack labelling and product reformulation28. Some countries use multiple policies. For example, Mexico taxes added sugars and requires warning labels on products exceeding healthy limits for added sugars and energy density, among other policies32,33. In the case study with experts in Mexico, the experts identified that health-related food environment policies have accelerated the reduction of soft drink consumption and sales of ultraprocessed foods (Supplementary Fig. 25). Robust empirical evidence from across settings links these types of food environment policy to desirable diet, nutrition and health outcomes16,28,34,35,36.
We find that most countries are using economic and/or regulatory tools focused on improving the healthfulness of food environments, except for the majority of sub-Saharan Africa and many Central Asian countries (Fig. 2). Linking this with the latest indicator status (Supplementary Table 2) suggests that inadequate food environment governance may contribute negatively to diet quality outcomes in Central Asia, where prevalence of daily soft drink (soda and energy/sports drinks) consumption is the world’s highest, more than twice the global average (43.4% versus 19.3% globally), and the dietary factors increasing non-communicable disease (NCD) risk are also highest (least desirable) in the world, with a 76% higher NCD risk score (3.7 versus 2.1 globally). Such patterns are not as evident in Sub-Saharan Africa, which could reflect greater poverty, uneven diagnosis and reporting of NCDs and/or lower overall consumption of unhealthy items due to unaffordability and lower availability of these foods. Central Asia provides a cautionary lesson regarding inadequate food systems governance, consistent with other research on nutrition and health in the region37, and illustrating the important role of interactions across indicators, in this case, the dependency of nutrition outcomes on governance actions that address the food environment37.

The presence of national health-related food environment policies classified into economic (taxes and subsidies) and mandatory regulatory (for example, front-of-pack labelling), both or none. The countries in grey have no national health-related food environment policies (see Supplementary Table 6 for further information on the classification of policies to construct this indicator).
Interactions describe how change (or lack thereof) in one indicator can be directly or indirectly influenced by change (or lack thereof) in another indicator. Understanding and articulating interactions between indicators is thereby critical to enabling and accelerating desirable change. We used three related methods to investigate these interactions: global expert elicitation, automated literature search and in-country consultations.
Global expert elicitation used qualitative expert elicitation developed and implemented by the FSCI interactions core analysis team and completed by all coauthors, organized by thematic working groups (Methods and Supplementary Table 1)3,4. Each working group assessed where there is theoretical support for a direct, causal relationship between each pair of FSCI indicators and, if present, the relationship’s directionality and logic. An adjacency matrix of proposed interactions shows the closest assessed connections between each indicator pair, with directionality from row to column (Fig. 3 and Supplementary Table 5). Figure 3 illustrates the relationships with directionality such that the indicators on the y-axis influence the indicators on the x axis. As such, the matrix is not symmetrical because causality may only go in a single direction. The adjacency matrix illuminates connections—or lack thereof—between indicators in terms of the likelihood an action will have the desired impact. Most (70 of 104, 67%) occur between indicators within a theme, while 34 (of 104, 33%) occur across themes, mostly involving diets, nutrition and health indicators. Rows that are highly connected to many columns, for example, food price volatility, are areas where change in that indicator could have broad impact across themes. We observe more governance and resilience indicators to be directly or indirectly related to most other indicators than other themes (405/490 connections for governance indicators and 376/500 connections for resilience indicators).

The proposed causal relationships between pairs of indicators as assessed by expert assessment, directed from row to column. The darkest cells show a direct causal relationship. The medium blue cells reflect an indirect relationship via one connecting indicator, and the lightest blue cells are indirect via two connecting indicators. The grey cells indicate an indirect relationship could exist via more than two indicators, or there may be no relationship. The identity cells are white. Network data underlying the figure are provided in Supplementary Table 5.
Indicators in columns with direct connections from multiple rows, for example, minimum dietary diversity, have many drivers, suggesting it may be difficult to realize desirable change with only one action, requiring coherent actions across all influencing domains. For example, reduced coping strategies are affected by the cost of food, the efficiency of production systems, rural employment dynamics, social protection, governance factors, such as recognition of the right to food and civil society participation, social capital and infrastructure (proxied by mobile phones). Improving household’s resilience to shocks so that they are not reliant on severe coping strategies, thus, requires addressing numerous factors across food systems. Further, in some cases, the causal relationship’s directionality was assessed to go both ways (104 of 2,500 total possible pairs), indicating possible feedback loops (Supplementary Fig. 22). For example, reduced pesticide use can have a positive effect on ecosystem functional integrity and in turn, increased ecosystem functional integrity can further reduce the need for pesticide use through increased biological control, resulting in a virtuous circle.
Assessing network density (number of direct connections relative to total number of possible connections) (Supplementary Table 5 and Supplementary Figs. 23 and 24) shows that three of the top five most-connected indicators are from the governance theme—civil society participation, degree of legal recognition of the right to food (the right to adequate food as defined in the International Covenant on Economic, Social and Cultural Rights)38 and government effectiveness—together with food price volatility (resilience) and yield (environment, natural resources and production). These highly connected indicators can not only serve as critical ‘nodes’ for broad change but also underscore the need for careful and ongoing measurement.
We used an automated literature review to investigate whether the global expert assessment results are reflected in scientific literature. We measured the volume of peer-reviewed literature on the identified pairs of indicators with an assessed connection as a proxy for the presence of scientific inquiry into the proposed connection. This exercise focused on interactions involving governance indicators.
The volume of literature serves as a proxy for the level of scientific knowledge available on a possible relationship, a method increasingly used in generating evidence maps39,40,41,42. We used an automated literature search with Dimensions (Methods)43 and then manually screened the results for relevance to food systems (Fig. 4 and Supplementary Table 3). Scientific literature was found for all the interactions identified with most references for interactions involving the right to food and civil society participation index, which concurs with the assessment that these indicators have the highest density of connections to others (Supplementary Table 5). Seven search pairs returned over 1,000 results, over half of which involved the right to food (Supplementary Table 3). In contrast, eleven pairs had fewer than five results in the literature search, most involving the Milan Urban Food Policy Pact (an indicator of commitment to action) or government effectiveness, indicating a possible scientific knowledge gap on causal relationships for these indicators, an area for future research. The results demonstrate that certain indicators (and their interactions) of relevance to or directly measuring food systems governance have received much less attention in scientific literature. Unlocking the potential for food systems to change, thus, requires more evidence on which governance actions are most effective in facilitating synergies and addressing tradeoffs.

The figure illustrates the number of citations returned from a literature search of titles and abstracts including both indicators for all pairs of indicators where a direct causal relationship was identified and which includes at least one governance indicator. The white space reflects the pairs without an identified causal relationship. Seven indicator pairs have >1,000 returned results (maximum of 10,166) and have been winsorized to 1,000 for visual clarity. The specific counts are shown in Supplementary Table 5.
In-country consultations consisted of facilitated discussion with experts at the country level to investigate how these global expert assessment results are viewed within a country context. Consultations involved 15–20 national food system experts in Ethiopia, Mexico and the Netherlands. This exercise also focused on interactions involving governance indicators.
Country-level expert consultations focused on assessing the relevance and trends of interactions identified at the global level for a specific country setting (Methods and Supplementary Tables 7 and 8). Ethiopia, Mexico and the Netherlands were selected as cases because they reflect three distinct regions and food system types, and they play active roles in food systems dialogues, policies and processes (although the Netherlands does not have a food system transformation pathway). In both Ethiopia and Mexico, most interactions (Ethiopia, 51 of 63; Mexico, 47 of 63) were considered highly relevant to achieving the national food systems pathway goals (Fig. 5). In the Netherlands, however, only 19 of 63 interactions were considered highly relevant. Though the democratic institutions and procedures are in place in the Netherlands, political opposition and lobbying by the food and farming sector have hindered action to address food systems concerns. The participants emphasized change in this context depends on leadership, political change and governance innovations, which are not adequately captured by the current set of governance indicators.
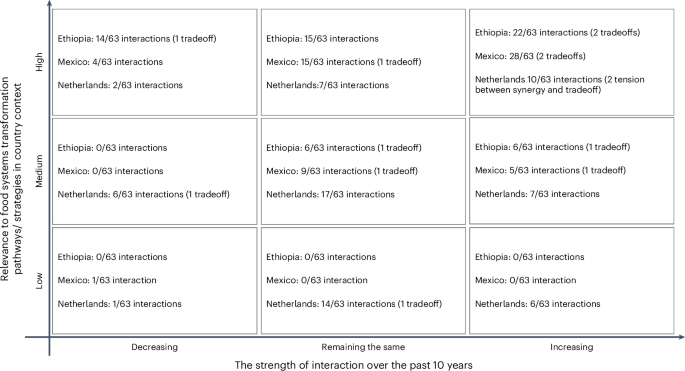
A summary of qualitative variables elicited through expert consultation. The figure synthesizes the number of interactions qualitatively plotted according to relevance to transformation towards sustainable food systems (y axis) and whether the strength of the interaction has been increasing, remained the same or been decreasing over the last 10 years (x axis). A total of 63 interactions with governance indicators, identified at global level, was plotted through national expert elicitation considering the country context. A detailed figure plotting all 63 interactions is available in Supplementary Fig. 24.
For over one-third of the interactions (Ethiopia, 22 of 63; Mexico, 28 of 63; the Netherlands, 23 of 63), the strength of the influence of the governance indicator on the corresponding indicator was deemed to have been increasing over the last 10 years. In Mexico, for example, health-related food environment policies have contributed to reducing soft drink consumption and ultraprocessed food sales (Supplementary Fig. 25). In the Netherlands, civil society participation increasingly influences environmental, health and social protection adequacy issues. A minority of interactions (Ethiopia, 14 of 63; Mexico, 4 of 63; the Netherlands, 9 of 63) have decreased in strength over time including the influence of the degree of legal recognition to the right to food on the cost of diet and social protection adequacy (Ethiopia) and government effectiveness (the Netherlands) (Supplementary Fig. 25). Experts from the Netherlands noted that increased globalization (particularly global trade, European integration and increased power of multinationals) has contributed to lessening government control over food systems and makes it harder for governments to be effective when held accountable. Experts noted optimism for European Union-level policies to potentially exert greater power than any one country. The influence of government effectiveness on the percentage of the population experiencing food insecurity has been decreasing, yet the interaction was considered highly relevant for sustainable food systems with more intervention needed.
Most of the interactions were considered to be synergies, contributing to positive change (Ethiopia, 58 of 63; Mexico, 58 of 63; Netherlands, 59 of 63). Exceptions include the degree of legal recognition of the right to food, which could have unintended consequences for land use change, agricultural water withdrawal and pesticide use (if land is converted to intensify food production). The presence of health-related food environment policies (for example warning labels) can contribute to reducing the cost of a healthy diet but only if there is adequate supply response44. We discuss how such qualitative assessment of interactions can help articulate and prioritize which interactions need close monitoring and management in ‘Discussion’.
Discussion
This paper presents the first annual update of the Food Systems Countdown to 2030 Initiative annual monitoring. It makes two contributions to the literature. The first contribution is to present systematic, reproduceable, analysis of trends in key food systems indicators since 2000, identifying 20 indicators, that span all themes, trending in the desirable direction. This signals that at least some parts of food systems are heading towards desirable outcomes. We note that the direction of desirability is considered at the global level and that nuance for some indicators is important. For example, while increasing efficiency in production (higher yields) is desirable to reduce inputs needed per unit of output, it can also lead to growth in total production, thereby consuming more total resources globally than under lower efficiency (Jevon’s paradox)45,46,47. Specifically, it is debated whether higher beef yields should be desired, given calls for a protein transition47,48. Our adjacency matrix results illustrate that yield is assessed to be a highly connected indicator, suggesting that productivity gains can come with multiple synergies and tradeoffs on resource use (for example, cropland expansion), diets (for example, NCD risk) and equity (for example, female landholdings).
Indicators trending undesirably or showing no change may indicate slow-moving phenomena or need for vigilance. They may also indicate that upstream dependencies (interactions) are blocking their ability to progress. For example, health-related food environment policies are deployed in most of the world with robust empirical evidence of their effeciveness16,28,34,35,36, but most Central Asian countries (where diet quality is among the worst in the world) are not making use of these policy tools, suggesting a potential dependency of diet quality outcomes on food environment policies. We also observe that the cost of a healthy diet and food insecurity are trending in an undesirable direction, both attributable at least in part to rising inflation49.
The second contribution identified is where theory supports a direct causal relationship between each pair of indicators using expert assessment, highlighting potential synergies or tradeoffs. The results show that certain governance and resilience indicators are assessed to have the greatest number of connections to other indicators across themes (civil society participation, right to food, government effectiveness, disaster damages share of gross domestic product (GDP), social capita and food price volatility), highlighting key leverage points for action, while, at the same time, several diet, environmental and resilience indicators are influenced by numerous other indicators (cost of a healthy diet, diet quality indicators, reduced coping strategies and food price volatility), suggesting that changes to these outcomes may require numerous coordinated actions. Food price volatility is on both lists, suggesting a key indicator with feedback loops where changes either amplify and spur further changes or act as a balancing force to send the system back towards equilibrium. The nature of this feedback loop is an important topic of future research.
Results from our literature search suggest that the proposed connections we identified between governance indicators and other indicators have conceptual validity. We found all proposed directly connected pairs have been investigated, with the most literature on the right to food and the least on the Milan Urban Food Policy Pact and civil society participation. The Milan Urban Food Policy Pact metric may be too specific to be reflected in literature, suggesting that perhaps focus should instead be on the urban policies and actions proposed by the pact50, rather than signatory status. Further, the cost of a healthy diet is a newly developed indicator, but the phrase is widely found in literature referring to the same concept but not the exact indicator and, therefore, the numerous results for interactions with the cost of a healthy diet probably reflect studies that are not actually about the specific indicator but rather the broader concept, which is similarly true for the right to food. However, this analysis provides a departure point for further research on the nature, direction and strength of these interactions and identified some gaps, for example, indicators connected to government effectiveness.
This study contributes to the growing literature focused on understanding such systems interactions and demonstrates how case studies can add depth to understanding interactions in context51,52. The case studies show how food environment policies have become increasingly impactful in achieving better diet quality outcomes in Mexico, that government effectiveness is highly relevant for food systems outcomes in Ethiopia (but its influence has been decreasing on livelihoods indicators) and that civil society participation plays an increasingly important role in driving food systems change in the Netherlands, filling in the gap that government leaves. Participants testified that the process stimulated new thinking, discussions and concrete connections among the participating experts from different backgrounds and organizations (Supplementary Table 7). The participants in Ethiopia expressed a desire to replicate the exercise for interactions between the monitoring indicators in their national food system transformation pathway. Participants in Mexico noted a critical gap to be the influence of industry lobbying. In the Netherlands, participants suggested not having a food systems transformation pathway illustrates lack of political will to make fundamental changes and a further tailored set of food systems indicators could help move beyond the standstill lack of government action has created. Such facilitated consultations demonstrate an effective method to engage local experts in identifying interactions and articulating context-specific actions that can be used (or advocated for) to navigate tradeoffs.
Going forwards, there are several important directions for improving understanding of the synergies and tradeoffs among food system dimensions. First, the indicators in the FSCI framework reflect those with sufficient country coverage to meet inclusion criteria, thereby leaving out some indicators that conceptually fit in the framework, particularly affecting the livelihoods and governance themes. The FSCI makes continuous improvements to indicators and data with each annual publication wherever new options become available. Second, whether an interaction is a synergy or tradeoff is often context-specific, probably varying by spatial and temporal scale, political and environmental context and other factors. Third, the number and nature of the relationships highlighted in these results depend upon indicator availability in each theme and their effectiveness in describing the concepts contained therein. Specifically, many governance indicators are general and focused on the enabling environment for food systems transformation. This generality may be part of the reason they emerge as so connected to other indicators. Similarly, phenomena captured by governance indicators typically but not always change slowly and include binary and categorical indicators not amenable to trend analysis. Finally, case studies were carried out in three countries as illustrative examples of an effective consultation method and insights it can generate, which can be replicated in other contexts.
This paper provides a first global insight on change over time across food systems themes, complemented by a cross-cutting qualitative assessment on interactions to help understand and navigate towards desirable change.
Methods
Data
We compiled an updated dataset harmonized to the country-year unit of analysis and following data construction methods delineated in Schneider et al.3. Global, regional and income group means are calculated as weighted means per year, excluding missing data, weighted by the weighting variables defined in Supplementary Tables 1 and 2. No further data transformation was applied, and we did not impute any missing data. All data compilation and analyses were carried out in R version 4.4. The data were downloaded in March 2024 with final pulls from application programming interfaces in October 2024 and reflect all available data points from 2000 to 2022, with data from 2023 or 2024 for a few indicators where older data are not available. All data sources are listed in Supplementary Data 1, including the year of the latest data point available. The full dataset is provided in Supplementary Data 2.
We made a few modest changes to the indicator framework and data sources since the baseline publication. First, we renamed a few indicators for ease of interpretation. That is, in the theme of ‘diets, nutrition and health’, sugar-sweetened soft drink consumption has become soft drink consumption, ‘All-5’ is clarified as ‘All-5: consumption of all five food groups’, and the indicator of ‘retail value of ultraprocessed foods per capita’ has been transformed into current purchasing power parity dollars. Under the environment, natural resources and production theme, we clarified agrifood system emissions to be ‘agrifood system greenhouse gas emissions’, cropland expansion has been renamed more accurately as ‘cropland area change’ and functional integrity has added more description in the name to ‘functional integrity: agricultural land with minimum level of natural habitat’. We also revised the emissions intensity and yield indicators to specify product groups in the name of the indicator. Under resilience, we clarified the ratio of damages to GDP as ‘ratio of total damages from all disasters to GDP’.
We have also replaced the indicator or data source for several indicators. First, we replaced the sustainable nitrogen management index with the nitrogen use efficiency indicator. The former was more challenging to interpret because it combines multiple indicators, including the direct indicator of nitrogen use efficiency. The nitrogen use efficiency indicator is available from FAOSTAT and has a clearer interpretation. We have also revised the threshold to calculate functional integrity based on more recent data showing that a 10% threshold is insufficient to preserve ecosystem function53, so we have recalculated the indicator at the recommended 20% threshold. We replaced female landholdings with the SDG indicator ‘Share of women among owners or rights-bearers of agricultural land (SDG 5.a.1)’ because the Gender and Land Rights database of FAO is no longer being updated, and although there are fewer than 70 countries with available data for the SDG indicator, it will continue to be updated as new data are collected. Additionally, we revised the weighting of averages for functional integrity and the proportion of agricultural land with minimum species richness. Both indicators are based on the proportion of agricultural land, and we weigh the averages using an internally consistent calculation of agricultural land area for each variable. Previously, we used the FAOSTAT indicator of agricultural land area, which differs slightly due to source data differences.
Updating the 2023 baseline3, we have expanded the indicator previously reflecting health-related food taxes to include health-related food environment policies more broadly: ‘presence of national health-related food environment policies’. We use the same data source (the NOURISHING database from the World Cancer Research Fund) and text analysis to classify policies into economic or regulatory, identify and remove any regulatory policies that are not mandatory and ensure that we are not including any policies that only apply at a subnational level (for example, the soda tax in Berkeley, CA, USA). We include any policies classified in the NOURISHING database under the food environment categories including: ‘nutrition label standards and regulations on the use of claims and implied claims on food’, ‘offer healthy food and set standards in public institutions and other specific settings’, ‘use economic tools to address food affordability and purchase incentives’, ‘restrict food advertising and other forms of commercial promotion’, ‘improve nutritional quality of the whole food supply’ and ‘set incentives and rules to create a healthy retail and food service environment.’ The policies catalogued under the ‘use economic tools’ category are coded as economic tools, and policies in all other categories are coded as regulatory instruments. We use text search to identify whether the regulatory policies apply nationally and are voluntary or mandatory. The text strings were iteratively developed through manual inspection and are shown in Supplementary Table 6. Of note, the database was constructed through a comprehensive search only in the European Union; all other regions rely on periodic scanning and reporting networks of local collaborators, and therefore, the data may not be entirely comprehensive of all policies outside the European Union.
Analysis methods
Trend analysis
Trend analysis is conducted with linear regression of the indicator on time (year), with regional fixed effects and weighted by the weighting variable shown in Supplementary Table 1, computed using the lm package in R, version 4.4. We first normalize the indicator data using feature scaling (minimum–maximum normalization) so that all the values for each indicator (pooled over countries and years) are on a scale from 0 to 1. We then multiply by 100 so that the coefficients when regressed on time can be interpreted as an average percentage change per year. Of note, this normalization choice is consequential for the results for a few indicators because the normalization reduces the variance and, therefore, results in a conclusion of statistical significance (or also non-zero in magnitude) that would not be made when regressing the indicator in its original units on time. This affects only eight indicators, specifically: emissions intensity for milk and rice, pesticide use, civil society participation, government accountability, government effectiveness, food price volatility and the social capital index.
We classify the slope, sign and statistical significance to categorize each indicator’s change over time into ‘desirable change’, ‘no change’ and ‘undesirable change’. Change is defined as desirable if the trend line is statistically significantly different from zero with the sign agreeing with the desirable direction of change and as changing in the undesirable direction if statistically significantly different from zero with a sign in opposition to the desirable direction of change. The coefficients that are equal to zero or not statistically significantly different from zero are classified as no change. Weighting variables and desirable direction of change defined in Supplementary Table 1. Supplementary Figs. 1–5 show the predicted values (margins) at every combination of year and region to illustrate heterogeneity in intercept and slope across regions, per indicator. It is computed as the predicted margins at all values of year and region from a linear regression of the indicator on the interaction between year and region, weighted as defined above.
Identifying interactions at the global level
We used three methods to identify and understand interactions between indicators. First, we carried out an expert elicitation process with all the coauthors, organized into working groups by theme. For each pair of indicators (all possible combinations), the experts identified where there is theoretical evidence of a direct causal relationship and the direction of the relationship in terms of the cause variable and impact variable. This process did not identify the nature of the relationship (synergy or tradeoff). We converted these responses into a matrix and took the square and cube of the matrix to identify second- and third-order connections, respectively. Second-order connections are identified as two indicators connected to each other indirectly via one intermediating indicator to which both are directly connected. Third-order connections pass through two other indicators to connect the pair.
Automated literature search
We used an automated literature search with manual screening to assess the presence of literature on the pairs of governance-related indicators identified as connected through the expert elicitation. Dimensions is a comprehensive research database designed to link documents across the project cycle (for example, grants to final publication) and to study alternative metrics43. It has been shown to perform as well as Google Scholar to capture literature from across traditional databases (for example, Web of Science and PubMed) as well as grey literature54,55,56, and unlike Google Scholar, it has an application programming interface permitting large-scale automated search. Using the Dimensions.ai application, we searched title and abstract for the pairs of indicators involving at least one governance indicator for which a direct causal relationship was identified. We eliminated the directionality information from this search, meaning we searched once for a pair of indicators even if causality has been identified in both directions. In a few cases, we replaced the indicator name with closely related terminology from the Dimensions database of concepts, when no results were returned with the specific indicator name. The search terms are provided in Supplementary Table 3.
We implemented the search in Python and eliminated any results that were from a scientific poster or not in English. One author (D.D.) then manually screened all results by title and citation data for relevance according to the following exclusion criteria: not in English (that was not caught by the automated screening), duplicates within the same indicator pair search, incomplete titles (for example, ‘book review’) and any titles that indicate complete irrelevance to both indicators in the search pair that returned the result in question. For example, a paper entitled ‘Wild Bornean orangutans experience muscle catabolism during episodes of fruit scarcity’ was eliminated as irrelevant to the search of an interaction between reduced coping strategies and the right to food indicators. Another paper excluded on the relevance criterion from that same pair of indicators search was ‘Cognitive-behavioural treatment of depression: a three-stage model to guide treatment planning.’ These examples illustrate a broader pattern of the manual screening step that mostly excluded articles focused on psychological or biological phenomena in non-human animals and not in an agrifood livestock context or humans with specific mental or physical health issues that do not fall under the category of diet-related or otherwise have a relationship to food systems (for example, depression, short bowel and not in the context of food system-based livelihoods).
Country case studies
We selected Mexico, Ethiopia and the Netherlands for the case studies because they represent distinct geographical regions and food systems types, with Mexico currently being characterized as ‘emerging and diversifying’, Ethiopia as ‘rural and traditional’ and the Netherlands as ‘industrial and consolidated’57. In addition, in the three countries, there are active processes on food systems transformation pathways to which this process can contribute and has been welcomed to contribute. Identification of participants and collaboration on the consultation structure was facilitated in Ethiopia by project teams from the Food, Agriculture, Biodiversity, Land-Use and Energy Consortium and Sustainable Healthy Diets through Food Systems Transformation, who were actively carrying out related consultations. In Mexico, we partnered with the National Institute of Public Health and the Food, Agriculture, Biodiversity, Land-Use and Energy Consortium teams, which have been actively involved in investigating national food systems and pathways. In the Netherlands, the workshop was cohosted by Wageningen University and Research. In total, 20 Ethiopian, 15 Mexican and 15 Dutch food systems experts from government, non-governmental organizations and research organizations participated in a 1 day session. This was held in person in Addis Ababa on 2 April 2024 (Ethiopia), in hybrid format in Mexico City and online on 17 April 2024 (Mexico) and in hybrid format in Utrecht on 9 July 2024 (the Netherlands). The participants were selected on the basis of their knowledge and involvement in national food system transformation pathways, policies and research, as well as their availability to participate. The experts represent government officials, research organizations and civil society. The list of participants and their affiliations is provided in Supplementary Table 7.
The elicitation exercise consisted of qualitative mapping guided by a lead facilitator using instructions, guiding questions and facilitation support materials (Supplementary Table 8) consistent across countries. The participants worked in three breakout groups of three to seven people to qualitatively map and discuss the interactions of pairs of indicators in two dimensions: (1) the level of relevance for achieving sustainable food systems (specifically the national food systems transformation pathway in Mexico and Ethiopia) and (2) the change in strength over time. Plenary discussion was used to integrate and converge through discussion and to highlight the main insights emerging from the exercise. The reports of individual sessions are available on request. The Milan Urban Food Policy Pact indicator was excluded due to limited use and familiarity in Ethiopia or Mexico, according to the country teams.
Reporting summary
Further information on research design is available in the Nature Portfolio Reporting Summary linked to this article.

Responses