Selection for somatic escape variants in SERPINA1 in the liver of patients with alpha-1 antitrypsin deficiency
Main
CLD leading to cirrhosis accounts for 1 in 25 deaths globally1. The etiology of CLD is changing, with fewer cases attributable to viral hepatitis but an increased incidence of obesity and type 2 diabetes driving a worldwide increasing prevalence of metabolic dysfunction-associated steatotic liver disease (MASLD). In addition to these diseases, significant numbers of CLD cases relate to germline genetic disorders, including hemochromatosis and A1AT deficiency2. Hemochromatosis, common in patients in northern Europe, most frequently results from inherited mutations within HFE or other genes involved in iron absorption and metabolism3, leading to the deposition of hepatocellular iron and subsequent cellular stress. A1AT deficiency results from inherited homozygous E366K (E342K in the mature protein) mutations in the SERPINA1 gene, commonly known as the Z-variant of the A1AT protein4. Unlike the wild-type M-A1AT protein, which is secreted into the serum to inhibit neutrophil elastase, the Z-variant polymerizes in the hepatocyte endoplasmic reticulum (ER), leading to ER stress and cell death. There are currently no treatment options for patients with progressive PiZZ A1AT deficiency, aside from liver transplantation.
Somatic acquisition of functionally advantageous variants with subsequent clonal expansion points to the differential selection pressure that operates within the diseased microenvironment. In our previous work on MASLD and alcohol-related liver disease, we identified convergent evolution of functional variants in metabolism genes, including FOXO1, CIDEB and GPAM. These drive clonal hepatocyte expansion, probably through modulation of carbohydrate and lipid metabolism5, which are known to be dysregulated in MASLD. Loss of function in the homologous genes leads to clonal expansion of hepatocytes in mouse models of MASLD6; common germline variants of GPAM7,8 or rare predicted loss-of-function germline variants of CIDEB9 protect against the development of MASLD. However, it is likely that different diseases leading to specific microenvironmental stressors will drive differential selective advantage of driver variants in similar contexts: liver tissues from patients in the southern United States, predominantly with viral hepatitis, develop a different spectrum of somatic variants10. Therefore, the identification of advantageous somatic variants that arise in specific disease contexts potentially points to underlying functional mechanisms. For variants protective at both cellular and systemic levels, mimicry would be a rational therapeutic strategy, especially in liver diseases for which no therapeutics currently exist.
In this study, we explored somatic variants and clonal dynamics in the liver of patients with end-stage CLD caused by hemochromatosis and A1AT deficiency. In a group of patients with background demographics similar to our previous cohort with MASLD5,11, but with CLD of distinct etiology, we reasoned that disease-specific pressure would drive the expansion of clones carrying distinct functional variants in genetic CLD: both diseases have pathological mechanisms that do not overlap with each other or with steatotic liver disease (SLD).
Results
Somatic variants in the liver in genetic CLD
We obtained explanted liver tissue from five patients with homozygous PiZZ A1AT deficiency (Supplementary Table 1 and Extended Data Fig. 1) and five patients with hemochromatosis; all had significant hepatocellular iron deposition and included one patient with homozygous C282Y mutations, one with compound C282Y/H63D mutations and three with hemochromatosis of uncertain cause (Supplementary Table 2) without risk factors for secondary hemochromatosis. All were undergoing liver transplantation for liver failure, hepatocellular carcinoma or both. To identify somatic variants, we initially performed whole-genome sequencing (WGS) in one patient with A1AT deficiency and four with hemochromatosis but thereafter used only whole-exome sequencing (WES) in the remaining cases to focus on coding variation. We performed laser-capture microdissection (LCM) and WGS or WES (Fig. 1a) of 306 laser microdissections of liver tissue, achieving a mean coverage of 42× for WGS and 48× for exome sequencing (Fig. 1b). To consider exome and genome datasets together, we reported the number of exonic coding mutations (Fig. 1b). There was considerable heterogeneity in variant burden both between and within patients (Extended Data Fig. 2a) but no significant differences between A1AT deficiency, hemochromatosis or previously sequenced liver samples from patients with SLD5 and no differential representation of mutational signatures (Extended Data Fig. 2b). Copy number changes and structural variants (SVs) (called in samples undergoing WGS) occurred in moderate numbers across patients with hemochromatosis and the one patient with A1AT deficiency, with WGS data (Extended Data Fig. 2a). One clone demonstrating chromothripsis involving chromosomes 7 and 10 was detected in the liver of a patient with hemochromatosis undergoing transplantation for liver failure without hepatocellular carcinoma (Extended Data Fig. 2c), accounting for 30 out of 48 of SVs and 30 out of 34 copy number variants in that donor.

a, Overview of the hierarchical experimental design: ten livers from patients with A1AT deficiency and hemochromatosis were sampled. These samples underwent LCM to generate 306 individual microdissections; isolated DNA was then sequenced using WGS or WES approaches. b, Top panel, mean sequencing coverage in each microdissection. Donors (M, male; F, female) are ordered by disease and age. The number of SNVs and indels detected per microdissection within the coding exome across WGS (n = 77) and WES (n = 229) data (for five samples for which dual WGS and WES were performed, only WGS calls are shown). Variants are colored by type. c, Genes under positive selection in A1AT deficiency and hemochromatosis cohorts. Manhattan plots showing the distribution of P values testing for gene-level non-synonymous variants in A1AT deficiency (left panel) and hemochromatosis (right panel). Genes found to be under positive selection in A1AT deficiency, hemochromatosis or, previously, in SLD are labeled. Genes are ordered by genomic position, and those with significant q values (<0.1) are highlighted in bold.
Source data
We analyzed which genes were under positive selection by applying an implementation of the ratio of non-synonymous to synonymous mutation rates (dN/dS) while accounting for sequence composition, trinucleotide mutational biases and gene-specific variation in mutation rates12. Across all protein-coding genes, we found that somatic variants in SERPINA1 were under strong positive selection (dN/dS, ~783 for truncating, ~1,772 for insertions and deletions (indels); q < 2 × 10⁻¹⁶) (Fig. 1c) in patients with A1AT deficiency but not in patients with hemochromatosis (dN/dS, 0 for truncating variants; 95% CI, 0.0–405.6; q = 1) or SLD5,11 (dN/dS, 0; 95% CI, 0.0–71.0; q = 1). We did not identify any enrichment for somatic variants in any gene previously associated with iron metabolism3, including HFE, in either cohort. Furthermore, no acquired variants were significantly positively selected for in the patients with hemochromatosis; however, this may reflect a lack of statistical power given the small number of patients examined. Genes previously found to be under positive selection in liver tissue from patients with SLD5 or liver cancer13 did not appear to be under positive selection in liver tissue from either the A1AT deficiency (CIDEB dN/dS for missense, 30.5 (95% CI, 1.7–142.8; q = 1); FOXO1 dN/dS, 0.0 (95% CI, 0.0–18.2; q = 1); GPAM dN/dS, 0.0 (95% CI, 0.0–16.9; q = 1)) or hemochromatosis cohorts (CIDEB dN/dS, 24.9 (95% CI, 1.4–110.4; q = 1); FOXO1 dN/dS, 22.4 (95% CI, 5.5–58.7; q = 1); GPAM dN/dS, 13.8 (95% CI, 2.3–42.9; q = 0.35)). Therefore, liver diseases of differing etiology drive the expansion of hepatocyte clones with distinct somatic variants.
Convergent evolution of SERPINA1 variants in A1AT deficiency
In the five patients with A1AT deficiency, we observed 17 indels, two missense and three nonsense mutations in SERPINA1. All five patients had genetic evidence of convergent evolution, with multiple independent clones containing distinct SERPINA1 variants within the same piece of randomly selected liver tissue (Fig. 2). One patient had 11 independent clones with SERPINA1 variants within 0.3 cm2 of liver tissue, with one clone containing frameshift deletions in both alleles of the gene (Fig. 2a,b). The other four patients had two or three clones with independent SERPINA1 variants (Fig. 2c); most non-synonymous mutations in SERPINA1 in the A1AT deficiency cohort had variant allele fractions (VAFs) between 0.2 and 0.4, well within the VAF distribution for passenger mutations in the respective samples, indicative of being heterozygous rather than homozygous, in the major clone (Extended Data Fig. 3). Therefore, heterozygous somatic variants in SERPINA1 provide selective advantage in A1AT deficiency, which only develops in patients with homozygous germline Z variants of SERPINA1.

a, Phylogenetic tree of clonal structure from liver sample PD51606, with colored branches showing independently acquired SERPINA1 mutations. b, Spatial mapping of the clones from the phylogenetic tree onto an H&E-stained photomicrograph of the patient’s liver biopsy, with SERPINA1 mutant clones colored to match the tree shown in a. Each dot signifies a microdissection, with solid black dots indicating LCM microdissections harboring a SERPINA1 mutation. For WGS samples, clonal cell fraction is depicted, with a fully filled disk signifying all clones detected in the LCM sample and SERPINA1 mutant cell fraction depicted by the degree of disk filling. Dashed lines indicate SERPINA1 mutations identified exclusively in WES samples. Nodules are color-highlighted, whereby all microdissections within the nodule contain the same SERPINA1 mutant clone. c, Spatial location of clones with SERPINA1 variants in the H&E-stained liver of the remaining four patients with A1AT deficiency (colored area), in addition to SERPINA1 wild-type clones (gray circles).
We were interested in exploring the potential protein-coding effects of the somatic variants in SERPINA1. Notably, the identified variants in the A1AT deficiency cohort showed strong clustering of truncating variants within the last exon of SERPINA1 (Fig. 3a), not seen in the previous SLD cohort (Extended Data Fig. 4): among 29 patients with SLD, three patients had a heterozygous PiMZ SERPINA1 genotype with no coding variants in SERPINA1 in these liver samples. In the A1AT-deficiency cohort, all frameshift indels and nonsense mutations in the last exon are predicted to result in the loss of at least 19 amino acids from the C-terminus of the encoded protein in addition to partial modification of amino acid sequence in the case of frameshift indels (Fig. 3b). The recurrence and convergent evolution of similar variants suggests that acquired C-terminal truncating SERPINA1 variants provide a selective advantage to hepatocytes in A1AT deficiency through common functional mechanisms.
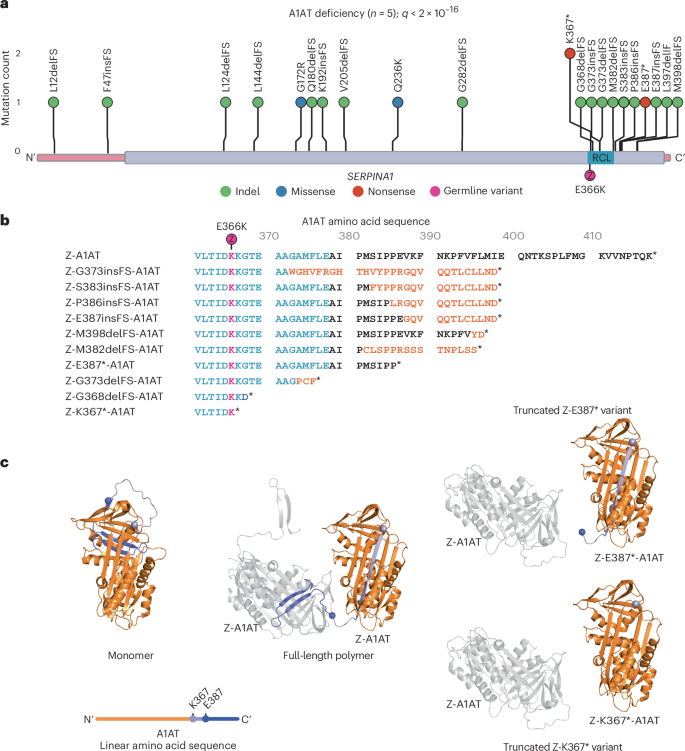
a, Distribution of non-synonymous variants detected in SERPINA1 in liver samples from patients with A1AT deficiency (n = 5) with gene-level q value corrected for multiple hypothesis testing reported. The coding sequence of the gene is represented on the x axis, with exons in pink and protein domains in purple. Position of the germline PiZ variant (E366K) shown in magenta; RCL, reactive center loop. b, Effect of C-terminal variants on Z-A1AT protein sequence; sequence alignment of Z-A1AT amino acids 361–418. The reactive center loop is highlighted in blue; amino acid sequence modified by frameshift in orange; E366K (PiZ) variant indicated in magenta; stop codon denoted by *. c, Left, cartoon representing the crystal structure of native A1AT derived from Protein Data Bank (PDB 1QLP)15. The position of residues K367 (light purple) and E387 (blue) is shown by colored spheres, with downstream residues colored similarly. A linear schematic of the protein shows relative mutation positioning using the same color code (upper). Middle, the crystal structure of two protomers in a Z-A1AT polymer from PDB 3T1P16, showing the insertion of donor protomer residues downstream of K367 (light purple sphere) into the acceptor protomer. Right, structural model of two protomers in a polymer (PDB 3T1P) highlighting the incompatibility of Z-K367* and Z-E387* C-terminal donation to a polymer.
C-terminal clustering of somatic SERPINA1 variants
Somatic variants leading to truncation (Fig. 3c, right) or sequence changes (Extended Data Fig. 5) in the C-terminus of A1AT have the potential to disrupt both native folding and polymerization of A1AT. The recurrent SERPINA1 variants affect the reactive center loop and C-terminus of A1AT, previously shown to mediate homopolymerization of Z-A1AT (Fig. 3c)14. In its native fold, the C-terminal 26 amino acids of A1AT form a β-hairpin that inserts into and completes β-sheet B, with β-sheet A adopting a five-stranded conformation15 (Fig. 3c, left). Polymers arise through the completion of β-sheet B in an ‘acceptor’ protomer by the C-terminal β-hairpin of a second ‘donor’ protomer14,16. This causes the acceptor molecule to adopt a hyper-stable, six-stranded β-sheet, which is a conformation that translocates its own orphaned C-terminus to the opposite pole of the molecule where it can act as a donor to drive polymer extension (Fig. 3c, middle). Therefore, somatic variants that impose truncation or sequence changes in the C-terminus have the potential to disrupt polymerization of Z-A1AT through lost or reduced ability (Fig. 3c and Extended Data Fig. 5) to donate the C-terminus into neighboring Z protomers, but should not affect their ability to act as ‘acceptors’.
C-terminal truncation variants of Z-A1AT rescue ER disruption
To explore potential mechanisms, including polymerization, underlying the selective advantage of Z-A1AT C-terminal truncation variants to hepatocytes, we modeled these in vitro. We studied two variants with acquired premature stop codons: Z-K367* and Z-E387* (Fig. 3b,c). To study the cellular localization of these Z-A1AT variants, we conducted live-cell imaging of HaloTagged A1AT in an established Chinese hamster ovary (CHO) cell model that lacks human A1AT expression17,18. Both M-A1AT and Z-A1AT colocalized with the ER marker protein moxGFP-KDEL, while only the M form also localized to perinuclear structures resembling the Golgi apparatus. Expression of Z-A1AT promotes fragmentation of the ER network, giving rise to punctate ER inclusions (Fig. 4a). We quantified ER inclusion formation in cells expressing HaloTagged M, Z, Z-K367* or Z-E387* variants. Z-A1AT showed a greater propensity to form ER inclusions than M-A1AT (Fig. 4a,b), as reported previously18,19; by contrast, Z-K367* and Z-E387* led to a similar propensity to form ER inclusions as seen with wild-type M-A1AT expression (Fig. 4a,b). Therefore, the C-terminal truncation variants of Z-A1AT show reduced accumulation within, and disruption of, the ER.
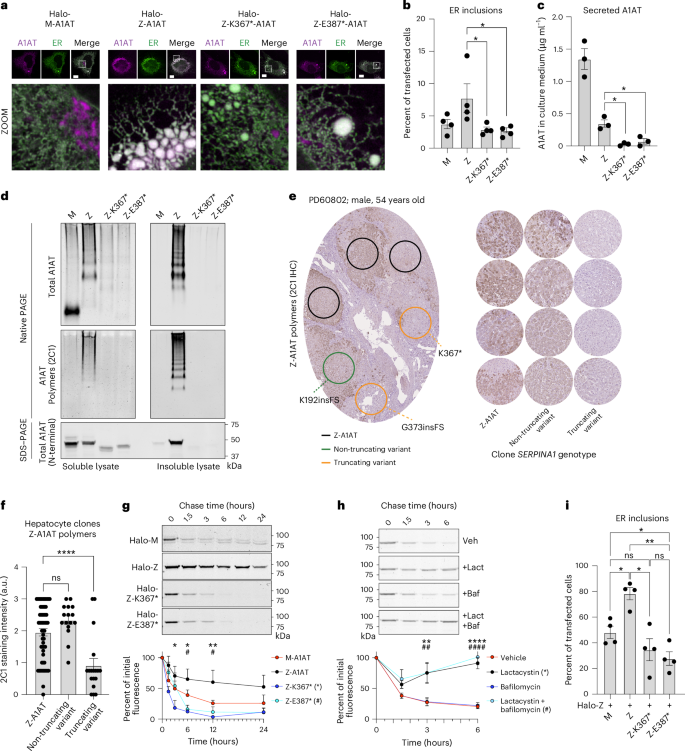
a, Fluorescence micrographs of CHO cells expressing indicated HaloTagged variants of A1AT (magenta) with the ER marker protein (moxGFP-KDEL (green)). Dashed line boxes indicate the area expanded in the zoomed-in images. Scale bar, 10 μm. b, ER inclusions (characterized by a region of fragmented tubular ER network) in CHO cells as in a; Z versus Z-K367*, P = 0.0283; Z versus Z-K387*, P = 0.0248. c, Levels of secreted A1AT from CHO cells expressing indicated A1AT variants; Z versus Z-K367*, P = 0.0053; Z versus Z-K387*, P = 0.017. d, SDS–PAGE and native PAGE immunoblotting of soluble and insoluble cell lysate fractions from an equivalent cell mass of CHO cells expressing indicated A1AT variants. Native PAGE immunoblotting was performed using antibodies recognizing total (a0409) and polymerized (mAB2C1) A1AT. SDS–PAGE immunoblotting was performed using an N-terminal directed antibody against A1AT present in all variants (MA5-15521). e, Left, exemplar photomicrograph of liver tissue immunohistochemistry for Z-A1AT polymers. Circles indicate regions with microdissected hepatocyte clones analyzed by WES or WGS (as in Fig. 1) in an adjacent section with the indicated SERPINA1 genotype; right, exemplar Z-A1AT polymer immunohistochemistry from regions with the indicated SERPINA1 genotype across the A1AT-deficiency cohort. f, Quantification of Z-A1AT polymer staining intensity (as in e) of 91 microdissected areas from five patients with A1AT deficiency; Z-A1AT versus non-truncating variant, P = 0.202; Z-A1AT versus truncating variant, P < 0.0001; ns, not significant. g, Pulse–chase time course of CHO cells expressing indicated HaloTagged A1AT variants using the HaloTag ligand. Quantitation of HaloTag-band intensity is plotted. * and # denote the significance of Z versus Z-K367* (P = 0.012, 0.010 and 0.005 at 3, 6 and 12 h, respectively) or Z versus Z-E387* (P = 0.805, 0.020 and 0.022 at 3, 6 and 12 h, respectively), respectively. h, Pulse–chase of HaloTagged Z-K367* in the presence of dimethylsulfoxide (vehicle), lactacystin (proteosome inhibitor, 5 µM), bafilomycin (lysosomal inhibitor, 100 nM) or both. * and # denote significance of vehicle versus lactacystin (P = 0.597, 0.002 and <0.0001 at 1.5, 3 and 6 h, respectively) or vehicle versus both inhibitors (P = 0.172, 0.002 and <0.0001 at 1.5, 3 and 6 h, respectively), respectively. i, Proportion of CHO cells displaying ER inclusions when co-expressing HaloTagged Z-A1AT with untagged variants of A1AT (Z + M versus Z + Z, P = 0.027; Z + Z versus Z + Z-K367*, P = 0.012; Z + Z versus Z + Z-K387*, P = 0.002; Z + M versus Z + Z-K387*, P = 0.033); n = 4 (a, b and i) or n = 3 (c, d, g and h) biological replicates for all conditions. Columns (b, c, f and i) and points (g and h) represent means ± s.e.m. Analyses by one-way (b, c, f and i) or two-way (g and h) ANOVA with Šidák’s correction for multiple hypothesis testing; ns, not significant; * P ≤ 0.05; ** P ≤ 0.01; **** P ≤ 0.0001.
The localization of the M variant apparently to the Golgi apparatus supports the expected secretory trafficking of wild-type HaloTagged M-A1AT, with ER retention of the Z-variant20 (Fig. 4a). Despite reduced ER retention, the HaloTagged Z-K367* and Z-E387* forms of A1AT showed no evidence of secretory trafficking: quantitative sandwich ELISA (Fig. 4c) and immunoblotting using an amino-terminal-directed antibody (Extended Data Fig. 6a) for secreted (untagged) A1AT in conditioned media from transfected CHO cell cultures indicated that cells expressing Z-K367* and Z-E387* secrete very little A1AT protein. Therefore, the C-terminal truncation variants of Z-A1AT do not accumulate in the ER but do not restore secretion of A1AT.
We next investigated ER handling of C-terminal truncation A1AT variants by assessing their mobility within the ER lumen, using single-particle tracking (Extended Data Fig. 6b)21,22 in COS7 cells. As shown previously, single Z-A1AT particles displayed a significant reduction in velocity compared to M-A1AT (Extended Data Fig. 6b)18. Z-K367* and Z-E387* also showed significantly reduced velocity, suggesting that these C-terminal truncation variants do not restore normal ER handling. Reduced mobility of Z-K367* and Z-E387* could indicate either an increase in protein hydrodynamic volume through polymerization or interactions with ER quality-control factors. Therefore, C-terminal truncation variants of A1AT have a reduced propensity to form ER inclusions, but these variants failed to rescue impaired molecular mobility within the ER or trafficking through the secretory pathway.
C-terminal truncation variants of Z-A1AT prevent polymerization
Based on the predicted protein sequences, we reasoned that the C-terminal truncation variants could impair aberrant polymerization of Z-A1AT. We assessed A1AT polymer formation in CHO cells expressing untagged A1AT variants by polyacrylamide gel electrophoresis under native non-denaturing (native PAGE) and denaturing (SDS–PAGE) conditions, followed by immunoblotting. As Z-A1AT polymers partition between soluble and insoluble pools within the ER2,18,23,24, insoluble proteins were first separated from lysates by centrifugation and resuspended in their initial volume to assess stoichiometry with soluble protein. Native PAGE immunoblotting of the soluble A1AT pool showed that M-A1AT migrated predominantly at a low molecular weight, representing folded monomers (Fig. 4d, upper left panel). Z-A1AT separated as a ladder of higher molecular-weight species in soluble and insoluble pools, confirmed as A1AT polymers by the conformation-specific antibody mAb2C1 (Fig. 4d, middle panels). The Z-K367* and Z-E387* truncation variants lack β-strands 4B and 5B, required for C-terminal donation in polymerization, and accordingly produced no higher molecular-weight species (Fig. 4d, middle left panel) that react with polymer-specific mAb2C1 (Fig. 4d, middle right panel) despite containing the germline E366K Z-variant. Immunoblotting of lysates separated by SDS–PAGE confirmed lower expression of C-terminal truncation variants compared to Z-A1AT, but they predominantly partition to the soluble fraction of lysates, in contrast to Z-A1AT (Fig. 4d, lower panel). Therefore, acquired C-terminal truncation variants of Z-A1AT do not form polymers characteristic of the germline Z-variant of A1AT.
Hepatocyte clones with C-terminal truncation variants have reduced A1AT polymers
We next explored whether hepatocyte clones that contained SERPINA1 variants had evidence of reduced polymer formation in vivo. We used immunohistochemistry with the Z-A1AT polymer-specific 2C1 antibody on serial sections from the five liver samples in the A1AT-deficiency cohort, in which we had already conducted spatial DNA sequencing on the adjacent section (Fig. 4e). We then defined areas of hepatocytes with wild-type SERPINA1, non-truncating SERPINA1 variants or C-terminal truncation variants before assessing the intensity of 2C1 immunostaining in those areas. Hepatocytes with non-truncating SERPINA1 somatic variants had a similar polymer burden to areas with homozygous germline Z-SERPINA1, whereas hepatocytes with C-terminal truncation variants of SERPINA1 showed a significantly lower polymer burden than wild-type hepatocytes (Fig. 4e,f). Therefore, C-terminal truncation and frameshift variants of Z-A1AT have reduced polymer accumulation in vivo compared to germline Z-A1AT. These findings also raise the interesting question of whether proximal non-truncating variants are truly advantageous or whether these represent passenger mutations.
It remained possible that reduced Z-A1AT polymer accumulation could simply reflect lower expression levels of the C-terminal Z-A1AT variants compared to the germline M-A1AT and Z-A1AT variants (Fig. 4d, lower panel) or impaired polymerization through loss of the C-terminal domain swap. As Z-K367* and Z-E387* variants were heterozygous (VAF ≤ 0.5) with native Z-A1AT expressed from the other allele in hepatocyte clones (Extended Data Fig. 3), we explored whether the reduction in A1AT accumulation was a result of their potential to behave as ‘acceptor’ protomers in forming mixed polymers with Z-A1AT but ‘chain-terminate’ onward polymerization through inability to ‘donate’ to the next Z monomer (Fig. 3c). HaloTagged A1AT variants were constitutively expressed in CHO cells that also conditionally express untagged doxycycline-inducible Z-A1AT before affinity purification of the HaloTagged A1AT species (Extended Data Fig. 6c). SDS–PAGE immunoblotting of the input samples showed expression of the higher molecular-weight HaloTagged A1AT variants in addition to the lower molecular-weight untagged Z-A1AT. Affinity purification of HALO and then immunoblotting showed that the HaloTagged Z-A1AT pulled down lower molecular-weight untagged Z-A1AT; similarly, purification of both Z-K367* and Z-E387* variants retained the ability to pull down untagged Z-A1AT, consistent with their ability to bind to native Z-A1AT derived from the unaffected allele. Therefore, although the C-terminal truncation variants do not form homopolymers, they retain the ability to bind to germline Z-A1AT, acting as ‘acceptor’ protomers.
C-terminal truncation variants of Z-A1AT have a reduced half-life
We explored why C-terminal variants had apparently lower protein expression using a pulse–chase strategy, labeling the HaloTagged A1AT variants in CHO cells with Janelia Fluor reporters that covalently bind to Halo. Consistent with previous data, we found that Z-A1AT had a longer half-life than M-A1AT (Fig. 4g). However, we found that both Z-K367* and Z-E387* variants had a significantly shorter half-life than Z-A1AT. To probe how these C-terminal variants of A1AT undergo degradation, we used small molecule inhibitors of the two major protein degradation pathways: lactacystin as an inhibitor of the proteosome and bafilomycin A1 as an inhibitor of lysosomal function. Lysosomal inhibition had no effect on the half-life of Z-K367*, whereas proteasomal inhibition completely prevented the degradation of Z-K367* (Fig. 4h). Therefore, lower expression of the C-terminal truncation Z-A1AT variants, compared to germline Z-A1AT, is caused by proteasomal degradation leading to a shorter half-life.
To understand whether Z-A1AT truncation variants lead to reduced polymer accumulation resulting from a loss of function from lower protein expression or gain of function, preventing onward Z-A1AT polymerization in a dominant-negative fashion, we transduced CHO cells with bicistronic vectors containing Z-A1AT, in addition to M-A1AT, Z-A1AT, Z-K367* or Z-E387*. As expected, CHO cells co-expressing Z-A1AT/Z-A1AT had significantly more inclusions than cells co-expressing Z-A1AT/M-A1AT (Fig. 4i). Cells expressing Z-K367* with Z-A1AT had similar levels of inclusions to Z-A1AT/M-A1AT-expressing cells. However, CHO cells expressing Z-E387* with Z-A1AT had significantly fewer ER inclusions than Z-A1AT/M-A1AT-expressing cells, suggesting that in addition to having reduced polymer load owing to reduced A1AT expression, expression of C-terminally truncated somatic variants might dominantly inhibit Z-A1AT polymerization. This will require further exploration, given that a dominant-negative function would have significant therapeutic implications.
Discussion
Overall, we have identified convergent evolution of somatic variants in SERPINA1 in the liver of patients with end-stage A1AT deficiency. The liver of each patient with PiZZ A1AT deficiency contained multiple hepatocyte clones with independent acquisition of variants in SERPINA1, the gene whose germline variant protein product drives the disease process. Remarkably, most of these somatic variants lead to truncation of the C-terminus of the A1AT protein and associate with reduced Z-A1AT polymer accumulation in vivo. This supports the idea that SERPINA1 variants engender cellular advantage by mitigating Z-A1AT polymer accumulation14,25 and subsequent cellular stress. In vitro modeling of two of the C-terminal truncating variants has shown that these are associated with reduced Z-A1AT polymerization as well as reduced accumulation within and disruption of the ER.
Avoidance of A1AT polymerization and subsequent ER dysfunction would provide a significant selective advantage for hepatocyte clones in A1AT deficiency compared to neighboring Z-A1AT hepatocytes and therefore drive clonal expansion (Extended Data Fig. 7). This has important therapeutic implications in a disease that currently has no available therapies, aside from transplantation. Although therapies based on liver-directed RNA interference, suppressing the expression of Z-A1AT, have shown promise in mouse models26 and preliminary human trials27, targeted blockade or deletion of the C-terminus of A1AT may represent an alternative strategy for the suppression of polymer formation in A1AT deficiency. All of these strategies would promote hepatocyte survival and prevent progressive liver disease, but none would restore normal A1AT secretion or serum levels and therefore would probably not prevent progressive lung disease caused by A1AT deficiency.
The effect of disease-associated germline variants on subsequent somatic mutagenesis is relatively unexplored outside of hereditary cancer syndromes28,29. There are rare descriptions of somatic reversion mutations that correct germline variants in deleterious germline disorders: somatic genetic rescue has been seen in severe combined immunodeficiency, in which an individual with inherited biallelic ADA mutations acquired a reversion mutation, leading to outgrowth of a healthy lymphocyte population30. Somatic genetic rescue has been described in muscle tissue of patients with inherited Duchenne muscular dystrophy31,32 as well as patients with hereditary tyrosinemia, whereby somatic reversion mutations were identified in explanted liver tissue and their extent correlated with clinical severity33. Although similar to previous somatic genetic rescue, our identified variants in A1AT deficiency are not direct reversions but escape variants at a distinct site in the gene, mitigating the effect of a deleterious germline variant. Indirect somatic rescue mutations in distinct genes have previously been identified in some cases of Shwachman–Diamond syndrome, in which acquired variants in EIF6 act to mitigate the deleterious effects of germline EFL1 or SBDS mutations34.
Combined with our previous data in SLD, whereby distinct functional variants in metabolism genes were identified, these data suggest that differing disease processes will drive the expansion of clones containing disease-specific variants, providing a selective advantage in the face of specific microenvironmental pressures. Identification of the advantageous variants in different tissues, populations and disease states has the potential to reveal functional gene targets but also reveal specific domains within those targets that give insights into the disease mechanism and tractable therapeutic targets.
Methods
Liver samples
All liver samples were collected with written informed consent from Addenbrooke’s Hospital, Cambridge, UK, according to procedures approved by Local Research Ethics Committees (20/NI/0109, 16/NI/0196). All participants consented to publication of the research results. The liver samples were snap-frozen in liquid nitrogen and stored at −80 °C in the Human Research Tissue Bank of the Cambridge University Hospitals NHS Foundation Trust.
Background diseased liver tissue was obtained from individuals with A1AT deficiency or hemochromatosis who were undergoing liver transplantation for hepatocellular carcinoma or liver failure (Supplementary Table 1). Patients were identified from clinical history, pre-operative investigations and explant histology (Extended Data Fig. 1 and Supplementary Table 1). All patients with hemochromatosis had current or previously elevated serum ferritin with significant hepatocellular siderosis by Perls’ stain. Pre-operative clinical genotyping was only performed for the common C282Y and H63D variants of the HFE gene. Patients with A1AT deficiency were diagnosed based on PiZZ A1AT electrophoretic phenotype and sub-normal serum A1AT levels. The SERPINA1, HFE, HJV, HAMP, TFR2, SLC40A1, BMP2 and RAB6B genotypes3 were derived from WGS or WES data (Extended Data Fig. 1 and Supplementary Table 2). Clinical and sequencing data from patients with SLD were derived from previous publications5,11.
The explant liver histology was reviewed by a specialist liver histopathologist (A.D., blinded to the other study results) and scored according to the Kleiner35 system on formalin-fixed paraffin-embedded samples away from the fresh–frozen block used for the LCM. The Kleiner score, developed for MASLD (to generate a cumulative MASLD activity score), was used in the absence of a validated scoring system for A1AT deficiency or hemochromatosis, allowing comparability between all study samples regardless of disease etiology. The histological findings were scored for siderosis by Perls’ staining using the Scheuer system36 and dPAS-positive globule deposition (Extended Data Fig. 1) as previously described37. Fibrosis was assessed using both the Kleiner35 and the Ishak38 scoring systems (Supplementary Table 1).
Sample preparation
The protocols for preparing liver tissue sections, LCM and subsequent cell lysis, DNA extraction and WGS have been previously described11,39. In brief, for six biopsies (PD51605b, PD51606b, PD51607b, PD51608b, PD52285b and PD52286b), 20 µm-thick tissue sections (prepared with a Leica cryotome) were fixed with 70% ethanol. The other four biopsies (PD60232b, PD60233b, PD60802b and PD60803b) were fixed in PAXgene solutions (PreAnalytiX), processed using a Tissue Tek VIP 6 AI tissue processor (Sakura Finetek) and embedded in paraffin, and 16 µm-thick sections were generated using an Accu-Cut SRM 200 microtome (Sakura Finetek). All LCM sections were mounted on polyethylene naphthalene membrane glass slides (Leica Microsystems) and stained with H&E for subsequent LCM generation using a Leica Microsystems LMD 7000.
LCM
For six biopsies (PD51605b, PD51606b, PD51607b, PD51608b, PD52285b and PD52286b), 48 microdissections were cut with a target area of 86,000 µm2, with the same x,y-region cut into the same well from two adjacent z-stacks. For the remaining four biopsies (PD60232b, PD60233b, PD60802b and PD60803b), cuts were taken at 166,000 µm2 without z-stacking. Overall, microdissection sizes corresponded to 800–1,000 hepatocytes. Images were taken before and after LCM. The microdissected samples were then lysed using the Arcturus PicoPure DNA Extraction Kit (Thermo Fisher Scientific) following the manufacturer’s instructions. DNA libraries for Illumina sequencing were prepared using a protocol optimized for low input amounts of DNA39. The resulting libraries were submitted for paired-end WGS or WES.
Exome sequencing
Exome capture was performed using either SureSelect All Exon v5 bait set (Agilent, S04380110) or Twist Human Core Exome (Twist Biosciences) bait set. Samples were multiplexed and sequenced using 150 bp paired-end reads on an Illumina NovaSeq 6000 (average pool size of 40). Paired-end reads were aligned to human genome assembly GRCh38 using BWA-MEM40. Duplicate reads were marked using biobambam41 and sample contamination estimates were calculated using VerifyBamID42. Library complexity and coverage statistics were calculated using Picard (http://broadinstitute.github.io/picard). The mean on-target coverage across all samples and genes was 48×. Across donors, median coverage ranged from 39× (PD52285b) to 65× (PD60233b).
WGS
WGS was performed using 150 bp paired-end reads on an Illumina NovaSeq 6000. DNA sequences were aligned to the GRCh38 reference genome using BWA-MEM. Duplicate reads were marked using biobambam41. The calculation of library statistics was performed using the CollectWgsMetrics function of Picard Tools, rather than the CollectHsMetrics function used for exome sequencing data. The mean coverage across all samples was 42×.
Calling of single nucleotide variants and indels from exome and WGS data
Single nucleotide variants (SNVs) were called using the CaVEMan (cancer variants through expectation maximization) algorithm43 against an in silico unmatched normal: a BAM file generated from the human reference genome (GRCh38). Indel calling was performed using cgpPindel44, with filtering strategies the same as for SNVs. In addition to the default CaVEMan filters, putative SNVs were required to have a median alignment score of reads showing the variant allele of at least 0.87 and fewer than half supporting reads being clipped (median number of soft-clipped bases, CLPM = 0). Duplicate reads and LCM library preparation-specific artifactual variants resulting from the incorrect processing of secondary cruciform DNA structures were removed with bespoke post-processing filtering39. Across all samples from the same patient, we force-called the SNVs and indels that were called in any sample, using a cutoff for read mapping quality (30) and base quality (25). To filter shared artifacts, we applied a beta-binomial-based filtering approach as previously described45. Mutations with a dispersion estimate of ≥0.1 were considered true somatic variants. Putative germline variants were filtered using a one-sided exact binomial test used on the aggregated counts of reads supporting the variant and the total depth at that site, as described previously45. This tests whether the observed variant counts are likely to have come from a germline distribution or from a distribution with a lower true VAF (probably somatic). For sex chromosomes in male individuals, the binomial probability (true VAF) for comparison was set to 0.95 rather than 0.5. The resulting P values were corrected for multiple testing using a Benjamini–Hochberg correction. Any variant with a q-value of ≤10−5 was classified as a putative somatic variant.
SV calling from WGS data
SVs were called with GRIDDS46 (v.2.9.4), used with default settings. SVs larger than 1 kb in size with QUAL ≥ 250 were included. For SVs smaller than 30 kb, only SVs with QUAL ≥ 300 were included. Furthermore, SVs that had assemblies from both sides of the breakpoint were only considered if they were supported by at least four discordant and two split reads. SVs with imprecise breakends (that is, the distance between the start and end positions of >10 bp) were filtered out. We further filtered out SVs for which the standard deviation of the alignment positions at either ends of the discordant read pairs was smaller than five. To remove potential germline SVs and artifacts, we generated the panel of normals by adding in-house normal samples (n = 350) to the GRIDSS panel of normals. SVs found in at least three different samples in the panel of normals or in matched normal tissues were removed.
Copy number variant calling from WGS data
Somatic copy number variants were called using the Allele-Specific Copy number Analysis of Tumors (ASCAT) algorithm47 as part of the ascatNGS package48 (https://github.com/Crick-CancerGenomics/ascat). ASCAT was run with default parameters with the exception of a segmentation penalty of 100. A bespoke filtering algorithm, ascatPCA, was used to reduce the number of false-positive calls that can arise when analyzing genome sequences from normal tissue (https://github.com/hj6-sanger/ascatPCA). ascatPCA extracts a noise profile by aggregating the logR ratio from across a panel of normal unrelated samples and subtracts this signature from that observed in the sample being analyzed using principal component analysis.
Extraction of mutational signatures
As previously described5,11, the hierarchical Dirichlet process (HDP) algorithm, as implemented in the HDP R package (https://github.com/nicolaroberts/hdp), was used to extract mutational signatures based on a reference catalog of 65 previously identified 192-context-based mutational signatures from the Pan-Cancer Analysis of Whole Genomes (PCAWG) study49 as well as a novel liver signature identified previously in CLD5.
Bayesian Dirichlet process for clustering VAFs across multiple samples
The nonparametric Bayesian HDP was used to group SNVs based on similar VAFs identified across multiple microdissections in each liver sample. This method, called N-dimensional Dirichlet process (NDP) clustering, has been detailed previously11. We ran the algorithm with 15,000 burn-in iterations, followed by 25,000 iterations of posterior Gibbs sampling for the clustering process. During each iteration, there is a defined probability that mutations will be allocated to new clusters that did not exist in the previous iteration. Existing clusters can also be eliminated if member mutations are reassigned to another cluster. This adaptive process allows for the dynamic adjustment of the number of clusters throughout the sampling. To prevent the formation of uninformative clusters, we capped the number of SNV clusters at 100 per patient. We also used a multi-threaded version of the ECR algorithm, adapted from the label.switching R package (https://doi.org/10.18637/jss.v069.c01), to correct for label switching efficiently. For subsequent reconstruction of phylogenetic trees, we only considered SNV clusters that included at least 50 distinct mutations.
Construction of phylogenetic trees
The statistical pigeonhole principle50 was used to deduce the phylogenetic clonal relationships among SNV clusters identified in each patient by the NDP algorithm. Here, each cluster forms a branch on a phylogenetic tree. Evidence that a cluster is considered nested within another is considered strong if its mutation-carrying cell fraction is consistently lower than that of another cluster across all sampled microdissections, and if the combined mutant cell fractions exceed 100%. A combined cell fraction of ≤100% indicates only weak evidence of such nesting. If only certain microdissections show a lower cell fraction for one SNV cluster compared to another, these clusters are deemed independent, not nested within one another. Our analysis was restricted to clusters with a mutant cell fraction of >0.05. We calculated the cell fraction for each SNV cluster by doubling the median VAF in each microdissection, assuming diploidy. SNV clusters with microdissections lacking shared mutations with others in the same cluster were divided into new, independent clusters. These were then reassessed for their phylogenetic relationships to all other clusters from the same patient biopsy, using the pigeonhole principle. Additionally, a naive Bayes algorithm was used to categorize each identified indel into the SNV clusters detected by the NDP algorithm.
Analysis of driver variants
To determine whether any coding variants were under selection in diseased liver tissues, the dN/dScv method12 on the gene level was used. This algorithm identifies genes with an excess of non-synonymous mutations relative to the expected number from the synonymous mutation rate. For this analysis, variants called from whole genomes were collapsed to unique events per SNV cluster identified by the NDP algorithm. Any variants identified in exome data that were not already called in whole genomes from the same patient were collapsed to unique mutations per individual and added to the dN/dScv input. In addition, we conservatively collapsed SNVs separated by ≤10 bp within the same LCM sample into multinucleotide variants. Genes with q values of <0.1 were considered to be under positive selection.
Extraction of mutational signatures from SNV contexts using HDP
To identify possibly undiscovered mutational signatures in the liver from A1AT deficiency and hemochromatosis patients, the HDP (https://github.com/nicolaroberts/hdp) was run on the 96 trinucleotide counts of all microdissected samples, collapsed to unique mutations across samples. To avoid over-fitting, samples with fewer than 50 mutations were not included in the signature extraction. HDP was run with individual patients as the hierarchy, in 20 independent chains, with a burn-in of 20,000 and the collection of 100 posterior samples off each chain with 200 iterations between each. Owing to the lack of novel signatures in this data set, the remainder of the mutational signature analysis was performed by fitting the identified set of signatures from HDP to trinucleotide counts from each microdissection using the R package sigfit (https://doi.org/10.1101/372896).
Protein structure prediction modeling
Structural predictions of the Z-K367*, Z-E387* and Z-M398delFS somatic mutant A1AT proteins were performed using Pymol (v.2.5.2, Schrodinger) to map amino acid sequences onto the crystal structure of native human A1AT (PDB 1QLP)15, identifying secondary structures lost in somatic mutant proteins. To predict the ability of somatic mutant proteins to form mixed polymers with full-length Z-A1AT, their sequences were mapped onto a single protomer within the crystal structure of a human Z-A1AT polymer (PDB 3T1P)16. Atoms of the 3T1P protomer that are lost through truncation of somatic mutants were removed from the displayed image to highlight any incompatibility with polymerization. The two missense residues in Z-M398delFS (F396Y, L397D) were modeled using the Pymol mutagenesis function, selecting side chain rotamers of Y396 and D397 that best conserved the resolved density in 3T1P. Somatic mutant structural models did not undergo energy minimization or geometry optimization processes and hence are used only to predict the feasibility of polymerization, not changes to the protein fold. Structural prediction of Z-M398delFS A1AT was carried out using AlphaFold 3 (ref. 51), in which the top-ranked model is displayed.
Cloning and constructs
Somatic variants of Z-A1AT (Z-K367*, Z-E387*) were generated by site-directed mutagenesis of the Z-A1AT coding sequence (untagged and N-terminally tagged with HaloTag) used previously17. The sequences of primers used in this study are provided in Supplementary Table 3. Bicistronic vectors for co-expression of A1AT with an ER marker protein were generated from pGL4.2 encoding A1AT tagged with HaloTag (M-A1AT, Z-A1AT, Z-K367*-A1AT and Z-E387*-A1AT variants) and the ER marker protein moxsynGFP-KDEL by Gibson assembly (New England Biolabs) to form pGL4.2_HaloTag-A1AT_ER-moxGFP-KDEL variants. For the expression of two A1AT forms to mimic heterozygosity, the ER-moxGFP-KDEL in pGL4.2_HaloTag-Z-A1AT_ER-moxGFP-KDEL (SJM1134) was replaced with untagged A1AT variant coding sequences using Gibson assembly. Sequencing of the plasmids was carried out at Plasmidsaurus (Oxford Nanopore Technologies).
Mammalian cell culture
CHO cells (Clontech) were cultured in F12 Ham’s nutrient mixture (Merck) supplemented with 10% FBS and 2 mM GlutaMAX (Thermo Fisher Scientific) at 37 °C and 5% CO2. CHO Tet-ON cells with inducible expression of Z-A1AT were cultured in high-glucose DMEM (Merck) supplemented with 10% tetracycline-free FBS, 2 mM GlutaMAX and non-essential amino acids (Thermo Fisher Scientific). COS7 cells (MERCK) were cultured in high-glucose DMEM supplemented with 10% FBS and 2 mM GlutaMAX.
Live-cell imaging
CHO parental cells were transfected with a bicistronic vector encoding moxGFP-KDEL and HaloTag-A1AT (M, Z, Z-K367* and Z-E387* variants), performed according to the Lipofectamine LTX reagent protocol (Life Technology). Then, 24 h later, cells were sorted for a GFP-positive population using the BD Influx Cell Sorter and then seeded at 1 × 10⁴ cells per cm2 in an eight-well ibidi slide. Imaging was performed 48 h after seeding. Before imaging, cells were labeled with 0.5 µM JFX549 (Janelia Fluor) in Opti-MEM for 15 min at 37 °C. Airyscan images were collected on an LSM880 (Zeiss) confocal microscope using an Airyscan detector and processed using the Zen (v.2.6) software package (Black edition, Zeiss). Quantitation of ER morphology using co-expression of ER-moxGFP-KDEL was performed using standard confocal imaging using the ImageJ (Fiji, v.2.14.0/1.54f) software package. Cells were counted based on ER morphology and categorized as either reticular ER or as containing ER inclusions. Quantitation was performed using the moxGFP-KDEL channel to avoid bias introduced by variable accumulation (and hence fluorescence intensity) of different A1AT variants. To quantify ER morphology in cells co-expressing variants of untagged antitrypsin with HaloTagged Z-A1AT, as a mimic of heterozygous expression, CHO cells were transfected as described above with the relevant bicistronic vector. Cells were labeled with JFX549 HaloTag ligand after 48 h expression, then imaged using a Zeiss LSM980 in Airyscan mode. Images were processed using Zen blue software before a gamma correction of 0.5 was applied to allow simultaneous visualization of high-intensity and low-intensity features. Cells were then categorized as having either reticular or inclusion-containing ER morphology.
Single-particle tracking
Single-particle tracking of HaloTag-A1AT variants was performed as described previously18 using Trackmate (v.7) software22. In brief, COS7 cells were transfected 4 h after seeding using 1 µg DNA and 3 µl Fugene 6 (Promega) as per the manufacturer’s instructions, to drive expression of an ER marker protein (mEmerald-KDEL) and HaloTag-A1AT variants. Cells were imaged 18 h after transfection, following labeling with PA-JF646 photoactivatable ligand52.
Sandwich ELISA for A1AT
CHO cells were seeded at a density of 2.08 × 10⁴ cells per cm2 in six-well cell culture plates (Greiner Bio-One), as described above for CHO parental cells. Cell culture media was substituted with 1 ml of Opti-MEM reduced serum medium (ThermoFisher Scientific) 24 h after transfection. Conditioned Opti-MEM and cell lysates were collected 48 h after transfection and subject to ELISA for A1AT as described previously17, using the monoclonal anti-A1AT antibody mAb3C11 (ref. 53) (a kind gift from David Lomas).
Native PAGE and SDS–PAGE
Native PAGE and SDS–PAGE were performed as described previously18. In brief, parental CHO and Tet-On CHO cells were seeded at a density of 2.08 × 10⁴ cells per cm2 and transfected as described above for CHO parental cells. For native PAGE, sonicated soluble lysate containing 80 μg of protein, or an equivalent volume of the corresponding insoluble lysate, was loaded onto an acrylamide native gel (resolving gel composition: 7.5% w/v acrylamide–bisacrylamide mixture (37.5:1), 0.37 mM Tris-HCl pH 8.8, 0.12% w/v APS, 0.2% v/v TEMED; stacking gel composition: 5.3% w/v acrylamide–bisacrylamide mixture (37.5:1), 110 mM Tris-HCl pH 6.8, 0.125% w/v APS, 0.15% v/v TEMED). For SDS–PAGE, soluble lysate containing 80 μg of protein, or an equivalent volume of the corresponding insoluble lysate, was loaded on a 10% acrylamide gel. A monoclonal α1-antitrypsin antibody (MA5-15521, Thermo Fisher Scientific) raised against a peptide consisting of amino acids 40–184 of human A1AT was used for SDS–PAGE immunoblotting. A polyclonal antibody raised against full-length human A1AT (A0409, Sigma-Aldrich) was used for native PAGE western blot (total α1-antitrypsin pool). The human A1AT polymer-specific mAb2C1 antibody (HM2289, Hycult Biotechnology) was used for native PAGE detection of polymers.
Z-A1AT polymer immunohistochemistry
Immunohistochemistry staining was performed on liver tissue sections from subjects with A1AT deficiency, adjacent to those on which LCM was previously performed. Sections (5 µm thick) were cut from PAXgene-fixed paraffin-embedded tissue blocks and mounted on Superfrost Plus glass microscope slides. Sections were dewaxed by sequential immersion in xylene two times for 2 min, 100% ethanol two times for 2 min, 70% ethanol for 1 min and then deionized water for 1 min. Endogenous peroxidase was blocked by soaking slides in methanol with 0.3% hydrogen peroxide solution for 30 min. After washing the slides in TBS, off-target secondary antibody was blocked by soaking the tissue sections in 3% normal horse serum (VECTASTAIN Elite ABC-HRP Mouse IgG Kit, Vector Laboratories) in TBS for 1 h. Tissue sections were washed in TBS and incubated overnight in 1:50 dilution of the polymer-specific mAb2C1 antibody (Hycult Biotech, cat. no. HM2289). The next day, tissue sections were incubated with horseradish peroxidase (HRP)-conjugated horse anti-mouse IgG secondary antibody (1:200, VECTASTAIN Elite ABC-HRP Mouse IgG Kit, Vector Laboratories) for 1 h. After the removal of unbound antibodies, HRP activity was developed with diaminobenzene. The sections were then counterstained with Mayer’s hematoxylin, rinsed, rehydrated, mounted and imaged using a NanoZoomer 2.0-HT slide scanner (Hamamatsu Photonics).
The 2C1 staining intensity from regions of interest was scored (0–3) by four independent scorers (V.K., J.C., S.J.M. and T.C.) who were blinded to the genotype of the region of interest; a mean of these scores was reported. Regions of interest were grouped based on SERPINA1 genotype: non-truncating variants included L12delFS, F47InsFS, L124delFS, L144delFS, Q180delFS, K192insFS, V205delFS, Q236delFS and L397delIF. Truncating variants included K367*, G373delFS, G373insFS, M382delFS, S383insFS, P386insFS, E387insFS, E387* and F396delFS.
HaloTag pulse–chase of A1AT
CHO parental cells were transfected using the Invitrogen Neon Transfection System with 5 μg of DNA encoding HaloTag-A1AT (M, Z, Z-K367* and Z-E387* variants) per 5 × 10⁵ cells using three electric pulses at 1,400 V and 10 ms width. Cells were labeled with PA-JF646 photoactivatable ligand after 42 h and chased for a further 24 h. Cells were collected at 0, 1.5, 3, 6, 12 and 24 h time points. Cell lysates were sonicated in a water bath sonicator for 30 min at 4 °C (whole-cell lysate). Then, 60 μg of protein lysates from the first time point and an equivalent volume of protein lysates from subsequent time points were prepared in SDS loading buffer for SDS–PAGE analysis. Gel fluorescence was detected using a Li-Cor CLx scanner.
HaloTag pulse–chase of Z-K367* with inhibitors of degradation
CHO parental cells were transfected using the Invitrogen Neon Transfection System as above. Cells were labeled with PA-JF650 photoactivatable ligand after 42 h and substituted with media containing 5 μM lactacystin, 100 nM bafilomycin or both and chased for a further 6 h. Cells were collected at 0, 1.5, 3 and 6 h. Then, 50 μg of protein lysates from the first time point and equivalent volumes of protein lysates from subsequent time points were prepared in SDS loading buffer for SDS–PAGE analysis as previously described. Gel fluorescence was detected using a Li-Cor CLx scanner.
HaloLink pulldown of A1AT
CHO Tet-ON cells with inducible expression of untagged Z-A1AT, as described above, were treated with 1 μg ml−1 doxycycline for 48 h. Cells were collected by washing twice with PBS on ice before applying 200 µl of ice-cold lysis buffer (50 mM Tris-HCl pH 7.4, 150 mM NaCl, 1% Triton) containing 1× protease inhibitor (G6521, Promega). The cell lysate supernatant was used for the subsequent steps of the HaloLink pulldown analysis. Equal amounts of protein lysates were incubated with Magne HaloTag beads (Promega, cat. no. G7281) overnight at 4 °C in a rotor. Beads were washed four times with lysis buffer, and protein interactors of HaloTag fusion proteins were liberated with 2× SDS–PAGE sample buffer (312.5 mM Tris-HCl pH 6.8, 50% v/v glycerol, 10% w/v SDS, 0.05% w/v Bromophenol Blue, 50 mM dithiothreitol) by heating at 75 °C for 10 min and separation from HaloTag bead. SDS–PAGE was performed on eluted material and 80 μg of input, followed by immunoblotting as described above.
Statistics and reproducibility
Statistical analyses were performed using R (v.4.3.1) or GraphPad Prism (v.9); statistical tests used, numbers of biological replicates and the P values are described in the figure legends; q values were calculated using the Benjamini–Hochberg correction for multiple hypothesis testing. No data were excluded from the analyses. The experiments were not randomized and the investigators, apart from the pathologist, were not blinded to allocation during the experiments and outcome assessment.
Reporting summary
Further information on research design is available in the Nature Portfolio Reporting Summary linked to this article.
Responses