ImmuneLENS characterizes systemic immune dysregulation in aging and cancer
Main
Measuring the quantity, quality and location of immune cells is vital to understanding their role and function. In cancer research, studies have focused on tumor-infiltrating lymphocytes and their roles in cancer evolution and immune evasion1,2,3,4,5.
High tumor T cell infiltration is prognostic in cancer6,7 and influences immunotherapy response8. However, B cell infiltration has been linked to both cancer promotion and inhibition9. Classifying tumor-infiltrating B cells into different lineages might elucidate their role in cancer, but such analysis without direct assays of B cell markers with flow cytometry, targeted B cell receptor repertoire sequencing or single-cell RNA sequencing (RNA-seq) is challenging.
Although circulating immune cell counts from routine blood tests have been associated with response to therapy and prognosis in cancer10,11, a systematic exploration of their relative importance compared to tumor-infiltrating immune cells and their clinical correlates is lacking.
Here we present immune lymphocyte estimation from nucleotide sequencing (ImmuneLENS)—a method to quantify immune content from whole-genome sequencing (WGS) data and available at https://github.com/McGranahanLab/ImmuneLENS. In addition to T cell content, our method predicts B cell fraction and class switching from the IGH locus and provides estimates for both T cell receptor (TCR) and B cell receptor (BCR) diversity.
Results
Inferring T cell and B cell fractions from WGS data
WGS enables in-depth characterization of somatic mutations, structural variants and copy number alterations12. However, whether WGS can simultaneously be used for the estimation of lymphocyte infiltration has not been extensively evaluated.
To this end, we created ImmuneLENS. This tool significantly enhances and extends our previous method, T cell ExTRECT6 (see Methods and Fig. 1a for an overview), which was designed for whole-exome sequencing (WES). We made three improvements to the method. First, we introduced a segment-based model, enabling precise breakpoint fitting based on the locations of individual V and J segments. Second, harnessing the predicted V and J segment usage, the model estimates both lymphocyte cell fractions and clonotype diversity. Finally, we introduced an estimate of B cell fraction and immunoglobulin (Ig) class switching from the IGH locus, enabling distinction between non-class-switched B cells (IgM/IgD) and class-switched B cells that produce IgA, IgG or IgE antibodies (Extended Data Fig. 1a and Supplementary Fig. 1). The B cell fraction model also incorporates an IGH locus germline copy number variant caller (Supplementary Fig. 2). Example output of ImmuneLENS is illustrated in Extended Data Fig. 1b,c.
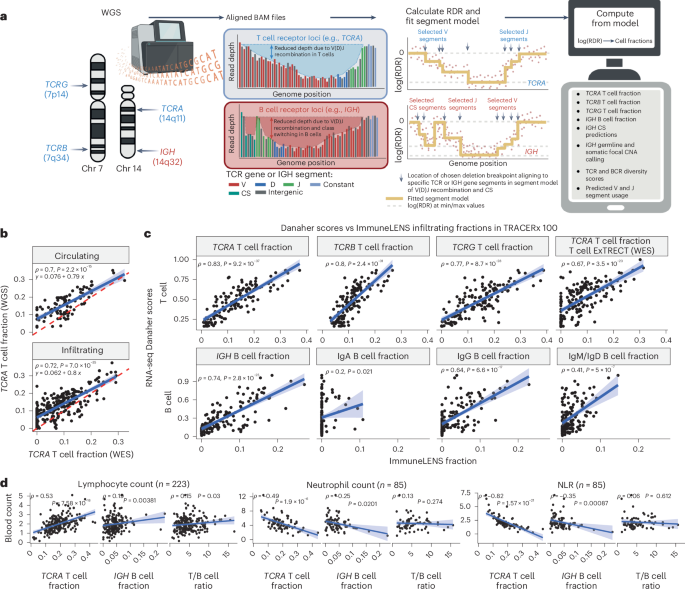
a, Overview of the ImmuneLENS method. The figure is created with BioRender.com. b, Scatter plot of TCRA T cell fractions calculated from TRACERx WGS versus WES data. The red dotted line represents y = x; the blue line shows the line of best fit with a light blue-shaded 95% confidence interval (CI). c, Scatter plots comparing ImmuneLENS fractions from TRACERx100 WGS and TCRA T cell fractions from T cell ExTRECT (TRACERx100 WES data) against T cell- and B cell-related Danaher scores from matched RNA-seq samples. The blue line represents the line of best fit with a light blue-shaded 95% CI. d, Correlation of TCRA T cell fraction, IGH B cell fraction and T/B cell ratio with date-matched blood count data (lymphocyte count, neutrophil count and NLR values) within the 100KGP cohort. The blue line represents the line of best fit with a light blue-shaded 95% CI. P values for Spearman’s ρ were derived from a two-tailed t distribution using the correlation coefficient and sample size. CNA, copy number alteration; CS, class switching; RDR, read depth ratio.
WGS enables accurate measurement of T cell and B cell fraction
We first evaluated the accuracy of T cell fractions predicted by ImmuneLENS on TRACERx100 (ref. 13) lung cancer samples that had both matched WES and WGS (n = 322) or orthogonal RNA-seq data (n = 126).
WES and WGS TCRA T cell fractions showed positive correlations in both blood (ρ = 0.70, P = 2.2 × 10⁻¹⁵) and tumor samples (ρ = 0.72, P = 7.0 × 10⁻³⁵; Fig. 1b). Notably, fewer samples exhibited no T cell infiltrate in WGS than WES (54 WES samples had <10−4 T cell fraction compared to only two of the WGS samples), likely reflecting ImmuneLENS’ increased sensitivity (Methods; Supplementary Fig. 3).
αβ T cells have recombined TCRα and TCRβ (encoded by TCRB) chains, whereas γδ Τ cells have TCRγ (encoded by TCRG) and TCRδ chains (encoded by TCRD). TCRB and TCRG can provide T cell fraction estimates independent of TCRA. The T cell fraction estimates of these distinct T cell classes were all positively correlated with each other, indicating that each independently measures T cell content (ρ > 0.8, P < 10−70; Extended Data Fig. 1d). There are two important caveats to this result. First, TCRB T cell fraction was systematically smaller than TCRA (line of best fit: y = 0.56× + 0.042), likely due to allelic exclusion14. Second, TCRG, which is typically expressed only in γδ T cells (1–5% of CD3+ T cells15), strongly correlated with TCRA, suggesting αβ T cells commonly retain rearranged TCRG loci. Previous reports have shown that αβ T cells frequently rearrange their TCRG locus before committing to the αβ lineage16. Thus, TCRG appears to measure total T cell fraction rather than solely γδ T cells.
We further validated ImmuneLENS using TRACERx100 RNA-seq data (n = 126). TCRA, TCRB and TCRG T cell fractions strongly correlated with the Danaher T cell signature17, previously shown to reflect T cell content18 (TCRA: ρ = 0.83, P = 9.2 × 10−37; TCRB: ρ = 0.8, P = 2.4 × 10⁻³¹; TCRG: ρ = 0.77, P = 8.7 × 10⁻²⁸; Fig. 1c). Consistent correlations were also observed with RNA-seq signatures from TIMER19, CIBERSORT20, xCell20 and scores from ref. 21 (Extended Data Fig. 1e). Likewise, IGH B cell fraction strongly correlated with Danaher RNA-seq-based B cell score (Fig. 1c; ρ = 0.74, P = 2.8 × 10⁻²⁵). However, we observed that correlation strength varied by class—IgG (ρ = 0.64, P = 6.6 × 10⁻¹⁷), IgM/IgD (ρ = 0.41, P = 5 × 10⁻⁷) and IgA (ρ = 0.2, P = 0.021). Thus, conceivably IgA B cells may be underrepresented in RNA-seq data or overestimated in DNA (Supplementary Figs. 4 and 5). These results aligned with other RNA-seq-based B cell signatures (Extended Data Fig. 1e). Samples with high WGS-inferred B cell fractions (>median) showed significant enrichment of B cell gene expression for all subsets, even IgA (IgG: adjusted P = 4.4 × 10⁻⁴; IgM/IgD: adjusted P = 1.3 × 10⁻³; IgA: adjusted P = 2.4 × 10⁻³; Extended Data Fig. 1f).
ImmuneLENS provided accurate T cell measurements at depths as low as 5× for TCRA (R = 0.96, P = 5.4 × 10−223), TCRB (R = 0.61, P = 6.59 × 10−43) and TCRG (R = 0.72, P = 1.93 × 10−67) as evidenced using downsampled data (Extended Data Fig. 2a–d). For B cell quantification, >10× was required for accurate germline copy number inference (Extended Data Fig. 2e). Similarly, correction for possible tumor copy number alterations was only accurate at depths >20× (Extended Data Fig. 2f). Consistent results were observed for matched high and low-coverage WGS data (Supplementary Fig. 6).
To further validate ImmuneLENS, we applied the tool to blood-derived WGS samples with date-matched blood count data from 441 participants of the 100,000 Genomes Project (100KGP; Methods). Circulating T cell fraction correlated positively with lymphocyte count (ρ = 0.53, P = 7.6 × 10⁻¹⁸) and negatively with both neutrophil count (ρ = −0.49, P = 1.9 × 10⁻⁶) and neutrophil-to-lymphocyte ratio (NLR) (ρ = −0.82, P = 1.6 × 10⁻²¹; Fig. 1d). These data suggest that TCRA T cell fraction serves as an NLR proxy. A weak negative correlation with albumin concentration was observed (Extended Data Fig. 3a; ρ = −0.25, P = 2.1 × 10⁻⁶). No significant associations were found with C-reactive protein or ferritin (Extended Data Fig. 3a), although weak negative correlations existed between white blood cell count and both T cell fraction (ρ = −0.18, P = 0.0076) and T/B cell ratio (ρ = −0.17, P = 0.013). Similar trends were observed for IGH B cell fraction (Fig. 1d). Notably, the T/B cell ratio correlated significantly with lymphocyte count (ρ = 0.15, P = 0.03) but not with neutrophil count (ρ = 0.13, P = 0.27) or NLR (ρ = 0.06, P = 0.612; Fig. 1d). Thus, the T/B cell ratio provides a measure of lymphocyte count, which is independent of neutrophil levels.
Investigating T cell receptor diversity from WGS data
The ability of ImmuneLENS to fit individual V and J segments allows TCR and BCR diversity analysis from WGS data (Extended Data Fig. 4a).
We assessed TCR diversity accuracy from WGS data using three methods. First, we compared ImmuneLENS output with matched TCR-sequencing (TCR-seq) data in TRACERx. ImmuneLENS’ T cell receptor alpha variable (TRAV) segment proportions were significantly different between quartiles representing different levels of actual segment usage inferred from TCR-seq (Kruskal–Wallis, P = 3.3 × 10⁻³¹; Extended Data Fig. 4b). ImmuneLENS likely underestimates TCR diversity, illustrated by low TRAV segment usage predictions in Extended Data Fig. 4b. Second, we compared Shannon diversity scores from WGS-derived V segment usage (ImmuneLENS) with the calculated TCR repertoire diversity from RNA-seq data (using MiXCR22). A significant correlation was observed between DNA- and RNA-derived TCR diversity scores (Extended Data Fig. 4c; ρ = 0.34, P = 7.4 × 10⁻⁷). Third, using the Jensen–Shannon divergence, we found significantly more similar repertoires in samples from the same patient than from different patients, for both infiltrating–infiltrating and infiltrating–circulating comparisons (Wilcoxon rank-sum P = 9.74 × 10−92 and P = 0.011, respectively; Extended Data Fig. 4d).
These results therefore demonstrate that predicted TRAV segments enable the assessment of TCR diversity within samples and enable TCR repertoire comparisons across samples.
The immune landscape in the 100KGP cohort
Having validated the accuracy of ImmuneLENS, we next applied the tool to 90,232 WGS samples from the 100KGP cohort23 (see Fig. 2a and Supplementary Data for a full clinical overview). This included 14,501 cancer samples across 33 distinct histologies (>100 participants each), with 13,870 having matched blood samples. In total, 631 cancer samples, including 538 with hematological cancers, lacked matched blood samples. Additionally, blood samples from 30,665 healthy individuals sequenced as relatives within the 100KGP rare disease cohort were analyzed. The remaining 30,565 WGS germline samples from the 100KGP rare disease cohort were excluded from our main analysis because they originated from either the rare disease probands or non-blood samples. We analyzed the following two measures: infiltrating immune cell fraction (from tumor WGS samples) and circulating immune cell fraction (from the buffy coat of blood WGS samples).
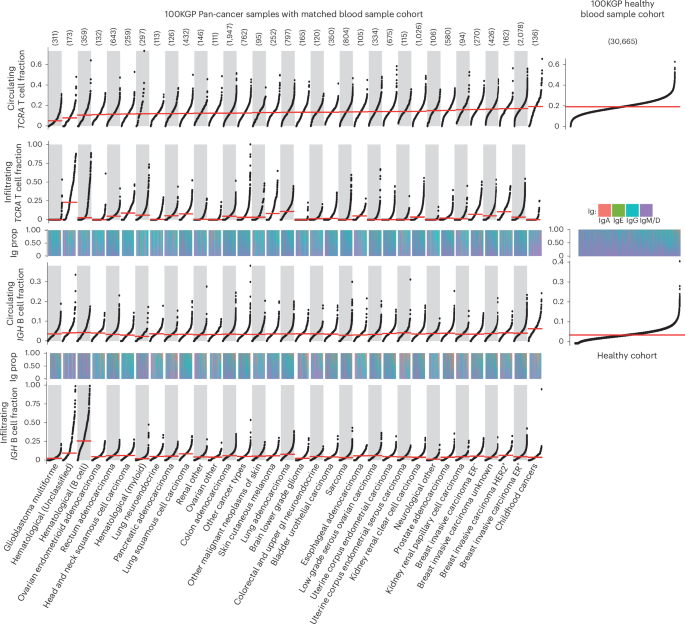
The number of tumor samples per cancer histology is given above the plot. The panels represent snake plots for circulating and infiltrating TCRA T cell fractions and IGH B cell fractions, with each point representing a single blood or tumor sample. Above each IGH B cell fraction snake plot is a track, shown as a heatmap, displaying the proportion of different Ig B cells for each sample. Histology groups are arranged in ascending order based on the median circulating TCRA T cell fraction, and within each group, samples are sorted from lowest to highest value in each snake plot. Right, snake plots for the circulating T cell and B cell fractions within the 100KGP healthy cohort. No significant differences were identified (using ANOVA) in the proportions of B cell Ig status among cancer histology groups in either circulating or infiltrating samples. Horizontal red lines represent the median value per histology group. GI, gastrointestinal.
Significant differences in T cell fractions were observed between cancer types for both circulating and infiltrating T cells (Kruskal–Wallis, P = 5.3 × 10−209 and P = 3.7 × 10−490, respectively). Circulating T cell fractions were highest in patients with childhood cancer (median = 0.19) and lowest in patients with glioblastoma (median = 0.051). The low circulating T cell fraction in patients with glioblastoma may reflect steroid treatment, which increases circulating neutrophil levels24. Likewise, both infiltrating and circulating B cell fractions differed significantly across cancer types (Kruskal–Wallis, P = 3.8 × 10−291 and P = 3.3 × 10−42, respectively; Fig. 2). We found similar significant differences between cancer types for infiltrating T cells when adjusted by age and for the T/B cell ratio (Extended Data Fig. 5a). Additionally, consistent results in the Pan-Cancer Analysis of Whole Genomes (PCAWG)12 and The Cancer Genome Atlas (TCGA) WGS and WES datasets were identified (Supplementary Fig. 7).
Tumor samples exhibited higher B cell content compared to blood samples (effect size = 0.181, P = 9.6 × 10−199; Extended Data Fig. 6a); conversely, T cell content was higher in blood samples than in tumors (effect size = 0.522, P < 2.22 × 10−308; Extended Data Fig. 6a). Circulating and infiltrating T cell fractions showed no clear correlation (R = 0.03, adjusted P = 0.068), except in colorectal adenocarcinoma (R = 0.13, adjusted P = 6.9 × 10⁻⁷; Extended Data Fig. 6b).
ImmuneLENS revealed differences in B cell class switching between infiltrating and circulating B cells across cancer types (Fig. 2a). Elevated tumor-infiltrating B cell levels compared to circulating were primarily due to an enrichment in class-switched IgA and IgG B cells (IgA: effect size = 0.21, P = 6.2 × 10−270; IgG: effect size = 0.046, P = 4.1 × 10⁻¹⁴; Extended Data Fig. 6a). IgM/IgD B cells showed a smaller but significant difference between circulating and infiltrating fractions (IgM/IgD: effect size = 0.023, P = 1.3 × 10⁻⁴; Extended Data Fig. 6a). This highlights key differences in the function and make-up of circulating and tumor-infiltrating B cells, underscoring the specialized roles of B cell subtypes. For instance, IgM antibodies in the circulatory system have an important role in activating the complement system, while in mucosal tissue, IgA antibodies are crucial for immune homeostasis. Consistent with these findings, we observed a significantly higher T/B cell ratio in blood compared to tumor samples (effect size = 0.61, P < 2.22 × 10−308; Extended Data Fig. 6a).
IGH B cell fractions, particularly IgG, correlated strongly between circulating and infiltrating in the majority of histologies (pan-cancer IGH: R = 0.17, adjusted P = 2.7 × 10−86; see full results in Supplementary Data and Extended Data Fig. 6b). Additionally, we found that TRAV segment usage differed significantly between circulating and infiltrating T cells and across cancer types, with TRAV1–2 enriched in mucosal cancers. This may reflect mucosal-associated invariant T cells, a subset of T cells that recognize bacterial-produced metabolites that exclusively use the TRAV1–2 segment25 (Supplementary Data and Supplementary Fig. 8).
Determinants of circulating leukocyte fraction
Given the wide range of circulating immune fractions across both healthy participants and patients with cancer, we next sought to investigate the key determinants of leukocyte fraction.
Analysis of 100KGP participants in 5-year age brackets revealed declining T cell and B cell fractions with age in both healthy and cancer cohorts. For B cells, this effect was strongest for the IgM/IgD B cells, with the relative proportion of class-switched B cells increasing with age (Fig. 3a). Patients with cancer consistently exhibited lower circulating T cell and B cell fractions and higher class-switched B cell proportions compared to healthy individuals. Notably, on average a 40–45-year-old female patient with cancer has similar median circulating T cell fraction levels to a healthy >80-year-old female (0.161 versus 0.157). The decreased T/B cell ratio in the blood of patients with cancer suggests that this effect extends beyond a relative increase in neutrophils. Thus, in both healthy individuals and those with cancer, age is a key determinant of circulating immune fractions, and patients with cancer exhibit an inflated ‘immunological age’.
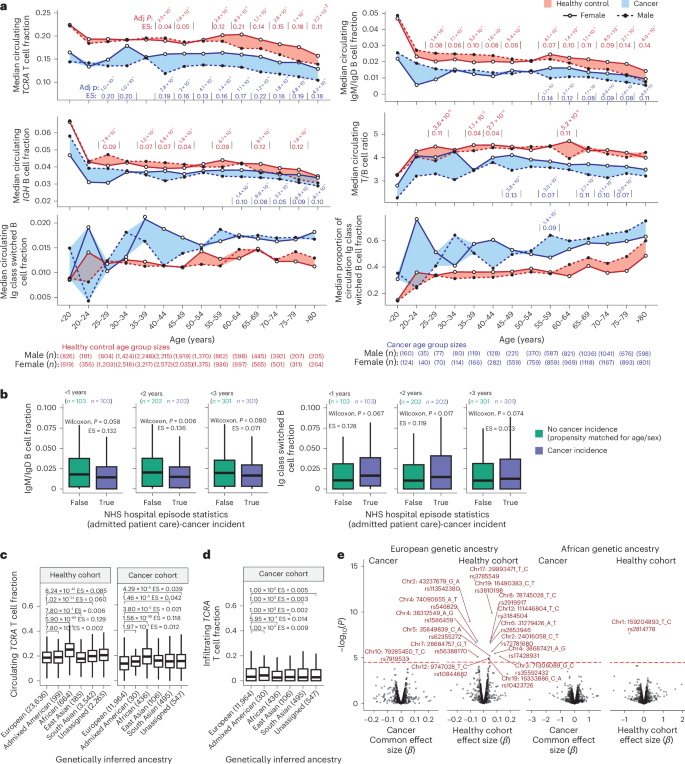
a, Ribbon plots of ImmuneLENS-related fractions in 5-year age brackets, split by the healthy control and cancer cohorts. The width of bands represents the extent of sexual dimorphism between male and female individuals, with significance assessed by two-sided Wilcoxon rank-sum tests within each age group and adjusted P values with effect size (ES) values shown. b, Boxplots of IgM/IgD and Ig class-switched B cell fractions from a subset of the healthy cohort with recorded cancer incidence post-WGS sequencing (from hospital episode statistics), compared to an age- and sex-matched propensity cohort of the same size. c, Boxplots of blood TCRA T cell fraction versus genetically inferred ancestry in the 100KGP healthy and cancer cohorts. d, Boxplots for tumor TCRA T cell fraction versus genetically inferred ancestry in the 100KGP cancer cohort. e, Volcano plots of known GWAS SNP associations with circulating TCRA T cell fraction. Multiple hypothesis adjustments were performed using the Benjamini–Hochberg method. Boxplots in b–d show the median and lower and upper quartiles, with whiskers extending to 1.5× interquartile range. Two-sided Wilcoxon rank-sum tests were used to assess the significance between groups in b–d. The P values in e are derived from PLINK software, which uses a linear regression model and performs a Wald test for each SNP. For the cancer cohort, this was done separately for each histology, and P values were combined using a meta-analysis with a common effects model.
Sex differences in circulating immune fractions were evident in both cancer and healthy cohorts. Female patients with cancer showed significantly higher T cell fractions than male patients across most age groups (adjusted P < 0.001 for all age groups >40 years; Fig. 3a and Supplementary Data). In the healthy cohort, significant (adjusted P < 0.001) sex differences were primarily observed in older age groups (>55 years; Fig. 3a). Likewise, the T/B cell ratio difference between sexes was more pronounced in people with cancer, particularly in the 65–69 (adjusted P = 2.7 × 10⁻⁵, effect size = 0.11) and 70–74 age groups (adjusted P = 1.1 × 10⁻⁴, effect size = 0.10), compared to the healthy cohort (significant at adjusted P < 0.001 only in the 60–64 age group, adjusted P = 5.2 × 10⁻⁴, effect size = 0.11). This suggests neutrophil count may contribute to T cell fraction differences in the healthy cohort. For the IgM/IgD B cell fraction in the healthy group, a sex-based switch was observed from age 55, with male individuals higher initially and female individuals after age 55. In the cancer cohort, female patients exhibited higher B cell fractions in age groups >55. These trends were generally consistent across individual cancer types (Supplementary Fig. 9 and Supplementary Data).
To assess whether circulating immune cell levels could predict future cancer incidence, we identified 301 participants within the 100KGP healthy cohort who developed cancer within 3 years following germline blood sequencing. Compared to a set of controls propensity-matched for age and sex, those diagnosed with cancer within 2 but not 3 years showed significantly lower IgM/IgD (2 years: P = 0.006, effect size = 0.14; 3 years: P = 0.08, effect size = 0.07) and higher Ig class-switched B cell fractions (2 years: P = 0.02, effect size = 0.12; 3 years: P = 0.07, effect size = 0.07; Fig. 3b). This suggests circulating immune fraction may serve as a potential cancer marker.
Association of genetic ancestry with lymphocyte fraction
Beyond the effects of age and sex, genetic ancestry may influence immune infiltrate26 and leukocyte counts in blood27. While germline variants associated with the immune system may affect cancer outcomes28, most relevant GWAS studies use samples from non-cancer patients.
The 100KGP participants were grouped into super-populations defined from the 1000 Genomes Project29. Significant differences in circulating T cell fractions were observed among genetically inferred ancestry groups in both healthy and cancer cohorts, with genetic African ancestry showing significantly higher immune fractions (Fig. 3c). However, no significant genetic ancestry-based differences were found in tumor-infiltrating T cell fractions (Fig. 3d).
We examined 1,635 SNPs known to influence circulating leukocyte traits27 to evaluate whether these could explain differences in lymphocyte fractions between individuals (Methods and Supplementary Data). After accounting for linkage disequilibrium (LD), 15 SNPs were significantly associated with circulating T cell fraction in the healthy European cohort, but only one SNP in the European cancer cohort (Fig. 3e). The Duffy-negative SNP rs2814778, linked to neutropenia30, was significant in the African healthy cohort but not in the African cancer cohort (Fig. 3e). Only 7 out of 15 significant SNPs in the healthy European cohort were also associated with immune cell levels (unadjusted P < 0.05) in the European cancer cohort (Extended Data Fig. 7a,b). This suggests that germline SNPs influencing T cell fraction differ between healthy and cancer contexts (Supplementary Fig. 10).
Quantifying selection pressure due to immune infiltration
We reasoned that the immune system may act as a potent selection pressure during cancer evolution. We, therefore, investigated whether mutations in known cancer genes were associated with tumor immune infiltrate.
Using a Poisson model31, controlling for the background mutation rate, cancer type, sex and tumor purity, we identified seven genes significantly associated with infiltrating T cell fraction. Nonsynonymous mutations in PIK3CA, MAP3K1, PTEN, CBFB and CDH1 were enriched in T cell-depleted tumors, while MUC16, B2M and BAP1 mutations were enriched in T cell-replete tumors (Fig. 4a and Supplementary Data). Additionally, MUC4 mutations were associated with IgM/IgD B cell-depleted tumors, while KMT2C mutations were linked to IgG B cell-enriched tumors (Extended Data Fig. 8a and Supplementary Data).
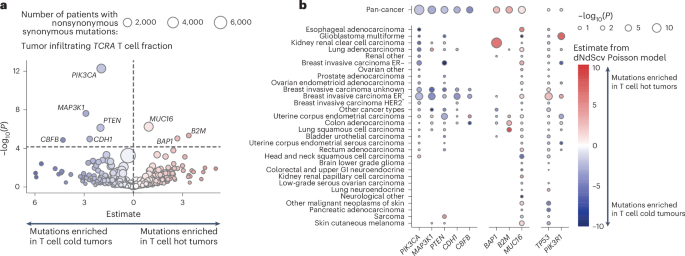
a, Volcano plot showing results from a Poisson model predicting observed nonsynonymous mutations as a function of TCRA T cell fraction and other covariates (age, tumor mutation burden, sex and disease type). The plot shows the estimates and −log10(P) for the TCRA variable, highlighting genes where observed mutations significantly depend on T cell immune infiltration (hot tumors denote high levels of immune cell infiltration; cold tumors lack immune cell infiltration). Point size represents the number of patients in the cancer cohort with nonsynonymous mutations, excluding patients with hematological cancers. Genes tested were limited to known cancer drivers from the Cancer Gene Census47. b, Bubble plot showing the significance of TCRA infiltrating T cell fraction within a Poisson model applied to individual cancer types. In both plots (a,b), P values represent the significance of the TCRA T cell fraction term in the Poisson model and are calculated using a Wald test.
Disease-specific effects were also identified (Fig. 4b). For example, TP53 nonsynonymous mutations were associated with increased T cell infiltrate in breast invasive carcinoma estrogen receptor-positive (BRCA ER+) tumors (estimate = 2.56, adjusted P = 6 × 10⁻⁴), while PIK3R1 nonsynonymous mutations were associated with T cell-enriched glioblastomas (estimate = 7.23, adjusted P = 0.003). Previous studies have linked TP53 alterations with increased T cell infiltrate in breast cancer32. Many disease-specific effects were also detected for B cell subsets. MUC4 nonsynonymous mutations were significantly associated with reduced IgM/IgD B cells in colon adenocarcinoma (estimate = −3.7, adjusted P = 0.007). NOTCH1 nonsynonymous mutations were associated with class-switched and IgA B cells in BRCA ER+ tumors (estimate = 10.6, adjusted P = 0.003), and nonsynonymous mutations in DGRC8 were associated with enriched IgA B cells in lung adenocarcinoma (estimate = 18.7, adjusted P = 0.04). MUC4 and KMT2C were both found to be significant in uterine corpus endometrial carcinoma, being associated with tumors enriched with IgA (MUC4: estimate = 3.58, adjusted P = 0.049; KMT2C: estimate = 4.80, adjusted P = 0.01) and depleted of IgG (MUC4: estimate = −4.85, adjusted P = 8 × 10⁻⁵; KMT2C: estimate = −3.82, P = 0.007, adjusted P = 1; Extended Data Fig. 8b and Supplementary Data).
These findings reveal diverse interactions between the tumor immune microenvironment and cancer cells. Somatic mutations may be selected in response to immune presence or promote immunosuppression, with effects varying by cancer type, histology and immune cell type.
Prognostic value of ImmuneLENS lymphocyte fraction
Infiltrating tumor lymphocytes6,33,34 and circulating immune cells10,35,36,37,38 have prognostic value in many cancer types. However, a direct comparison of both has proven challenging. We therefore used ImmuneLENS to compare the prognostic significance of circulating and tumor-infiltrating T cell and B cell fractions.
In the pan-cancer cohort, elevated circulating T cell fractions were strongly associated with improved overall survival (Fig. 5a; hazard ratio (HR) = 0.53, log-rank P = 2.8 × 10−73, split by the median). Infiltrating tumor T cells showed a significantly weaker association (Fig. 5a; HR = 0.86, log-rank P = 3.2 × 10⁻⁶; P = 2.68 × 10⁻²⁵, z test on the log of the HR values). Elevated circulating IGH B cells (HR = 0.79, P = 2 × 10⁻¹²) and IgM/IgD B cells (HR = 0.76, P = 4 × 10⁻¹⁶) were associated with better prognosis while infiltrating B cells and class-switched circulating B cells were not significant. The circulating T/B cell ratio, which is independent of neutrophil levels, was also significantly prognostic (Fig. 5a; HR = 0.76, log-rank P = 8.3 × 10⁻¹⁴).
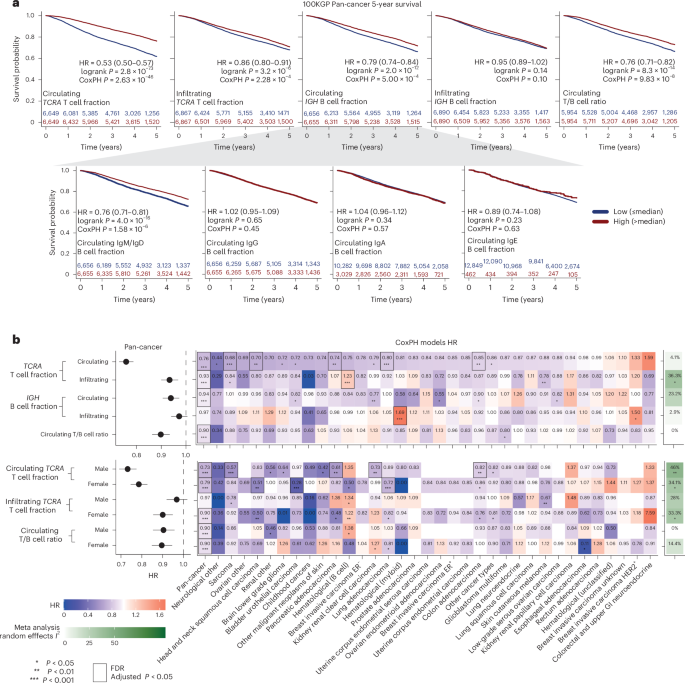
a, Five-year survival Kaplan–Meier plots for the entire pan-cancer 100KGP cohort, stratified into high and low groups based on the median circulating or infiltrating TCRA T cell fractions and IGH B cell fractions. b, Results from CoxPH models for 13,872 participants within the 100KGP pan-cancer cohort with complete clinical annotation. The models account for the effects of age, sex, genetically inferred ancestry, pretreatment chemotherapy and cancer stage. Left, pan-cancer HRs with 95% CIs. Right, a heatmap of HRs for different cancer histologies, including the I2 score from a meta-analysis using a random effects model across all histologies. Significance was calculated using Cochran’s Q test. Multiple hypothesis adjustments were performed using the Benjamini–Hochberg method, applied by row. Individual P values were calculated using a two-sided Wald test within the Cox model. *P < 0.05, **P < 0.01 and ***P < 0.001.
Circulating T cell fraction remained highly significant after adjusting for clinical factors in the pan-cancer cohort (Fig. 5b (HR = 0.76, P = 2.6 × 10−46) and Extended Data Fig. 9a) and within five individual cancer types after multiple hypothesis correction—head and neck squamous cell carcinoma (HR = 0.70, adjusted P = 4.68 × 10⁻²), pancreatic adenocarcinoma (HR = 0.74, adjusted P = 4.81 × 10⁻²), colon adenocarcinoma (HR = 0.85, adjusted P = 1.12 × 10⁻²), lung adenocarcinoma (HR = 0.80, adjusted P = 5.4 × 10⁻³) and sarcoma (HR = 0.68, adjusted P = 1.57 × 10⁻⁴). Conversely, tumor-infiltrating T cell fraction was only significant in the pan-cancer cohort (HR = 0.93, adjusted P = 3.99 × 10⁻³) and B cell hematological cancers, where higher infiltration correlated with worse prognosis (HR = 1.24, adjusted P = 3.99 × 10⁻³). We observed broadly consistent results using TCGA data (Extended Data Fig. 10a,b). Moreover, we observed that the infiltrating T cell fraction was associated with significant heterogeneity by cancer type (P = 0.02, Cochran’s Q test).
Circulating T/B cell ratio remained significantly associated with survival after controlling for clinical variables (HR = 0.90, adjusted P = 3.4 × 10⁻⁶), suggesting that both circulating T cells and neutrophils contribute to the prognostic value of circulating T cell fraction. A Cox proportional hazard (CoxPH) model including circulating T cell fraction, T/B cell ratio and their interaction revealed independent significance for both factors (TCRA: HR = 0.7, P = 9 × 10−41; T/B ratio: HR = 0.91, P = 0.014; interaction term: HR = 1.24, P = 2 × 10⁻⁸; Extended Data Fig. 9b). When stratifying patients by T/B cell ratio, circulating T cell fraction was prognostic in both the low (HR = 0.45, 95% confidence interval (CI): 0.40–0.51; Extended Data Fig. 9c) and high T/B cell ratio group (HR = 0.67, 95% CI: 0.60–0.75; Extended Data Fig. 9c), but was significantly more prognostic in the low group (P = 2.4 × 10⁻⁶, z test). When stratifying patients by circulating T cell fraction, higher T/B ratio correlated with better outcome in the low T cell group (HR = 0.82, P = 2 × 10⁻⁴; Extended Data Fig. 9d), while the opposite was true for the high T cell group (HR = 1.2, P = 0.0013; Extended Data Fig. 9d). Thus, this suggests that in patients with relatively low neutrophil levels in their blood, B cells confer an improved prognosis compared to T cells.
We next investigated sex-specific prognostic associations of circulating T cell fraction (Fig. 5b). In the pan-cancer context, both male (HR = 0.73, P = 1.5 × 10⁻²⁷) and female (HR = 0.79, P = 2.6 × 10⁻²⁰) individuals showed similar associations between high T cell fraction and improved prognosis. However, cancer-specific differences were evident. For example, higher T cell fraction was associated with a significantly better prognosis for females in bladder urothelial carcinoma (HR = 0.28, adjusted P = 2.53 × 10⁻³) and lung adenocarcinoma (HR = 0.72, adjusted P = 2.53 × 10⁻³). A random effects meta-analysis showed circulating T cell fraction had a uniform prognostic effect across cancer types (I2 = 4%, not significant). However, sex-specific analysis revealed significant heterogeneity (male: I2 = 46%, P = 0.006; female: I2 = 34%, P = 0.03).
Considered together, these findings highlight the clinical importance of circulating lymphocytes and the interplay between biological sex and immune activation in different cancers.
Discussion
We introduce ImmuneLENS, a method for inferring immune cell fractions from WGS data. Building upon our previous method T cell ExTRECT, ImmuneLENS not only provides more accurate T cell content inference but also expands functionality to measure B cell fraction, B cell class switching and T cell clonotype diversity.
To evaluate this approach, we applied it to the 100KGP cohort. In patients with cancer, circulating T cell and B cell fractions were reduced compared to healthy controls, and female individuals exhibited higher T cell fractions than male individuals, indicating significant sexual dimorphism. Although healthy controls also show sexual dimorphism, it appears mainly after age 55. Thus, ImmuneLENS quantified the sexual dimorphism in circulating immune cells, which is known to occur in both aging39 and cancer40.
In the healthy control cohort, we found significant associations between circulating T cell fractions and 15 SNPs at 11 genetic loci. This is consistent with recent work discussed in ref. 41, in which T cell ExTRECT6 was used on WGS data from 207,000 individuals and 27 loci associated with circulating T cell fraction were identified. Our analysis also identified an SNP within FOXP1 (rs35592432; P = 7.3 × 10⁻⁶) that was not reported in ref. 41, with the variant allele associated with an enrichment of T cells. We observed that more than half of SNPs (8/15) linked to circulating T cell fractions in healthy individuals were not linked within the cancer population. This discrepancy highlights the need for further research on how germline genetics influence immune composition in cancer.
We found that circulating T cell fractions in patients with cancer are more prognostic than tumor-infiltrating T cells. This relationship may reflect systemic inflammation from tumor growth42. The association of the T/B cell ratio with prognosis suggests lymphocyte depletion, not just increased neutrophils, contributes to this signal. Circulating lymphocyte fractions may indicate ‘immunological age’43, reflecting the diminishing ability of the immune system to suppress cancer. This hypothesis is supported by the reduction we observed in circulating IgM/IgD B cell fractions of healthy participants who later developed cancer; however, we found no similar association with T cell fractions.
Despite the technological advancement of ImmuneLENS, there are limitations. While ImmuneLENS can accurately estimate immune cell fractions at ≥5× WGS coverage, additional sequencing coverage is required for B cell germline copy number correction (>10×) and somatic copy number adjustment (>20×). Moreover, TCR repertoire analysis from WGS data lacks the accuracy to make it comparable to TCR-seq, and predicting exact clonotypes remains a challenge. We do not envisage this method replacing TCR-seq. Rather, it can provide orthogonal insight that was previously lacking in the TCR repertoire in samples with solely WGS. ImmuneLENS can accurately estimate B cell fractions and deconvolve the separate class-switched fractions. This has much potential outside the context of cancer, for instance, within autoimmunity research44,45,46.
In summary, with the growing size of population-level WGS datasets, we have provided a tool that can accurately quantify lymphocyte fraction without the need for additional data collection. We hope ImmuneLENS will enable a deeper exploration of immune dysregulation.
Methods
Statistical information
All statistical tests were performed in R 4.0.2. No statistical methods were used to predetermine the sample size. Tests involving correlations were done using stat_cor from the R package ggpubr (v0.6.0) with Spearman’s method, except for situations when we directly tested if there exists a linear relationship between two variables for which Pearson correlation was used. Tests involving comparisons of distributions were done using stat_compare_means using wilcox.test using either the unpaired option, performing a Wilcoxon rank-sum (Mann–Whitney U) test, or a paired Wilcoxon signed-rank test. Effect size values for the corresponding Wilcoxon tests were measured using the wilcox_effsize function from the rstatix package (v0.7.2). HR values and P values were calculated with the survival package (v3.1-12) for both Kaplan–Meier curves and the CoxPH model. HR values between different models were compared by using a z test on the log of the HR values. For all statistical tests, the number of data points included are plotted or annotated in the corresponding figure. Plotting and analysis in R also made use of the ggplot2 (v3.4.1), dplyr (v1.1.0), tidyr (v1.3.0), gridExtra (v2.3), tidyverse (1.3.2), gtable (v0.3.2), scales (v1.2.1), lubridate (v1.9.2), survminer (0.4.9), survcomp (1.40.0), RColorBrewer (v1.1.3), GGgally (v2.1.2), ggforce (v0.4.1), TCellExTRECT (v1.0.1), MatchIt (v4.5.0) and dNdScv (v0.0.1.0) packages. P value adjustments were made using either the Holm–Bonferroni method or the false discovery rate (FDR)/Benjamini–Hochberg method, with the FDR method being used for exploratory analysis and those involving many tests.
TRACERx 100
The TRACERx study (Clinicaltrials.gov registration: NCT01888601) is sponsored by University College London (UCL/12/0279) and has been approved by an independent Research Ethics Committee (13/LO/1546). All TRACERx samples used in this sample have been previously described13, and obtaining informed consent from each patient was a mandatory requirement for participation in the TRACERx study. Both WES (aligned to the hg19 sequence) and RNA-seq samples were obtained from the TRACERx study for the first 100 patients; the method for processing these samples is as previously described13,48. For the WES samples, exome capture was performed using a custom version of the Agilent Human All Exome V5 kit according to the manufacturer’s instructions.
TCR-seq TRACERx100 data used in this analysis have been previously published49; FASTQ data are deposited at the Sequence Read Archive (SRA) under accession code BioProject (PRJNA544699).
TRACERx100 DNA samples were sequenced and aligned to GRCh38 by Genomics England using the same Illumina sequencing pipeline as used in the 100KGP to produce WGS samples to a mean depth of 175× (median 223×). WGS coverage values from the TCRA, TCRB, TCRG and IGH loci for these samples were then extracted for use for ImmuneLENS using SAMtools (v.1.3.1) depth. No other WGS-derived data besides these coverage values was used from the TRACERx cohort for this analysis.
100KGP WGS cohort
The 100KGP was ethically approved by the East of England—Cambridge South Research Ethics Committee (Research Ethics Committee reference 14/EE/1112, Integrated Research Application System ID 166046). Participants were recruited from 13 National Health Service (NHS) Genomic Medicine Centres, and all provided written informed consent.
All WGS samples within the 100KGP cohort were sequenced by Illumina and carried out on behalf of Genomics England. The Illumina pipeline for all samples used in this analysis performed alignment with the Issac aligner to the GRCh38 reference. Full details can be found at https://re-docs.genomicsengland.co.uk/genomic_data. Tumor samples were sequenced to a median depth of 97.5×, while germline blood samples were sequenced to a median depth of 32.7× in the pan-cancer cohort and 39.7× in the rare disease cohort.
T cells and B cells were calculated for the entire 100KGP cohort (lung—data release v8 (28 November 2019), remaining pan-cancer data release v12 (06 May 2021) and rare disease v12 (07 May 2021)). In total, scores were calculated for 92,905 WGS BAM files.
Of these, 31,675 BAM files were part of the 100KGP cancer cohort, representing 16,294 cancer BAM files and 15,381 germline BAM files. Some participants had multiple tumor samples collected for WGS; due to the lack of annotation of the reason for multiple samples (for example, technical resequencing, representative of metastasis, multiple region sequenced or occurrence of a second primary tumor at a later time point), these were removed from the pan-cancer cohort, leading to a final cohort of 14,501 tumor WGS samples. Of the 14,501 tumor WGS samples of our cohort, 13,868 have a matched blood WGS sample.
For the rare disease cohort, scores for 61,230 BAMs in total were calculated. Limiting to samples taken from blood samples leads to 59,903 BAMs representing 29,238 samples taken from probands with a rare disease and 30,665 relatives of these probands. This cohort of 30,665 blood samples from relatives was taken as our healthy cohort to compare with the 13,868 blood samples from patients with cancer. Additionally, from this healthy cohort, propensity-matched cohorts for each cancer histology were created using the R package matchit, controlling for both age and sex.
T cell and B cell fractions were calculated with the WGS version of ImmuneLENS; adjustments for tumor purity were made using estimates from Genomics England and local copy number using CANVAS (v.1.3.1) calls produced by Genomics England for nearby genes to the V(D)J loci (TCRA—OR10G3; TCRB—PRSS58; TCRG—STARD3NL; IGH—TMEM121).
Cancer histology in terms of disease and disease subtype was curated by Genomics England and is as described in the cancer_analysis_table available to researchers within the Genomics England research environment. To be consistent with other pan-cancer analyses, particularly TCGA, we used the histology groups designed by Genomics England to align as closely as possible to the TCGA (https://re-docs.genomicsengland.co.uk/cancer_analysis_histology/). We, however, kept the Childhood Cancers group from Genomics England’s own annotation of cancer disease type due to the effect of age on our analysis. We also split up the breast invasive carcinoma group by hormone receptor status where available, and for the hematologically derived cancers, we split them up by cell of origin to distinguish B cell- and T cell-derived cancers from those from myeloid cells. All cancer types with occurrences less than 100 cases in the total cohort were assigned to the other cancer type groups, for both ease of analysis and to avoid the risk of any personally identifying features.
TCGA pan-cancer data
T cell ExTRECT was applied to the pan-cancer TCGA WES dataset. For different TCGA cohorts, different exome capture kits were used, and exon quality control was undertaken to ensure consistent results across the entire TCGA cohort. In brief, for each capture kit, the median GC-corrected read depth ratio was calculated for each exon using the exonsTcellExTRECT function across all samples. Exons with low coverage (median read depth ratio < −0.5) were filtered from the capture kit BED file.
TCGA sample ancestry calls are the consensus of five genetic ancestry calling approaches described in ref. 50.
1000 Genome cohort
In total, 2,544 samples with matched high- and low-coverage CRAM files, along with their indexed CRAI files, were downloaded directly from the 1000 Genomes cohort server (ftp://ftp.1000genomes.ebi.ac.uk) using wget. The median depth of the high-coverage samples was 34×, and the median depth for the low-coverage samples was 1.25×. ImmuneLENS with SAMtools (v.1.3.1) was then used on these CRAM files to extract the coverage and then calculate T cell and B cell fractions. Processed RNA-seq data from the Geuvadis project for 465 lymphoblastoid cell lines from the 1000 Genomes were downloaded from https://www.ebi.ac.uk/gxa/experiments/E-GEUV-1/Downloads with RNA-seq analysis performed using R packages limma and edgeR.
PCAWG
Our analysis was restricted to the TCGA portion of the PCAWG that contained 539 WGS tumor-normal pairs from BAM files that had been realigned to hg38 at MD Anderson. Germline normal samples had a median depth = 37.3× and tumor samples median depth = 51.2×. ImmuneLENS/SAMtools (v.1.3.1) was used to extract coverage files for the IGH and TCRA loci, which were then used in the calculation of all T cell and B cell fractions using the ImmuneLENS R package.
Low-pass TCGA data
In total, 317 low-pass TCGA BAM files with a median depth of 4.95× that were from samples with corresponding PCAWG high-coverage WGS were downloaded using the TCGA GDC client; coverage values for each sample were downloaded from the GDC client API.
scRNA cohort and analysis
Processed scRNA data with associated metadata from a lung cancer dataset described in ref. 51 were used. Annotation of B cell subtypes was used, and class switching was determined from the expression of IGH class switch segments with cells with unclear annotation removed from the analysis.
Nested downsampling of WGS files
Nested downsampling was performed on WGS BAM files using SAMtools view (v.1.3.1) recursively with the following options:
samtools view -b -h –subsample FRAC – -subsample-seed SEED BAM CHR_LOC > OUT_BAM
The depth of the original BAM files was calculated with mosdepth (v.0.3.2) and then downsampled to 60×. After each downsampling, each output BAM was indexed using Picard (v.2.20.3) BuildBamIndex before being downsampled again with SAMtools view to create a set of nested downsampled BAMs with depths of 60, 50, 40, 30, 20, 10, 5, 2, 1, 0.5 and 0.1×. The values for FRAC were calculated to obtain these depths based on the depth of the original BAM file as calculated with mosdepth. SEED values were changed in each nested down sample to avoid using the same seed repeatedly.
The above-given procedure was done to generate downsampled BAMs for all of the TRACERx WGS samples for the TCRA (chr14: 21621904–22752132), TCRB (chr7: 142299011–142813287), TCRG (chr7: 38240024–38368055) and IGH (chr14: 105566277–106879844) loci. These downsampled BAMs were then used as input for the WGS version of ImmuneLENS to calculate the T cell and B cell fractions.
Differential gene expression analysis and gene set enrichment
We performed differential gene expression on TRACERx100 patients with RNA-seq data, separating the cohort into high or low groups based on either IGH B cell fraction or class-switching B cell fraction scores for IGHG1, IGHA1 B cell fraction or nonclass-switched IgM/IgD B cell fraction. First, using R 4.0.0, the edgeR package (v.3.32.1) was used for the sample-specific trimmed mean of the M values normalization; any genes with low expression were then filtered out using the standard edgeR filtering method before using the limma–voom method from the limma R package (v.3.46.0) to calculate the voom fit and obtain P values for the gene-expression differences. The comparison controlled for patient and histology as blocking factors, and P values were FDR-corrected for multiple testing. Results were then visualized with the R EnhancedVolcano package (v.1.8.0). Gene set enrichment analysis was then performed using the fgsea R package, which uses (v.1.24.0) the MSigDB C8 genesets of cell type signatures (https://www.gsea-msigdb.org/gsea/msigdb/human/genesets.jsp?collection=C8). An adaptive multi-level split Monte Carlo scheme for P value estimation was used and full results are given in Supplementary Data.
Calculation of TCR/BCR diversity metrics
T cell diversity metrics from V or J segment usage were predicted by the ImmuneLENS model. For the Shannon diversity, we used the formula:
where ({p}_{i}) represents the proportion of an individual V or J segment predicted from the model.
To compare between two samples with different predicted segment usage, we used the Jensen–Shannon divergence metric defined as follows:
(D({P|Q}),={sum }_{i}{P}_{i},log (frac{{P}_{i}}{{Q}_{i}})), where ({P}_{i}) and ({Q}_{i}) represent the proportion of segment i used in sample A or B, respectively.
The Jensen–Shannon divergence (JSD) is then defined as follows:
MiXCR22 was used to call TCR clonotypes from TRACERx 100 RNA-seq data directly. From these calls, the Shannon entropy was then calculated using the proportions of the TCR clonotypes found in each sample.
TRUST4 (ref. 52) was also used to call BCR sequences and therefore infer class-switching proportions.
TRAV segment usage analysis
TRAV segment predictions from ImmuneLENS were generated for the entire 100KGP cohort. For analysis of differing TRAV segment usage, we restricted to samples with >0.05 total TCRA T cell fraction. To test for TRAV segment usage changes between different populations, we used propensity matching to control for TCRA T cell fraction and to ensure that the distribution of T cell fraction was the same between comparison populations and hence there would be no bias with higher T cell fraction cohorts associated with more diversity due to our increased power to detect TRAV segment usage. Once the comparison cohorts were created, we defined a TRAV segment as being selected within the ImmuneLENS model if it had a fraction >0.001 of T cells predicted to use the TRAV segment. For every segment, we then calculated the percentage of samples within the cohort that selected that segment >0.001 fraction. Differences in segment usage between cohorts were then assessed using a χ2 test, and then P values were adjusted for multiple hypothesis testing.
100KGP genetic ancestry inference
Genetic ancestry inference was provided by Genomics England for the entire 100KGP cohort using ethnicities from the 1000 Genomes Project phase 3 as truth by first generating principal components and then projecting the 100KGP project onto them to identify the broad genetic ancestry super-category of each participant. Full details can be found at https://re-docs.genomicsengland.co.uk/ancestry_inference/.
100KGP date-matched blood count data
Blood count data were only available for a subset of the rare disease cohort within the 100KGP. We selected blood count data that were time-matched for the exact date of genomic sample collection resulting in data from 441 participants for which we had date-matched blood count and calculated T cell or B cell fractions. From this data, we further subsetted for participants with matched albumin count (n = 361), lymphocyte count (n = 222), neutrophil count (n = 84) and both neutrophil and lymphocyte count data (n = 84).
100KGP treatment data
Treatment data were extracted from 100KGP using the clinical data available in the Genomics England research environment from the ‘cancer_systemic_anti_cancer_therapy’ version 13 table.
dNdScv analysis of selection in protein-coding genes
We used dNdScv31 to measure the expected number of nonsynonymous mutations for genes associated with cancer within the cancer gene census. We then adapted code from ref. 53, which used a Poisson model of observed nonsynonymous mutations using the neutral background expectation as calculated within dNdScv as an offset variable influenced by age or sex in normal bladder tissue. In our analysis, we also added tumor purity, tumor mutation burden and disease type as controlling variables. We added either infiltrating TCRA T cell fraction, IGH B cell fraction, total class-switched B cell fraction, total non-class-switched B cell fraction (IgM/IgD), IgA or IgG B cell fraction into the Poisson model and identified genes for which these variables were significant (model: observed mutations ~ offset(log(expected mutations)) + age + tumor mutation burden + sex + disease type + immune fraction). For the pan-cancer analysis, we selected significant genes after adjusting for multiple hypothesis testing, for the disease-type-specific models, we only tested genes that had ≥10 tumors containing nonsynonymous mutations in that disease type and did not include sex in the model for cancer types predominant in one sex.
Analysis of known SNPs associated with leukocyte traits using PLINK
In total, 1,962 SNPs known to be associated with leukocyte traits (either basophil, eosinophil, lymphocyte, monocyte, neutrophil counts or white blood count) were downloaded from the data released by ref. 27. Of these, only 1,635 SNPs were listed within the VCF files provided within the 100KGP above the 0.001 mean allele frequency threshold. PLINK was used to test for associations between these SNPs and TCRA T cell fraction, IGH B cell fraction, IgM/IgD B cell fraction, IgG B cell fraction, IgA B cell fraction or the T/B cell ratio. All T cell and B cell fractions were first transformed using the inverse normal transformation to ensure normality. Association tests were run separately in the different genetic ancestry groups (as defined by the 1000 Genomes Project). Our analysis focused on participants with genetically inferred European ancestry, as this was the largest ancestry group in both the healthy and pan-cancer cohorts and those with genetically inferred African ancestry, as this group showed the most significant difference in circulating T cell fraction compared to the European ancestry group. For the healthy and pan-cancer cohorts age, sex and the first ten genetic ancestry principal components (PCs) were used as covariates. PLINK (v1.9) was run separately on each cancer subtype using these covariates. PLINK was run with the following steps: (1) LD pruning of the tested SNPs using the option –indep-pairwise 500 5 0.5 to test 500 SNPs at a time, moving the window by five SNPs at each step and using an R2 threshold of 0.5 to remove any high LD SNPs. (2) A cutoff on genotype frequencies using –geno 0.2 –maf 0.01 to remove any SNPs with a missing genotype rate >20% and a minor allele frequency >1%. (3) A Hardy–Weinberg filter using –hwe 0.000001 to specify the P value threshold. (4) A test for association of the phenotype using linear regression and the –linear option, as well as calculation of genotype frequencies using –freq. For the pan-cancer analysis, the output of each cohort from PLINK was then combined in a common effect meta-analysis using the metagen function from the R package meta, with the input being the treatment effect and its s.e. from each of the separate cancer histology runs of PLINK.
Survival analysis
Survival data were collated on the Genomics England research environment using available data for date of cancer diagnosis, death records from the Office of National Statistics and the latest follow-up times from the most recent records in the hospital episode statistics (release v16). The data then underwent additional quality control to exclude any patients with any conflicting data, such as follow-up times greater than 10 years resulting from multiple dates of diagnosis values from previous incidences of cancer. In total, 13,348 participants with both survival data and ImmuneLENS fractions in blood and 13,342 participants with both survival data and ImmuneLENS fractions in tumor tissue were available for analysis.
A meta-analysis using a random effects model was applied to the output of the HRs of the disease-specific CoxPH models using the R function metagen from the package meta (v.6.5-0). Thus, the I2 values were calculated, and their significance was tested using Cochran’s Q test.
Figure generation
Biorender.com aided in the generation of Fig. 1a, Extended Data Fig. 4a and Supplementary Fig. 3a.
Reporting summary
Further information on research design is available in the Nature Portfolio Reporting Summary linked to this article.
Responses