Large-scale genome-wide association analyses identify novel genetic loci and mechanisms in hypertrophic cardiomyopathy
Main
HCM is a disease of the cardiac muscle characterized by thickening of the left ventricular (LV) wall with or without obstruction of flow (obstructive, oHCM; nonobstructive, nHCM). HCM is associated with an increased risk of arrhythmia, heart failure, stroke and sudden death. Previously viewed as a Mendelian disease with rare pathogenic variants in cardiac sarcomere genes identified in ~35% of cases (HCMSARC+), HCM is now known to have complex and diverse genetic architectures1. Previous studies have established that common genetic variants underlie a large portion of disease heritability in HCM not caused by rare pathogenic variants (sarcomere-negative (HCMSARC−)) and partly explain the variable expressivity in HCM patients carrying pathogenic variants (sarcomere-positive (HCMSARC+)), but such studies had limited power to identify a large number of significant loci2,3.
We report a meta-analysis of seven case–control HCM genome-wide association study (GWAS) datasets comprising a total of 5,900 HCM cases, 68,359 controls and 9,492,702 variants with a minor allele frequency (MAF) > 1% (Supplementary Table 1; see study flowchart in Fig. 1). We identified 34 loci significantly associated with HCM (at P < 5 × 10⁻⁸), of which 15 were novel (Table 1 and Supplementary Figs. 1 and 2a). Stratified analyses in HCMSARC+ (1,776 cases) and HCMSARC− (3,860 cases) identified a further five loci (Table 1, Supplementary Fig. 2b and Supplementary Table 2). Using conditional analysis4, we identified more independent associations with HCM, HCMSARC+, and HCMSARC− with a false discovery rate (FDR) < 1% (Supplementary Table 3). We estimated the heritability of HCM attributable to common genetic variation (h2SNP) in the all-comer analysis to be 0.17 ± 0.02 using linkage disequilibrium (LD) score regression (LDSC)5, and found higher estimates (0.25 ± 0.02) using genome-based restricted maximum likelihood (GREML)6, with higher h2SNP in HCMSARC− (0.29 ± 0.02) compared with HCMSARC+ (0.16 ± 0.04) (Supplementary Table 4).
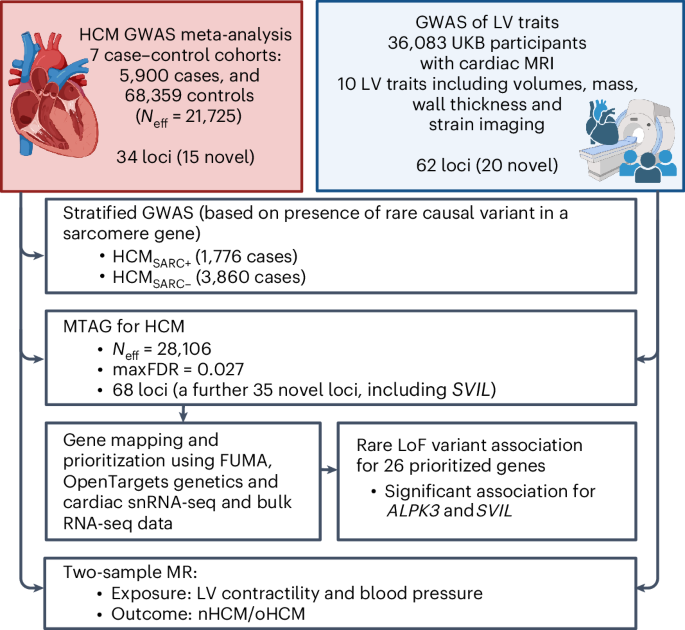
Flowchart of meta-analysis of seven case–control HCM GWAS datasets, GWAS of LV traits and downstream analyses. Created using BioRender.com.
To further maximize HCM locus discovery, we performed a multitrait analysis of GWAS (MTAG)7 (Fig. 2). We first completed a GWAS of ten cardiomyopathy-relevant LV traits in 36,083 participants of the UK Biobank (UKB), using machine learning assessment of cardiac magnetic resonance (CMR) imaging8 for LV volumes, wall thickness and myocardial strain (Supplementary Table 5 and Supplementary Figs. 3–12). We discovered 62 loci associated with LV traits (20 novel) (Supplementary Table 6). LDSC analyses9 demonstrated high genetic correlations (rg) between LV traits within three clusters (contractility, volume and mass) and with HCM (Fig. 2 and Supplementary Table 7). Leveraging such correlations, we performed an HCM MTAG by including the three LV traits most correlated with HCM (one trait from each cluster), namely global circumferential strain (contractility cluster; rg = −0.62), LV end-systolic volume (volume cluster; rg = −0.48) and the ratio of LV mass to end-diastolic volume (mass cluster; rg = 0.63). MTAG resulted in a substantial increase in mean χ2 equivalent to an increase in effective sample size (Neff) of the HCM GWAS of ~29% (from 21,725 to 28,106), with an estimated upper bound of the false discovery rate (maxFDR)7 of 0.027. Effect estimates derived from MTAG were strongly correlated with those from GWAS (Supplementary Fig. 13). MTAG resulted in a substantial step up in loci discovered, identifying a total of 68 loci associated with HCM at P < 5 × 10⁻⁸, including 48 that have not been published previously (13 novel loci also identified in the single-trait HCM GWAS, and 35 additional novel loci from MTAG) (Fig. 3, Supplementary Table 8 and Supplementary Fig. 14). Two of the 34 loci reaching genome-wide significance in the HCM GWAS were not significant in MTAG (loci mapped to TRDN/HEY2 and CHPF). The total number of loci identified in GWAS or MTAG is therefore 70 (50 novel). Although it was not possible to test for replication for the 35 novel MTAG loci, a previous study strongly supports the robustness of the HCM-LV traits MTAG approach, whereby all ten HCM loci uncovered using MTAG in this previous study were independently validated3, and all reach P < 5 × 10⁻⁸ in the present GWAS.
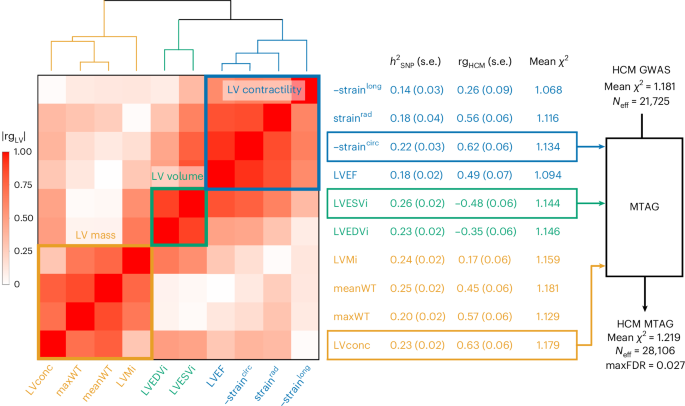
Pairwise genetic correlation between LV traits shown in heatmap as absolute values (|rgLV|) ranging from 0 (white) to 1 (red). LV traits are sorted into three clusters based on |rgLV| along the x and y axes using Euclidean distance and complete hierarchical clustering: LV contractility (blue), volume (bluish green) and mass (orange) (see dendrogram on top). The table in the middle shows the individual LV trait h2SNP and genetic correlation with HCM (rgHCM), with corresponding s.e. The trait with the strongest correlation (based on rgHCM) in each of the three clusters was carried forward for MTAG to empower locus discovery in HCM. MTAG resulted in an increase in Neff, based on number of cases and controls and increase in mean χ2 statistic from 21,725 to 28,106, with an estimated maxFDR of 0.027. Since straincirc and strainlong are negative values where increasingly negative values reflect increased contractility, we show −straincirc and −strainlong to facilitate interpretation of rgHCM sign. Full rgLV and rgHCM results are shown in Supplementary Table 7.
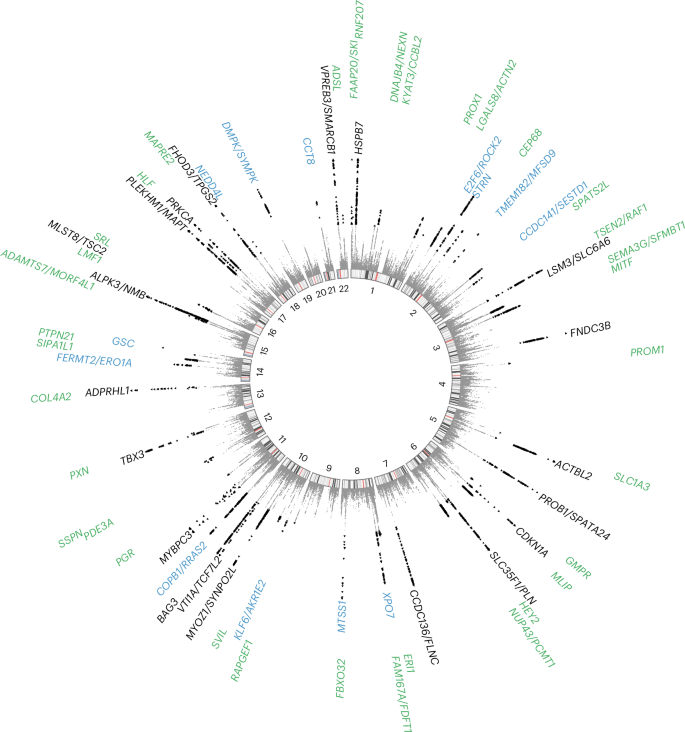
Previously published loci are identified in black (n = 20), novel loci discovered by single-trait all-comer GWAS meta-analysis are identified in blue (n = 13) and other novel loci from MTAG are identified in green (n = 35). Two other loci reaching GWAS significance threshold in the single-trait HCM GWAS meta-analysis but not reaching significance in MTAG are not shown (mapped to TRDN/HEY2 and CHPF; Table 1). P values are not corrected for multiple testing and correspond to the HCM MTAG including the fixed-effects meta-analysis of seven HCM case–control GWAS and three LV traits (Fig. 2). Significant variants with P < 5 × 10⁻⁸ are shown as black triangles. Results with P < 1 × 10⁻¹⁵ are assigned P = 1 × 10⁻¹⁵. Locus naming was performed primarily by OpenTargets gene prioritization considering FUMA and previous gene association with Mendelian HCM. See Supplementary Table 8 for loci details.
MAGMA10 gene set analysis identified several significant gene sets linked to muscle, contractility and sarcomeric function (Supplementary Table 9), and tissue expression analysis pointed to cardiac tissue (LV and atrial appendage (AA)) (Supplementary Table 10). Within cardiac tissue, we further explored the contribution of specific cell types in HCM by leveraging available single-nuclei RNA sequencing (snRNA-seq) data from donor human hearts11. Using sc-linker12, we identified significant enrichment of heritability in cardiomyocyte and adipocyte cell types (cardiomyocyte, FDR-adjusted P = 1.8 × 10⁻⁶; adipocyte, FDR-adjusted P = 3.0 × 10⁻³) and cell states (Supplementary Fig. 15).
Lead variants at GWAS and MTAG loci map to noncoding sequences of the genome, with only a few exceptions that are missense variants in BAG3, ADPRHL1, PROB1 and RNF207 (Table 1 and Supplementary Tables 8 and 11). Prioritization of potential causal genes in HCM MTAG loci was performed using OpenTargets variant-to-gene (V2G) mapping13 (Supplementary Table 12) and FUMA14 (Supplementary Table 13). Of all prioritized genes, 26 were selected based on concordance in both OpenTargets (top three genes per locus) and FUMA, as well as LV-specific expression in bulk RNA-seq data (genotype-tissue expression project (GTEx) v.8) and expression in cardiomyocytes using publicly available snRNA-seq data15 (Fig. 4a and Supplementary Tables 12 and 13). Of those 26 genes, 14 are in novel loci and include genes involved in cardiomyocyte energetics and metabolism (RNF207 (ref. 16), MLIP17), myocyte differentiation and transcriptional regulation (MITF18, PROX1 (ref. 19), TMEM182 (ref. 20)), myofibril assembly (SVIL21) and calcium handling and contractility (PDE3A22, SRL23). To identify further genes associated with HCM, we performed a transcriptome-wide association study (TWAS) using S-MultiXcan24 with the MTAG summary statistics and cardiac tissues (LV and AA) from GTEx v.8. TWAS identified 127 genes significantly associated with HCM at P < 3.7 × 10⁻⁶ (Supplementary Table 14), of which 50 were not mapped to MTAG loci using either FUMA or OpenTargets, including HHATL (P = 1 × 10⁻¹¹)—a gene of uncertain function prioritized based on dominant LV expression and whose depletion in zebrafish may lead to cardiac hypertrophy25. Finally, we used OpenTargets to explore association of the 70 lead single nucleotide polymorphisms (SNPs) (or any other SNP in linkage disequilibrium, r2 > 0.5) with published cardiovascular, metabolic or other traits (Supplementary Table 15). Of the 70 loci associated with HCM, 51 were previously associated at P < 5 × 10⁻⁸ with cardiovascular and/or cardiometabolic traits, including ECG measures, body mass, blood pressure, atrial fibrillation, left ventricular structure/function, atherosclerotic cardiovascular disease and lipids.
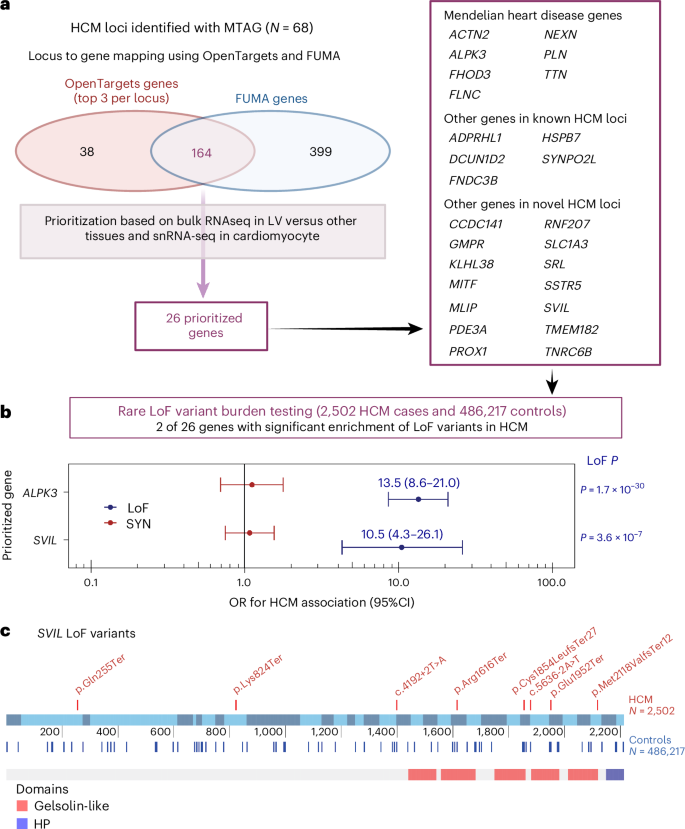
a, HCM locus-to-gene mapping and prioritization based on cardiac expression. Locus-to-gene mapping was done using the OpenTargets13 V2G pipeline (release of 12 October 2022) for all 68 lead variants at the HCM MTAG loci and using FUMA14 for the HCM MTAG summary statistics (see Methods for detailed parameters). Of 164 genes mapped using both FUMA and OpenTargets (top 3 genes per locus), 26 were prioritized because of either high specificity of LV expression using the bulk RNA-seq data of the GTEx project38 release v.8 and/or high expression in cardiomyocytes using snRNA-seq data15. See Methods and Supplementary Tables 12 and 13 for details. b, Rare (MAF < 10−4) LoF variant association analyses with HCM versus controls performed for all 26 genes using sequencing data in up to 2,502 unrelated HCM cases and 486,217 controls from four datasets followed by IVW meta-analysis. Association of rare synonymous (SYN) variants was also performed as a negative control. Results shown restricted to two genes (ALPK3 and SVIL) reaching the Bonferroni-corrected threshold of P < 0.0019 (0.05/26) in the IVW meta-analysis. Filled circles and error bars represent the OR and their 95% CI, respectively, from the meta-analysis for LoF (blue) and SYN (red). P values shown are not corrected for multiple testing. Full results appear in Supplementary Table 16. c, Schematic of the rare LoF SVIL variants in HCM cases (top) and controls (bottom) along the linear structure of SVIL, showing the Gelsolin-like and headpiece (HP) domains. The coordinates reflect the codon numbers, and the colored bars are the exons. Detailed variant annotation appears in Supplementary Table 19. Panel a was created using BioRender.com.
GWAS loci often colocalize with genes harboring disease-causing rare variants26. To identify novel HCM disease genes, we explored whether rare (MAF < 10−4) predicted loss-of-function (LoF) variants in the 26 prioritized genes from significant GWAS/MTAG loci are associated with HCM. We performed case–control burden testing using sequencing data from BioResource of Rare Diseases (BRRD), Genomics England (GEL), UKB and the Oxford Medical Genetics Laboratory (OMGL; only for SVIL), followed by a fixed-effects model IVW meta-analysis comprised of up to 2,502 unrelated HCM cases and 486,217 controls (Fig. 4b and Supplementary Table 16a). Rare LoF variants in ALPK3 and SVIL were significantly associated with HCM at the Bonferroni-corrected P < 0.0019 (0.05/26). While truncating variants in ALPK3 have previously been shown to cause HCM and are now included in most clinical testing panels26,27,28, SVIL represents a novel HCM gene with a comparable effect size for LoF variants (odds ratio (OR), 10.5,; 95% confidence intervals (CI), 4.3–26.1; P = 3.6 × 10⁻⁷). As exploratory analyses, we also performed exome-wide gene-based burden testing for LoF variants using two MAF filters (< 10−3 and <10−4) and report the summary statistics in the supplement (Supplementary Tables 17 and 18 and Supplementary Figs. 16–18). Effect estimates for rare SVIL LoF variants do not show significant heterogeneity across the four datasets (Supplementary Fig. 19), and the associations remain significant when excluding each dataset one at a time (Supplementary Table 16b). Furthermore, synonymous variant burden testing was performed as a negative control and did not show significant associations (Fig. 4b and Supplementary Table 16c). SVIL LoF variants found in eight unrelated cases are listed in Supplementary Table 19 and Fig. 4c. None of the eight unrelated HCM cases that carry a SVIL LoF variant carries any other pathogenic or likely pathogenic variant. Family screening provided limited evidence of cosegregation. In one family, variant SVIL:p.(Gln255Ter) was carried by two cousins with HCM and, in another family, variant SVIL:p.(Arg1616Ter) was carried by two siblings with HCM. SVIL encodes supervillin, a large, multidomain actin and myosin binding protein with several muscle and nonmuscle isoforms, of which the muscle isoform has known roles in myofibril assembly and Z-disk attachment21. SVIL is highly expressed in cardiac, skeletal and smooth muscle myocytes in the GTEx v.9 snRNA-seq dataset29, and SVIL morpholino knockdown in zebrafish produces cardiac abnormalities30. In humans, LoF SVIL variants have been associated with smaller descending aortic diameter31, and homozygous LoF SVIL variants have been shown to cause a skeletal myopathy with mild cardiac features (left ventricular hypertrophy)32. Of interest, common variants in the SVIL locus are also associated with dilated cardiomyopathy (DCM)3 and, using a Bayesian pairwise analysis approach (GWAS-PW33) including the present HCM GWAS meta-analysis and a published DCM GWAS34, we show that DCM and HCM share the same causal SNP but with the expected opposite directions of effect (Supplementary Table 20). Taken together, these data support SVIL as the likely causal gene in the HCM GWAS locus and identify SVIL as a novel disease gene for HCM, in which rare LoF alleles have an effect size similar to that of minor HCM disease genes tested in clinical practice26,27,28.
Rare sarcomeric gene variants that cause HCM have been shown to result in increased contractility, and cardiac myosin inhibitors attenuate the development of sarcomeric HCM in animal models35. Previous data from GWAS and Mendelian randomization (MR) also support a causal association of increased LV contractility with HCM, extending beyond rare sarcomeric variants3. Pharmacologic modulation of LV contractility using myosin inhibitors has been approved recently in the treatment of HCM associated with LV obstruction (oHCM)36,37, but remains of uncertain utility in nHCM where no specific therapy currently exists. To further dissect the specific implication of LV contractility in nHCM and oHCM, we performed two-sample MR, testing the causal association of LV contractility as exposure, with HCM, nHCM and oHCM as outcomes. GWAS of nHCM (2,491 cases) and oHCM (964 cases) were performed (Supplementary Table 2), showing substantially shared genetic basis between nHCM and oHCM (rg = 0.87; s.e. 0.13; P = 4 × 10⁻¹¹) (Supplementary Table 8). LV contractility in the general population was assessed with CMR using a volumetric method (LV ejection fraction (LVEF)), and three-dimensional tissue deformation methods (that is, global LV strain in the longitudinal (strainlong), circumferential (straincirc) and radial (strainrad) directions). Results from the primary MR inverse variance weighted (IVW) analysis are shown in Fig. 5a, and sensitivity analyses results appear in Supplementary Table 21 and Supplementary Figs. 20 and 21. Although significant heterogeneity in the exposure–outcome effects and potential violations of MR assumptions are possible limitations, MR findings support a causal association between increased LV contractility and increased risk for both nHCM and oHCM, with a substantial risk increase of 12-fold and 29-fold per s.d. increase in the absolute value of straincirc, respectively (Fig. 5a). These data suggest that increased contractility is involved in both oHCM and nHCM development, and thus myosin inhibitors currently approved for symptom control in oHCM may also be of clinical benefit in nHCM. Finally, we also performed MR analyses exploring whether increased systolic (SBP) and diastolic (DBP) blood pressure, and pulse pressure (PP = SBP − DBP) are causally associated with nHCM and oHCM. As for LV contractility, the causal association of SBP and DBP with HCM2 extended to both oHCM and nHCM subgroups (Fig. 5b, Supplementary Table 21 and Supplementary Fig. 22), suggesting that lowering blood pressure may be a therapeutic target to mitigate disease progression for both nHCM and oHCM.
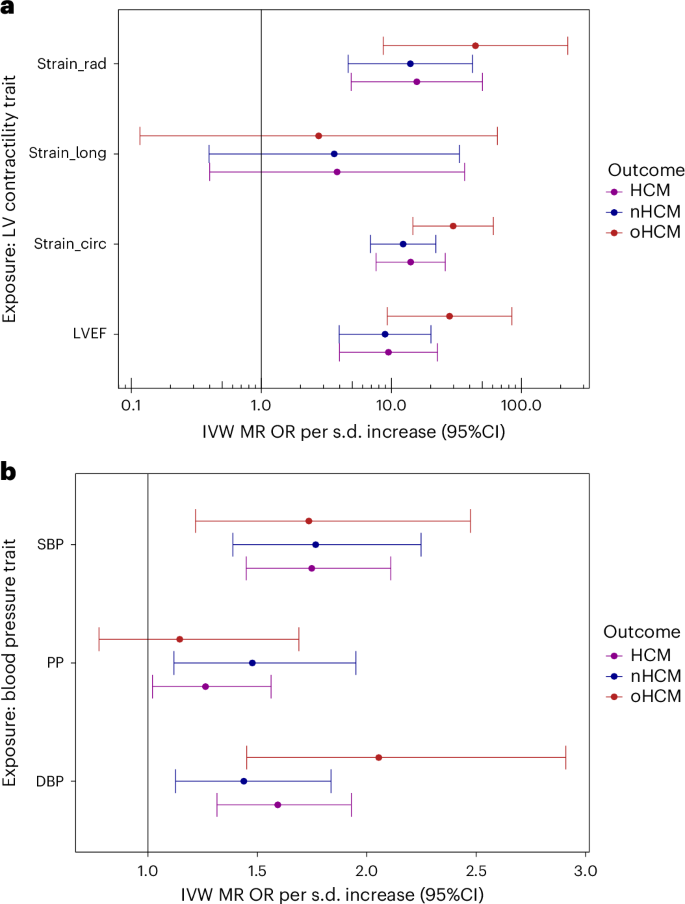
In both panels, filled circles represent the OR per s.d. increase inferred from the IVW two-sample MR. Error bars represent the 95% CI of the OR. a, MR suggests causal association of LV contractility (exposure) with HCM, oHCM and nHCM (outcomes), where increased contractility increases disease risk. Genetic instruments for LV contractility were selected from the present GWAS of LVEF and LV strain in the radial (strain_rad), longitudinal (strain_long) and circumferential (strain_circ) directions in 36,083 participants of the UKB without cardiomyopathy and with available CMR. To facilitate interpretation of effect directions, OR for strain_circ and strain_long reflect those of increased contractility (more negative strain_circ and strain_long values). The outcome HCM GWAS included 5,900 HCM cases versus 68,359 controls. Of those, 964 cases and 27,163 controls were included in the oHCM GWAS and 2,491 cases and 27,109 were included in the nHCM GWAS. Note a logarithmic scale in the x axis. b, MR suggests causal associations of SBP and DBP with HCM, nHCM and oHCM. Genetic instruments for SBP, DBP and PP (SBP − DBP) were selected from a published GWAS including up to 801,644 people39. See Supplementary Table 21 for full MR results.
The large number of new susceptibility loci arising from this work support new inferences regarding disease mechanisms in HCM. With the identification of the role of SVIL, we have uncovered further evidence that a subset of genes underlies both monogenic and polygenic forms of the condition. However, this shared genetic architecture does not extend to the core sarcomere genes that cause monogenic HCM; instead, the common variant loci implicate processes outside the myofilament, thereby widening our biological understanding. The shared mechanistic pathways between oHCM and nHCM suggest that the new class of myosin inhibitors may be effective in both settings, whereas the further exploration of newly implicated loci and pathways may in the future yield new treatment targets.
Methods
Ethics
The study was approved by the following ethics review boards: Research Ethics and New Technology Development Committee of the Montreal Heart Institute (2011/208), Medical Ethical Committee of Amsterdam University Medical Center (UMC; W20_226 no. 20.260), South Central–Hampshire B Research Ethics Committee (09/H0504/104), Hammersmith and Queen Charlotte’s Research Ethics Committee (09/H0707/69) and the National Research Ethics Service (11/NW/0382, 13/EE/0325, 14/EE/1112, 14/SC/0190, 19/SC/0257, 21/NW/0157). The study of HCM patients from Amsterdam UMC was performed under a waiver—approved by the Medical Ethical Committee of Amsterdam UMC—allowing genotyping and genome-wide association study of people affected by cardiovascular disease. All other study participants provided informed consent.
GWAS of HCM
The HCM GWAS included cases and controls from seven strata: the Hypertrophic Cardiomyopathy Registry (HCMR), a Canadian HCM cohort, a Netherlands HCM cohort, the Genomics England 100,000 Genome Project (GEL), the Royal Brompton HCM cohort, an Italian HCM cohort and the BioResource for Rare Disease (BRRD) project. Quality control (QC) and association analyses were performed per strata, followed by a meta-analysis. The seven strata are described in the Supplementary Note and in Supplementary Table 1. Cases consisted of unrelated patients diagnosed with HCM in presence of unexplained LV hypertrophy defined as a LV wall thickness (LVWT) > 15 mm, or >13 mm and either presence of family history of HCM or a pathogenic or likely pathogenic genetic variant causing HCM. HCM cases underwent gene panel sequencing as per clinical indications. Variants identified within eight core sarcomere genes (MYBPC3, MYH7, TNNI3, TNNT2, MYL2, MYL3, ACTC1 and TPM1) were assessed centrally at the Oxford laboratory using the American College of Medical Genetics and Genomics (ACMG) guidelines40. HCM cases were dichotomized into sarcomere-positive and sarcomere-negative groups using a classification framework previously reported in Neubauer et al.41. In addition to the primary all-comer GWAS analyses including all cases with HCM (total of 5,900 cases and 68,359 controls), analyses stratified for sarcomere status in cases and randomly allocated controls were performed, including a total of 1,776 cases versus 29,414 controls in the HCMSARC+ analysis and 3,860 cases versus 38,942 controls in the HCMSARC− analysis.
Meta-analyses for the all-comer HCM GWAS was performed on betas and standard errors using GWAMA42. We kept variants where meta-analysis came from two or more studies and also had a sample size >5,000. Genomic inflation was estimated from the median χ2 distribution and using HapMap3 European ancestry LD scores using LD Score Regression5. All variants were mapped to Genome Reference Consortium Human Build 37 (GRCh37) extrapolated using the 1000 Genome phase 3 genetic maps. A genome-wide significant locus was assigned where two variants had a meta-analysis P < 5 × 10⁻⁸ and were 0.5 cM distance apart. A similar approach was implemented for the HCMSARC+ and HCMSARC− stratified analyses, which comprised five and seven strata, respectively (the GEL and BRRD strata did not include enough HCMSARC+ cases). Variants were retained where meta-analysis came from two or more studies and had sample size >5,000 for HCMSARC− and >2,500 for HCMSARC+ cases. The final dataset included 9,492,702 (all-comer), 7,614,734 (HCMSARC+) and 9,226,079 (HCMSARC−) variants after filtering. The results of the all-comer HCM GWAS meta-analysis and stratified analyses are presented in Table 1, Supplementary Figs. 1 and 2 and Supplementary Table 2.
A FDR 1% P value cut-off was derived from the all-comer, HCMSARC+ and HCMSARC− summary statistics using Simes method (Stata v.10.1), and the corresponding P values were 8.5 × 10⁻⁶, 1.6 × 10⁻⁶ and 7.8 × 10⁻⁶, respectively. Using the 1% FDR P-value thresholds, we then performed a stepwise model selection to identify 1% FDR independently associated variants using GCTA4. The analysis was performed chromosome wise using default window of 10 Mb, 0.9 collinearity and UKB reference panel containing 60,000 unrelated European ancestry participants. The results of this conditional analysis are presented in Supplementary Table 3.
HCM heritability attributable to common variants
We estimated the heritability of HCM attributable to common genetic variation (h2SNP) in the all-comer HCM, as well as HCMSARC+ and HCMSARC− using LDSC5 and GREML6. For LDSC, HapMap3 SNPs were selected from the summary statistics corresponding to HCM, HCMSARC+ and HCMSARC− meta-analyses. The h2SNP was computed on the liability scale assuming a disease prevalence of 0.002 (ref. 43). Since LDSC tends to underestimate h2SNP, we also estimated h2SNP using GREML, as previously performed2,3. We first computed h2SNP for HCM, HCMSARC+ and HCMSARC− using GREML for each of the largest three strata (HCMR, the Canadian HCM cohort and the Netherlands HCM cohort), followed by fixed-effects and random-effects meta-analyses combining all three strata. To exclude the contribution of rare founder HCM causing variants, we excluded the MYBPC3 locus for the Canadian and Netherlands strata and the TNNT2 locus for the Canadian stratum3. The results of h2SNP analyses are presented in Supplementary Table 4.
GWAS of CMR imaging-derived LV traits
UKB study population
The UKB is an open-access population cohort resource that has recruited half a million participants in its initial recruitment phase, from 2006 to 2010. At the time of analysis, CMR imaging data were available from 39,559 participants in the imaging substudy. The UKB CMR acquisition protocol has been described previously44. In brief, images were acquired according to a basic cardiac imaging protocol using clinical 1.5 T wide bore scanners (MAGNETOM Aera, Syngo Platform VD13A, Siemens Healthcare) in three separate imaging centers. Extensive clinical and questionnaire data and genotypes are available for these participants. Clinical data were obtained at the time of the imaging visit. These included sex (31), age (21003), weight (21002), height (50), SBP (4080), DBP (4079), self-reported noncancer illness code (20002) and ICD-10 codes (41270). The mean age at the time of CMR was 63 ± 8 years (range 45–80) and 46% of participants were male. Cohort anthropometrics, demographics and comorbidities are reported in Supplementary Table 5. Exclusion criteria for the UKB imaging substudy included childhood disease, pregnancy and contraindications to magnetic resonance imaging (MRI) scanning. For the current analysis, we also excluded, by ICD-10 code and/or self-reported diagnoses, anyone with heart failure, cardiomyopathy, a previous myocardial infarction or structural heart disease. After imaging QC and exclusions for comorbidities or genotype QC, we had a maximum cohort size of 36,083 people. The UKB received National Research Ethics Approval (REC reference no. 11/NW/0382). The present study was conducted under terms of UKB access approval no. 18545.
LV trait phenotyping
Description of CMR image analysis is detailed in the Supplementary Note and in ref. 3. We included ten LV phenotypes for GWAS analyses: end-diastolic volume (LVEDV), end-systolic volume (LVESV), LV ejection fraction (LVEF), mass (LVM), concentricity index (LV concentricity index (LVconc) = LVM/LVEDV), mean wall thickness (meanWT) and maximum wall thickness (maxWT) as well as global peak strain in radial (strainrad), longitudinal (strainlong) and circumferential (straincirc) directions. The means and s.d. values of all ten LV phenotypes, overall and stratified by sex, are shown in Supplementary Table 5.
LV trait GWAS
A description of genotyping, imputation and QC appears in the Supplementary Note. The GWAS model for LVEF, LVconc, meanWT, maxWT, strainrad, strainlong and straincirc included age, sex, mean arterial pressure (MAP), body surface area (BSA, derived from the Mosteller formula) and the first eight genotypic principal components as covariates. LVEDV, LVESV and LVM were indexed to BSA for the analysis, as commonly performed in clinical practice. For indexed values (LV end-diastolic volume indexed for BSA (LVEDVi), LV end-systolic volume indexed for BSA (LVESVi) and LV mass indexed for BSA (LVMi), the GWAS model did not include BSA as a covariate, but all other covariates were the same as for nonindexed phenotypes. BOLT-LMM (v.2.3.2)45 was used to construct mixed models for association with around 9.5 million directly genotyped and imputed SNPs. A high-quality set of directly genotyped model SNPs was selected to account for random effects in the genetic association analyses. These were selected by MAF (>0.001), and LD-pruned (r2 < 0.8) to create an optimum SNP set size of around 500,000. The model was then applied to the >9.8 million imputed SNPs passing QC and filtering. Results of the LV traits GWAS are shown in Supplementary Table 6 and Supplementary Figs. 3–12.
Locus definition and annotation
Genomic loci associated with all LV traits were annotated jointly. Specifically, summary statistics were combined with a P value corresponding to the minimal P value (minP) across all ten summary statistics. The minP summary statistics was then used to define loci using FUMA v.1.4.2 (ref. 14) using a maximum lead SNP P value of 5 × 10⁻⁸, maximum GWAS P value of 0.05 and r2 threshold for independent significant SNPs of 0.05 (using the European 1000 Genomes Project dataset) and merging LD blocks within 250 kb. Loci were then mapped to genes using positional mapping (<10 kb), expression quantitative trait loci mapping using GTEx v.8 restricted to atrial appendage, left ventricle and skeletal muscle tissues, and chromatin interaction mapping using left and right ventricles. Genes mapped using FUMA were further prioritized by querying the Clinical Genomes Resource (ClinGen)46 for genes linked to Mendelian heart disease with moderate, strong or definitive evidence, and using a recent review of overlapping GWAS and Mendelian cardiomyopathy genes26. In addition to FUMA locus-to-gene mapping, we also report closest gene and top gene mapped using OpenTargets13. Annotated LV trait loci are shown in Supplementary Table 6.
Genetic correlations between HCM and LV traits
Pairwise genetic correlations for HCM and the ten LV traits were assessed using LDSC v.1.0.1 (ref. 9). The analysis was restricted to well-imputed nonambiguous HapMap3 SNPs, excluding SNPs with MAF < 0.01 and those with low sample size, using default parameters. We then assessed genetic correlations for each of the 55 pairs (HCM and ten LV traits) using precomputed LD scores from the European 1000 Genomes Project dataset. We did not constrain the single-trait and cross-trait LD score regression intercepts. The results of the genetic correlation analyses are shown in Fig. 2 and Supplementary Table 7.
Multitrait analysis of GWAS
We performed multitrait analysis of GWAS summary statistics using MTAG (v.1.0.8)7 to increase power for discovery of genetic loci associated with HCM. MTAG jointly analyzes several sets of GWAS summary statistics of genetically correlated traits to enhance statistical power. Due to high computation needs to calculate the maxFDR with MTAG, we limited the number of GWAS summary statistics to four (HCM plus three LV traits). The three LV traits to include were selected as follows. First, we performed hierarchical clustering of the ten LV traits using the absolute value of the pairwise genetic correlations, Euclidean distance and the complete method, predefining the number of clusters to three. This resulted in clustering of LV traits into an LV contractility cluster (LVEF, strainrad, strainlong and straincirc), an LV volume cluster (LVEDVi, LVESVi) and an LV mass cluster (LVMi, LVconc, meanWT, maxWT) (Fig. 2). We then selected the trait with the highest genetic correlation with HCM from each cluster (straincirc, LVESVi and LVconc) to include in MTAG together with HCM. Only SNPs included in all meta-analyses (that is, HCM and LV traits) were used in MTAG. The coded/noncoded alleles were aligned for all four studies before MTAG, and multi-allelic SNPs were removed. All summary statistics refer to the positive strand of GRCh37 and, as such, ambiguous/palindromic SNPs (having alleles A/T or C/G) were not excluded. Regression coefficients (beta) and their s.e. were used as inputs for MTAG. The maxFDR was calculated as suggested by the MTAG developers7. MaxFDR calculates the type I error in the analyzed dataset for the worst-case scenario. We estimated the gain in statistical power by the increment in the Neff. The Neff for the HCM GWAS was calculated using the following formula7,47:
The Neff for the HCM MTAG was computed by means of the fold-increase in mean χ2, using the following formula7, implemented in MTAG, where the MTAG Neff corresponds to the approximate sample size needed to achieve the same mean χ2 value in a standard GWAS:
To explore whether HCM effects estimates derived from MTAG are accurate, we compared the regression coefficients derived from MTAG with those derived from GWAS. This was performed for all variants included in MTAG and GWAS, and for a subset of variants reaching nominal significance (P < 0.001) in either GWAS and/or MTAG (Supplementary Fig. 13). The results of HCM MTAG are presented in Fig. 3, Supplementary Table 8 and Supplementary Fig. 14.
Genome-wide annotation and gene set enrichment analyses
Genome-wide analyses following MTAG were performed using MAGMA v.1.08, as implemented in FUMA14, including gene set and tissue expression analyses. We used Gene Ontology gene sets from the Molecular Signatures Database (MsigDB, v.6.2) for the gene set analysis and GTEx v.8 for the tissue specificity analysis. The results of MAGMA analyses are shown in Supplementary Table 9 (gene set analyses) and Supplementary Table 10 (tissue specificity analyses).
Cardiac cell type heritability enrichment analysis
Gene programs derived from snRNA-seq were used to investigate heritability enrichment in cardiac cell types and states using the sc-linker framework12. This approach uses snRNA-seq data to generate gene programs that characterize individual cell types and states. These programs are then linked to genomic regions and the SNPs that regulate them by incorporating Roadmap Enhancer-Gene Linking48,49 and Activity-by-Contact models50,51. Finally, the disease informativeness of resulting SNP annotations was tested using stratified LDSC (S-LDSC)52 conditional on broad sets of annotations from the baseline-LD model53,54. Cell type and state-specific gene programs were generated from snRNA-seq data of ventricular tissue from 12 control participants, with cell type and state annotations made as part of a larger study of ~880,000 nuclei (samples from 61 DCM and 12 control participants11). Cell states that may not represent true biological states (for example, technical doublets) were excluded from analysis. Results of sc-linker cardiac cell type heritability enrichment analysis are shown in Supplementary Fig. 15.
Locus-to-gene annotation
A genome-wide significant HCM MTAG locus was assigned where two variants had a MTAG P < 5 × 10⁻⁸ and were 0.5 cM distance apart, as performed for the HCM GWAS. Prioritization of potential causal genes in HCM MTAG loci was performed using OpenTargets V2G mapping13 and FUMA14. The lead SNP at each independent locus was used as input for OpenTargets V2G using the release of 12 October 2022. Locus-to-gene mapping with FUMA v.1.3.7 was performed based on (1) position (within 100 kb), (2) expression quantitative trait loci associations in disease-relevant tissues (GTEx v.8 left ventricle, atrial appendage and skeletal muscle) and (3) chromatin interactions in cardiac tissue (left ventricle and right ventricle, FDR < 10−6).
We further annotated genes mapped using OpenTargets and/or FUMA with their implication in Mendelian cardiomyopathy. Specifically, we queried the Clinical Genome Resource (ClinGen28,46) for genes associated with any cardiomyopathy phenotype with a level of evidence of moderate, strong or definitive and included genes with robust recent data supporting an association with Mendelian cardiomyopathy26.
We also prioritized genes based on RNA expression data from bulk tissue RNA-seq data in the GTEx38 v.8 dataset accessible at the GTEx Portal and snRNA-seq data from Chaffin et al.15 accessible through the Broad Institute Single Cell Portal (https://singlecell.broadinstitute.org/single_cell). Using the GTEx v.8 data, we assessed specificity of LV expression by computing the ratio of median LV transcripts per million (TPM) to the median TPM in other tissues excluding atrial appendage and skeletal muscle and averaging tissue within types (for example, all arterial tissues, all brain tissues and so on). High and Mid LV expression specificity were empirically defined as >10-fold and >1.5-fold LV to other tissues median TPM ratios, respectively. Using snRNA-seq data from Chaffin et al.15, we report the expression in the cardiomyocyte_1 cell type using scaled mean expression (relative to each gene’s expression across all cell types) and percentage of cells expressing. High and Mid expression in cardiomyocytes were empirically defined as percentage expressing cells ≥80% and 40–80%, respectively. Prioritized genes were defined as genes mapped using both OpenTargets (top three genes) and FUMA, and had either (1) High LV-specific expression, (2) High cardiomyocyte expression or (3) both Mid LV-specific expression and Mid cardiomyocyte expression.
Lead variants in MTAG and GWAS loci were also annotated using the Ensembl Variant Effect Predictor (VEP) and lookup of lead variants and variants in LD (r2 > 0.5) in other GWAS was performed using OpenTargets genetics.
Gene mapping and variant annotation data are shown in Supplementary Table 11 (VEP annotation), Supplementary Table 12 (OpenTargets genes), Supplementary Table 13 (FUMA genes) and Supplementary Table 15 (lookup in other GWAS). Prioritized genes are illustrated in Fig. 4a.
Transcriptome-wide association study
We used MetaXcan to test the association between genetically predicted gene expression and HCM using summary results from MTAG analysis24,55. Biologically informed MASHR-based prediction models of gene expression for LV and AA tissue from GTEx v.8 (ref. 56) were analyzed individually with S-PrediXcan55, and then analyzed together using S-MultiXcan24. GWAS MTAG summary statistics were harmonized and imputed to match GTEx v.8 reference variants present in the prediction model. To account for multiple testing, TWAS significance was adjusted for the total number of genes present in S-MultiXcan analysis (13,558 genes, P = 3.7 × 10⁻⁶). TWAS results are shown in Supplementary Table 14.
Association of rare LoF variants in prioritized genes with HCM
We assessed the association of rare LoF variants in each of 26 prioritized genes (Fig. 4a) with HCM using burden analysis in three primary cohorts (BRRD, GEL and UKB) followed by fixed-effect meta-analysis. For BRRD, HCM cases were probands within the bio-resource project HCM. Controls were all remaining participants within the BRRD projects excluding those also recruited into the GEL and GEL2 projects (Genomics England pilot data). For GEL, HCM cases were probands referred into GEL with a primary clinical diagnosis of HCM. Controls were probands without any primary or secondary cardiovascular disease or myopathy. For UKB, HCM cases were identified from self-reported questionnaires at study recruitment, ICD-10 codes from clinical admission data and death registries, and CMR imaging for the subset of the cohort who underwent cardiac MRI testing (LV maximum wall thickness >15 mm). All participants with aortic stenosis were excluded from UKB cases. Sequencing data were available for only SVIL in the Oxford Medical Genetics Laboratory (OMGL), where cases were clinically diagnosed with HCM and referred for diagnostic panel testing. The control group for the OMGL analysis consisted of 5,000 white British ancestry and unrelated control participants selected randomly from the UKB; these participants had normal LV volume and function and no clinical diagnosis of any cardiomyopathy. The remaining UKB samples were used as controls for UKB burden analysis. Genetic variants were identified using next-generation sequencing (whole-genome sequencing for BRRD, GEL, panel/exome sequencing for OMGL cases and UKB) and annotated using VEP and LOFTEE plugin57. LoF variants were defined as those with the following VEP terms: stop lost, stop gained, splice donor variant, splice acceptor variant and frameshift variant. Only variants with a MAF < 10−4 in the non-Finnish European (NFE) ancestral group of gnomAD v.2.1.1 (ref. 58) were selected. LoF variants present in the Matched Annotation from NCBI and EMBL-EBI (MANE)/canonical transcript or next best transcript were retained for the analysis. The proportion of cases and controls with LoF variants were compared using the Fisher Exact test for each of the BRRD, GEL and OMGL datasets. UKB LoF burden test was performed using their REGENIE workflow. We included high-quality sequenced variants where >90% samples had a sequencing depth >10, and tested genes with a minor allele count of ≥10. Firth correction was used to account for inflation resulting from case–control imbalance in the UKB. As a negative control, we also performed association testing of rare (MAF < 10–4) synonymous variants for each of the 26 prioritized genes using an identical methodology. Meta-analysis of burden test results was performed using the IVW method including studies with no zero counts and estimating standard error using sample counts59. The results of LoF and synonymous variant association with HCM are shown in Supplementary Table 16 and Fig. 4b. Further results for SVIL LoF variant analyses are shown in Fig. 4c, Supplementary Fig. 19 and Supplementary Table 19.
An exploratory exome-wide gene-based burden testing for LoF variants was also performed, using two MAF thresholds (<10−4 and <10−3). For UKB, this exploratory exome-wide analysis was performed as for the targeted analysis described above. For GEL and BRRD, this analysis was performed on the corresponding GEL and BRRD servers, using pre-annotated (VEP) files and filtering for LoF variants with gnomAD NFE AF < 10−3. For BRRD, variants were lifted to human genome build GRCh38 and LOFTEE was used to select high confidence LoF variants. For OMGL, only rare SVIL variants were available for analysis. Gene-based rare variant burden analyses followed by meta-analysis were performed as mentioned in the preceding paragraph. A sample size weighted meta-analysis was also performed, using the Neff formula shown above. The results of these exploratory exome-wide gene-based analyses are shown in Supplementary Tables 17 and 18 (full summary statistics) and Supplementary Figs. 16–18 (quantile–quantile and Manhattan plots).
Locus colocalization in DCM and HCM
We explored colocalization of HCM and DCM loci using GWAS-PW33. The genome was split into 1,754 approximately independent regions and the all-comer HCM meta-analysis results were analyzed with those of a publicly available DCM GWAS34 using a Bayesian approach. GWAS-PW fits each locus into one of the four models where model 1 is association in only the first trait, model 2 is association in only the second trait, model 3 when the two traits colocalize, and model 4 when the genetic signals are independent in the two traits. We considered a locus to show colocalization when either trait harbors a genetic signal with P < 1 × 10⁻⁵ and the GWAS-PW analysis demonstrates a posterior probability of association for model 3 (PPA3) >0.8. Results of GWAS-PW are presented in Supplementary Table 20.
Two-sample MR
We assessed whether increased contractility and blood pressure are causally linked to increased risk of HCM globally and its obstructive (oHCM) and non-obstructive (nHCM) forms using two-sample MR. LV contractility and blood pressure parameters were used as exposure variables, and HCM, oHCM and nHCM as outcomes. Analyses were performed using the TwoSampleMR (MRbase) package60 (v.0.5.6) in R (v.4.2.0). Four exposure variables corresponding to measures of LV contractility were used separately: LVEF as a volumetric marker of contractility, and global strain (straincirc, strainrad and strainlong) as contractility markers based on myocardial tissue deformation. Instrument SNPs for contractility were selected based on the LV trait GWAS presented here using a P value threshold of <5 × 10⁻⁸. Only independent SNPs (using r2 < 0.01 in the European 1000 Genomes population) were included. Instrument SNPs for the blood pressure analysis were selected with a similar approach using a published blood pressure GWAS39. The outcome summary statistics were those of the single-trait HCM case–control meta-analysis (5,900 cases and 68,359 controls). We also performed a GWAS meta-analysis including data from HCMR and the Canadian HCM cohort (Supplementary Table 1) for nHCM (2,491 cases and 27,109 controls) and oHCM (964 cases and 27,163 controls) to use as outcomes. For these stratified analyses, oHCM was defined as HCM in presence of a LV outflow tract gradient ≥30 mmHg at rest or during Valsalva/exercise at any timepoint. All other HCM cases were considered nHCM. Loci reaching P < 5 × 10⁻⁸ in oHCM and nHCM are shown in Supplementary Table 2 and lookup of all-comer HCM MTAG loci in oHCM and nHCM are shown in Supplementary Table 8.
Insertions/deletions and palindromic SNPs with intermediate allele frequencies (MAF > 0.42) were excluded, and other SNPs in the same locus were included only if P < 5 × 10⁻⁸. An inverse variance weighted MR model was used as a primary analysis. We used three additional methods as sensitivity analyses: weighted median, weighted mode and MR Egger. Cochran’s Q statistics were calculated to investigate heterogeneity between SNP causal effects using IVW. Evidence of directional pleiotropy was also assessed using the MR Egger intercept. Mean F-statistics were calculated to assess the strength of the genetic instruments used. Leave-one-out analyses were also performed to ensure the SNP causal effects are not driven by a particular SNP. To further explore the impact of pleiotropy in the contractility/HCM MR analysis and to evaluate the consequence of excluding outlier SNPs, we used the MR pleiotropy residual sum and outlier (MR-PRESSO) analysis61. MR-PRESSO consists of three steps: testing for horizontal pleiotropy (global test), correcting for horizontal pleiotropy using outlier removal (outlier test) and evaluating differences in the causal estimate before and after outlier removal (distortion test). The summary results of MR analyses and sensitivity analyses are shown in Fig. 5 and Supplementary Table 21, with effect plots shown in Supplementary Fig. 20 (contractility) and Supplementary Fig. 22 (blood pressure), and leave-one-out analyses for the contractility MR in Supplementary Fig. 21. The MR effects are shown per unit change (percentage for contractility; mmHg for blood pressure) in Supplementary Table 21 and Supplementary Figs. 20–22, and per s.d. change in Fig. 5. OR per s.d. increase are calculated as ({rm{OR}}={e}^{{beta }_{{rm{MR}}}times {rm{s.d.}}}); s.d. values are reported in Supplementary Table 21 and correspond to those in the current UKB CMR dataset (for contractility) and those reported by Evangelou et al.39 in the UKB (for blood pressure).
Reporting summary
Further information on research design is available in the Nature Portfolio Reporting Summary linked to this article.
Responses