Controlling Coulomb correlations and fine structure of quasi-one-dimensional excitons by magnetic order
Main
Atomically thin van der Waals (vdW) crystals1 have formed a paragon of how Coulomb correlations can be dramatically enhanced by quantum confinement and reduced dielectric screening. Excitons—Coulomb-bound electron–hole pairs—have reached binding energies of hundreds of millielectronvolts2. Correlations have been precisely controlled by atomic-level structural engineering, including layer stacking3,4,5,6 and twist-angle control7,8,9, which has given rise to superconductivity10, topological phases11 and many other fascinating phenomena12 in vdW materials. In one-dimensional (1D) systems, the interaction among electrons is qualitatively different from their higher-dimensional counterparts, as prototypically described by the Tomonaga–Luttinger liquid theory13. Besides even stronger Coulomb interaction14,15, 1D systems can feature exotic phenomena, such as 1D spin chains16, anomalous quantum tunnelling17 and spin-charge separation18. Yet, comprehensive in situ tuning of the properties of 1D systems has remained challenging.
In this context, the advent of magnetic vdW materials19,20, featuring intertwined excitonic correlations and spin degrees of freedom, has provided new prospects for the field of quantum materials21. These crystals promise flexible control over Coulomb correlations via the magnetic order that is orders of magnitude more efficient even than, for instance, prominent Zeeman shifts in transition metal dichalcogenides22,23,24. In particular, the recently rediscovered vdW magnet CrSBr distinguishes itself through its magneto-optical properties resulting from quasi-1D excitons coupled to A-type antiferromagnetism25,26. Interband spectroscopy has found convincing evidence for the magnetic order to influence interlayer hybridization25,26,27 and, thus, the interband resonances of optically bright excitons without the need to change the structure itself. Yet, interband spectroscopy cannot directly distinguish Coulomb-correlation effects from single-particle bandgap renormalization28, which can also dramatically change across a phase transition25. Moreover, the feeble oscillator strength for light emission polarized along the crystal a axis26 complicates conclusions about the internal structure of excitons in CrSBr.
Here we use mid-infrared (MIR) excitonic Rydberg spectroscopy6,9,29,30,31,32, which is independent of interband selection rules and can directly and exclusively probe internal exciton transitions33, shaped entirely by Coulomb correlations. Combining these measurements with state-of-the-art many-body theory26,28,34,35, we can quantitatively resolve Coulomb correlation effects across the transition from an antiferromagnetic (AFM) to a paramagnetic (PM) state in CrSBr. The anisotropy-induced fine structure of all optically dark and bright excitons reveals their binding energy and the quasi-1D nature of the exciton orbitals. Most importantly, the AFM–PM phase transition strongly modifies the internal exciton structure and, thus, the underlying Coulomb correlations. Our theory explains this behaviour by strongly different spin restrictions of the out-of-plane quantum confinement in both phases, enabling efficient extrinsic control of dimensionality and Coulomb correlations. This scenario is confirmed by the temperature dependence of the ultrafast exciton formation and decay dynamics.
Revealing the internal fine structure of quasi-1D excitons
In CrSBr, chromium and sulfur atoms form 1D chains along the crystallographic b axis36 (Fig. 1a). This gives rise to an anisotropic band structure with dramatically different effective masses along the a (Γ–X) and b (Γ–Y) directions (Fig. 1b). For the conduction band minimum, the corresponding values are ({m}_{{a}}^{{rm{e}}}=7.31times {m}_{0}) and ({m}_{{b}}^{{rm{e}}}=0.14times {m}_{0}) (ref. 26), where m0 is the bare electron mass, leading to a ratio of ({m}_{{a}}^{{rm{e}}}/{m}_{{b}}^{{rm{e}}}=52). The structural anisotropy also leads to markedly different dielectric functions along the a and b axes, with εb ≫ εa (refs. 26,27), which entails a strongly asymmetric Coulomb potential (Fig. 1c). This combined mass and Coulombic asymmetry is expected to create strongly anisotropic excitons whose wavefunctions mainly extend along the b axis with a lifted degeneracy of energy levels, as explained in the next section. The effective quantum confinement of these excitons sensitively depends on whether electrons can spread over neighbouring monolayers. Below the Néel temperature37 (TN = 132 K), CrSBr exhibits in-plane ferromagnetically ordered layers, which—in the bulk—are antiferromagnetically coupled to adjacent layers. This coupling mechanism blocks the interlayer hopping25 of electron–hole pairs and, consequently, confines the Coulomb-bound pairs in one dimension within individual layers26 (Fig. 1a, bottom). Nevertheless, elevating the temperature through a potential intermediate coexistence regime of ferromagnetic (FM) and AFM orders38,39 to the PM phase should enable interlayer hybridization, relax the strict out-of-plane confinement and impart a less 1D character on the excitons (Fig. 1a, top).
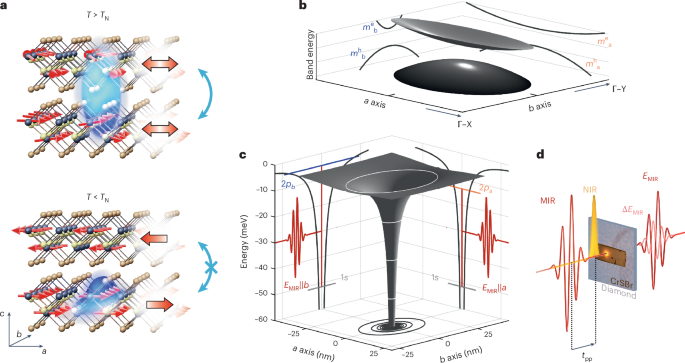
a, Schematic of the coupling of excitons (blue surfaces) to the magnetic order (red arrows) in CrSBr (dark spheres, Cr; yellow spheres, S; brown spheres, Br). In the AFM phase (T < TN, large red arrows), the quasi-1D excitons stretched along the b axis are confined to individual layers (bottom) because interlayer hopping is spin-forbidden (crossed-out blue double arrow). The paramagnetic phase (T > TN, large red double arrows) allows excitons to be delocalized (blue double arrow) across neighbouring layers (top). b, Schematic of the band structure of CrSBr. For clarity, the bandgap is substantially reduced. The projections of the elliptic paraboloids onto the a (Γ–X) and b (Γ–Y) directions highlight the large difference in the effective mass of the lowest conduction band (me) and the highest valence band (mh). c, Anisotropic Coulomb potential (grey surface) of the excitons. The isoenergy contours (white ellipses) and the projections (black lines) onto the two crystallographic directions highlight the large in-plane anisotropy. Although the a and b axes share a common 1s level (light grey line), the degeneracy of the 2p states is lifted. Consequently, the 1s–2pa and 1s–2pb transitions (vertical red lines) feature different energies that are interrogated by MIR transients (red waveforms) of orthogonal polarization (EMIR||a and EMIR||b, respectively). d, Schematic of the time-resolved NIR pump–MIR probe spectroscopy experiment. After a variable delay time tpp, the electric field of the MIR waveform is transmitted through the CrSBr crystal and the diamond substrate. The transmitted MIR transient, EMIR, and changes to its electric field, ΔEMIR, induced by the presence of the photogenerated electron–hole pairs are electro-optically recorded.
To explore the internal structure and the dynamics of excitons in CrSBr, we first prepare free electron–hole pairs in the AFM phase of a 620-nm-thick bulk sample using optical excitation across the single-particle bandgap with femtosecond near-infrared (NIR) pulses (centre wavelength, 785 nm; pulse duration, 20 fs; Fig. 1d and Extended Data Fig. 1). The polarization is set along the b axis to ensure effective excitation utilizing the large transition dipole moment in this direction as opposed to the a axis25,26. Following above-bandgap excitation, excitons form on a subpicosecond timescale, as discussed later. After a variable delay time tpp, a phase-locked MIR pulse is transmitted through the sample to interrogate intraexcitonic transitions (Fig. 1c,d, red waveforms), for example, between the 1s and 2p orbitals6,9,29,32. By simultaneously recording the electric field of the MIR waveform, EMIR, and its pump-induced change, ΔEMIR, using electro-optic sampling, we can access the full dielectric function of the photoexcited electron–hole ensemble in the MIR regime40 and retrieve the internal structure of excitons32 (Methods). By rotating the MIR electric field polarization, we can selectively probe the response of the photoexcited electron–hole pairs along the a or b axis (Fig. 1c). The elongated shape36,38 of the exfoliated CrSBr flake indicates its crystallographic orientation (Fig. 1d and Supplementary Fig. 1).
Figure 2a shows the pump-induced changes in the MIR absorption Δα and the real part of the dielectric function Δε1 retrieved from the time-domain data at a pump–probe delay time of tpp = 500 fs after photoexcitation and a lattice temperature of T = 5 K. When EMIR is polarized along the b direction (Fig. 2a, blue spheres), Δα features a pronounced maximum at a photon energy of 62 meV, whereas Δε1 exhibits a dispersive shape at nearly the same energy. Minor spectral shifts between the two features are expected from residual electron–hole plasma contributions.
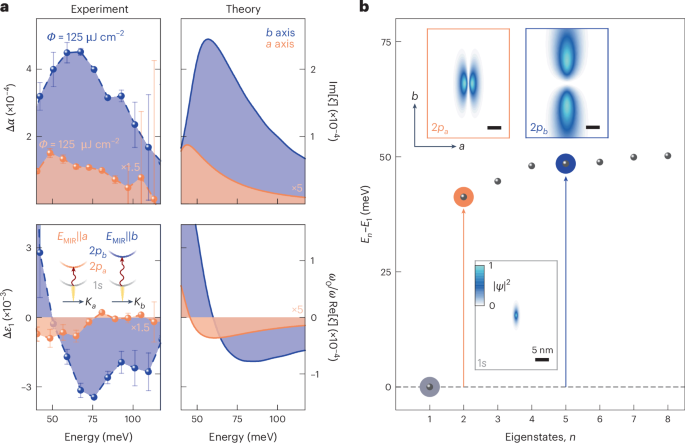
a, Experimental (left) and theoretical (right) pump-induced changes in the MIR absorption (Δα; top) and the real part of the dielectric function (Δε1; bottom) as a function of photon energy. The experimental data were recorded at a pump–probe delay time of tpp = 500 fs along the crystallographic a (orange dots; pump fluence, ΦNIR = 450 μJ cm–2) and b (blue dots; ΦNIR = 125 μJ cm–2) axes and at a lattice temperature of T = 5 K. The error bars were retrieved by quantifying the uncertainty in the pump-induced change to the electric field ΔEMIR via the standard deviation of a set of five measurements. For clarity, the experimental and theoretical data along the a axis have been scaled by a factor of 1.5 and 5, respectively. The rather large fluence needed to achieve a measurable MIR response along the a axis indicates a weaker intraexcitonic oscillator strength compared with that along the b axis. Our experiment–theory analysis is fully quantitative since Rydberg spectroscopy measures changes in the transmitted MIR field that have a one-to-one connection to a uniquely scaled susceptibility32,33 ξ (right axis). This allows us to easily construct the intrinsic linear absorption α = 2Im[ξ] and Δε1 (Methods). Inset: schematic of the internal quantum transitions of anisotropic photogenerated excitons with non-degenerate 2p states triggered by MIR pulses polarized along the crystallographic a or b axis (EMIR||a or EMIR||b, respectively). The dispersions are plotted as a function of centre-of-mass momentum K. b, Calculated series of eigenenergies En relative to the ground-state energy E1. The degeneracy of the 2p states is lifted resulting in a splitting of ~13 meV. The arrows indicate the transition energy from the 1s state (horizontal dashed lines) to the energetically higher-lying 2pa (orange) and 2pb (blue) states. Insets: probability densities |Ψ|2 for 1s (grey box), 2pa (orange box) and 2pb (blue box) orbitals of a quasi-1D exciton derived from the anisotropic effective mass and dielectric screening (compare Fig. 1b,c; Methods).
We analyse our measurements with a many-body theory that comprehensively incorporates band structure details, asymmetric dielectric screening of the Coulomb interaction and polaritonic effects (Methods). Our computations (Fig. 2a, right) simultaneously confirm the resonant peak in Δα and the dispersive shape in Δε1, and assign them to a Rydberg-like intraexcitonic transition between the 1s exciton and 2pb state. Higher-lying p states yield an asymmetric line shape, whereas the 1s state is slightly shifted (by 10 meV) owing to its polaritonic nature27 at NIR frequencies (Methods). In stark contrast, probing with EMIR||a yields a substantially reduced response with a resonance that is redshifted by 13 meV, in both experiment (Fig. 2a, orange spheres) and theory (Fig. 2a, right). Thus, the 1s–2pa transition is located at lower energies than the 1s–2pb transition, proving that the degeneracy of the 2p states, observed in isotropic systems6,29, is strongly lifted in CrSBr. To the best of our knowledge, this is the first observation of excitonic fine structure made by direct Rydberg spectroscopy.
To quantitatively test our assignment of resonances, we compute the exciton wavefunctions and their corresponding fine structure. The lowest-energy exciton states are shown in Fig. 2b (insets) together with the Rydberg series (dots). The 1s state is spatially confined on the single-nanometre scale and is extremely anisotropic, featuring a Bohr radius of 0.7 nm and 2.5 nm along the a and b axes, respectively. The strong anisotropy also gives rise to drastically different 2pa and 2pb states, which exhibit a characteristic sign change along the a and b axes, respectively. Whereas the 2pa state is strongly curved with a Bohr radius of 2.8 nm along the a axis, the 2pb orbital is much more elongated (17.2 nm) along the b axis. The large average distance between the electron and hole reduces the binding energy of the 2pb orbital compared with the 2pa state by 13 meV, as seen in the series of eigenenergies depicted in Fig. 2b. This picture also explains the strong anisotropy in the magnitude of the MIR response (Fig. 2a). The 1s and 2pb states are both elongated along the b axis, resulting in a large oscillator strength. Conversely, the 1s and 2pa states are aligned along nearly orthogonal directions, which suppresses the transition rate by approximately a factor of five, consistently proving the exceptional in-plane anisotropy and almost-1D nature of excitons in CrSBr.
Magnetic-order control of excitonic quantum confinement
Because the excitonic fine structure maps electron–hole interactions, it represents a unique tool to study the impact of magnetic order on Coulomb correlations. We start by following how the intraexcitonic 1s–2pb resonance changes from the AFM to PM phase by tuning the lattice temperature. Figure 3a shows the measured MIR response functions (spheres). The pump–probe delay time is kept large enough (tpp = 4 ps) for the photoexcited electron–hole pairs to form excitons and reach a quasi-equilibrium distribution. This also suppresses the inhomogeneous broadening of the 1s–2p transition by the contribution of higher-lying 1s-exciton–polariton states (Methods). For T = 40 K, the 1s–2pb resonance gives rise to the same fingerprints in Δα and Δε1 at an energy of 62 meV as those shown in Fig. 2a. On increasing the temperature up to TN = 132 K, the resonance energy remains nearly unchanged (Fig. 3a, dashed vertical line), whereas the linewidth broadens. By contrast, at the transition to the PM phase37, the linewidth increases abruptly and the apparent resonance energy shifts.
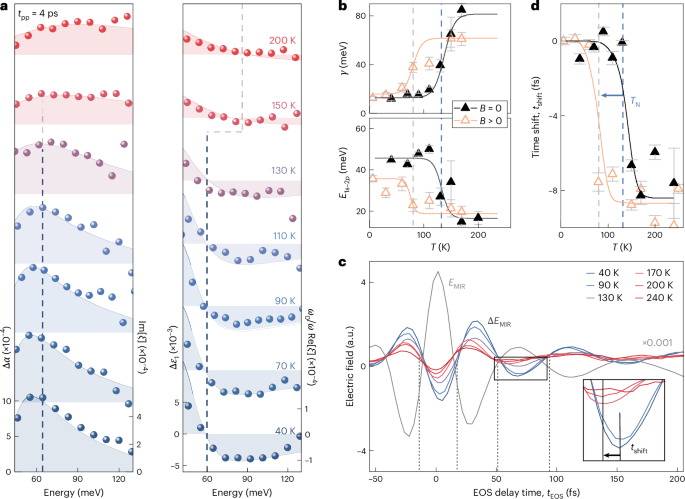
a, Pump-induced changes in the MIR absorption (Δα) and the real part of the dielectric function (Δε1) as a function of photon energy at a pump–probe delay time tpp = 4 ps for different temperatures T (colour coded; pump fluence, ΦNIR = 300 μJ cm–2). Curves are vertically offset for clarity. The spheres and the shaded areas represent the experimental and theoretical data, respectively. All right axes show the function ξ defined in the Methods. The vertical dashed lines track the maximum of Δα and the corresponding zero crossing of Δε1, revealing an abrupt jump close to TN. b, Theoretically calculated dephasing constant γ and transition energy E1s−2p as a function of T. The symbols represent the values derived from the fit to the experimental data shown in a. The error bars of γ and E1s−2p are derived using the covariance matrix of the nonlinear fit to the experimental data shown in a. c, Electric field of the MIR probe transient EMIR (scaled by a factor of 10−3 for comparison) as a function of the electro-optic sampling (EOS) time tEOS. The simultaneously acquired pump-induced changes to the electric field ΔEMIR are depicted for different temperatures. Inset: close-up view of the data marked by the rectangle. For decreasing temperature, the minimum of ΔEMIR shifts gradually by the time tshift (arrow), as shown in d. Analogous analyses for other oscillation half-cycles are shown in Supplementary Fig. 2. d, Experimental (black symbols) and theoretical (black line) time shift tshift of the half-cycle marked by the rectangle in c as a function of T (compared with the timing at T = 40 K) without an external magnetic field. TN is marked by a vertical dashed blue line. An applied magnetic field of 200 mT along the b axis induces an intermediate FM phase at T′ causing the jump in tshift in both experiment and theory (orange symbols and line, respectively) to occur at only ~80 K (arrow and grey dashed line; Supplementary Fig. 3). The error bars represent the 95% confidence interval of the fitting procedure used to determine the extrema of the waveforms.
A rigorous theory–experiment comparison allows us to quantitatively link the spectral response to the temperature-dependent microscopic 1s–2p transition energy E1s−2p and the dephasing constant γ, which determines the spectral broadening (Fig. 3b and Methods). Because we demand our many-body theory to simultaneously reproduce Δα and Δε1, instead of simply analysing only one of these quantities, the error bars for E1s−2p remain on the few-millielectronvolt level for all temperatures (Fig. 3b, error bars). Remarkably, both E1s−2p and γ switch abruptly at around T = TN, explaining the sudden changes in the spectral response. Whereas γ jumps by more than a factor of 6, the polariton-corrected value of E1s−2p exhibits a crossover from tightly bound (50 meV) to weakly bound (15 meV) excitons.
These features are consistent with a phase transition from 1D to three-dimensional excitons. Thermal fluctuations relax the constraints induced by the magnetic order, which delocalizes the exciton wavefunction across adjacent layers. This increase in the localization length results in a monotonic reduction in the 1s energy E1s, whereas the other states remain largely unaltered (Extended Data Fig. 3). Overall, this leads to a reduction in the exciton binding energy and an increase in the scattering rates and, thus, dephasing γ (Methods). This trend shifts E1s−2p defining the position of the MIR absorption peak (Fig. 3 and Extended Data Fig. 2). As shown in Fig. 2a, the 1D exciton yields a distinct asymmetric resonance close to E1s−2p. By contrast, three-dimensional excitons feature a broad spectrum (Fig. 3a) in which the very large γ renormalizes the spectrum to show a shallow resonance close to the energy corresponding to γ (Extended Data Fig. 4).
The change in the spectral response functions leaves unique fingerprints even in the raw time-domain data (Fig. 3c). For all investigated temperatures, the pump-induced change in the MIR electric field ΔEMIR is phase-shifted by π with respect to the reference electric field EMIR, indicating an attenuation of the transmitted MIR field through absorption by intraexcitonic transitions. For T < TN, the well-defined 1s–2pb resonance additionally manifests as pronounced retarded oscillations persisting up to tEOS = 200 fs. These signatures are absent in the PM phase (T > TN), owing to the weak and massively broadened exciton response, as confirmed by our theory (Methods). The disappearance of a narrow spectral feature in the response function considerably shifts the extrema of ΔEMIR for all trailing half-cycles. Figure 3c (inset) illustrates this time shift tshift for one half-cycle (rectangle). The temperature dependence of tshift (T) with respect to tshift (T = 40 K) (Fig. 3d, black triangles) exhibits an abrupt jump at around TN = 132 K; the other half-cycles yield a similar discontinuity in tshift (Supplementary Fig. 2). Our many-body calculations fully capture the observed behaviour (Fig. 3d, solid curve). Although full spectral information was required to disentangle the effects of the renormalization and broadening of excitonic energy, the experimentally observed tshift effectively reveals the essence of the temperature-induced changes in the internal structure of excitons.
To confirm that the observed drastic changes in the exciton fine structure result from the spin order and not from thermal effects, we induce an intermediate FM phase close to the AFM–PM phase transition using a static magnetic field of Bstat = 200 mT applied along the easy axis36 (b axis). By repeating the same experiment–theory comparisons as those shown in Fig. 3a,c under magnetic bias (Supplementary Fig. 3), we observe a similarly abrupt jump in tshift with temperature (Fig. 3d, orange triangles). In stark contrast to the case without an external magnetic field, this step already occurs at a temperature that is reduced by about 50 K. This new transition temperature T′ < TN indicates that Bstat induces a change in the magnetic structure and, more precisely, forces an interlayer FM ordering much below the Néel temperature. This scenario is in good agreement with the field-induced AFM–FM transition observed in recent magnetometry studies on CrSBr (refs. 41,42). Therefore, the external magnetic field results in the breakdown of the magnetic-order-induced quantum confinement of excitons into a single monolayer of CrSBr and delocalizes them even below TN. Our results introduce the magnetic field as a readily tunable parameter to custom-tailor the internal exciton structure in magnetic vdW materials, which has not been possible in any other two-dimensional material so far, to the best of our knowledge.
Impact of magnetic order on exciton decay dynamics
The influence of spin order on the effective exciton confinement should also be imprinted on the ultrafast dynamics of these quasiparticles. To investigate this connection, we record the maximum of the pump-induced change in the MIR field transient, (Delta {E}_{{rm{MIR}}}^{max }), as a function of the pump–probe delay time tpp, for temperatures below and above TN (Fig. 4a). The evolution of (Delta {E}_{{rm{MIR}}}^{max }) closely follows the exciton density; it abruptly increases during photoexcitation before it decays on a picosecond scale. Whereas a subtle change in the onset as a function of temperature reflects polaritonic corrections43 (Methods and Extended Data Fig. 5), we mainly focus on the more relevant decay dynamics. In the AFM phase, the relaxation follows a single exponential function with a decay constant of τ1 ≈ 13 ps representing the recombination of quasi-1D excitons, where electrons and holes are located in the same layer (intralayer excitons).
Close to the magnetic phase transition, however, an additional slower decay component with a lifetime of τ2 > 60 ps emerges as the fast decay persists (Fig. 4b). We assign the short-lived decay to quasi-1D intralayer excitons for which a strong electron–hole spatial overlap yields a short lifetime (τ1), whereas the weak overlap among delocalized interlayer excitons implies increased τ2 ≫ τ1. As shown in Supplementary Section 4, we can accurately convert the relative amplitudes of the fast and slow components to the decay dynamics of the actual inter- and intralayer exciton fractions (Fig. 4a (top), broken lines) or track them as functions of temperature (Fig. 4d). Whereas only intralayer excitons exist for T < TN, both inter- and intralayer excitons occur above TN. This behaviour unveils a key aspect of the excitons at play: the phase transition into the PM phase does not change the dimensionality of all excitons at once, but rather enables a coexistence of different species. When the AFM order is quenched, spin restrictions on interlayer tunnelling are lifted, and some of the electrons and holes can move between adjacent layers. Consequently, electron–hole pairs can form both inter- and intralayer excitons as the thermodynamic equilibrium is approached in the level system indicated in Fig. 4a (inset).
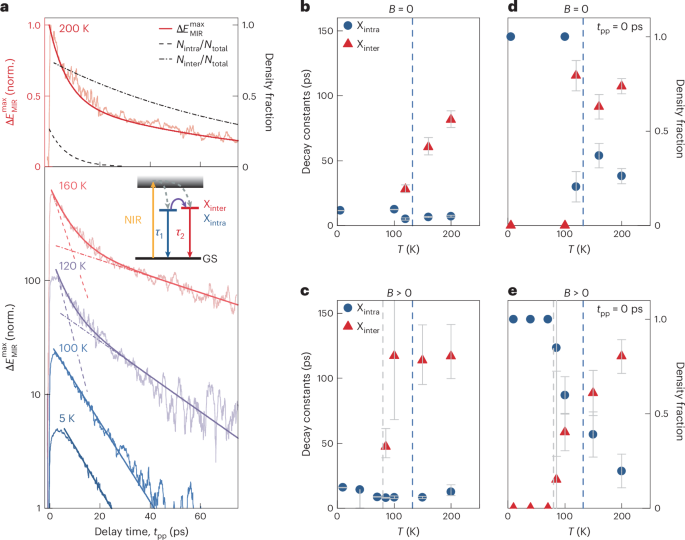
a, Maximum of the pump-induced change in the MIR electric field (Delta {E}_{{rm{MIR}}}^{max }) as a function of the pump–probe delay time tpp for a fixed electro-optic sampling time tEOS (light-coloured lines; ΦNIR = 225 μJ cm–2) recorded at different temperatures T. The data on a logarithmic scale are vertically offset for clarity. The darker-coloured lines represent mono- and biexponential decay fits. For clarity, a ten-point (thirty-point) moving average was applied for delay times smaller (larger) than 20 ps. The dashed lines indicate the isolated fast- and slow-decay components of the fit and highlight the deviation from monoexponential decay at elevated temperatures. Top: density fraction of intralayer and interlayer excitons as a function of tpp at T = 200 K (dashed lines). b, Decay times of intralayer (τ1; blue circles) and interlayer (τ2; red triangles) excitons as a function of T obtained from the fit in a. τ2 rises close to TN (dashed line). c, τ1 and τ2 as a function of T with an applied magnetic bias (Bstat = 200 mT) along the b axis, obtained from the fit in Extended Data Fig. 6. The slower decay component (τ2) emerges at T′ ≈ 80 K (grey dashed line). d,e, Density fraction of intra- and interlayer excitons as a function of T without (d) and with (e) an applied magnetic field. The extraction procedure is described in Supplementary Section 4. The error bars represent the 95% confidence interval of the fitting routine. For the temperatures featuring only the decay component τ1 in b and c and no error bars in d and e, a monoexponential decay was sufficient to describe the experimental data reasonably well. Panels b–e share the same colour code. The inset in a shows the level scheme of interlayer-like (Xinter) and intralayer-like (Xintra) excitons relative to the continuum (shaded region) and the ground state (GS). Upon excitation by the NIR pulse (yellow arrow), both exciton species can form (dashed arrows) and decay with rates τ1 and τ2. Elevated lattice temperatures facilitate the population of Xinter (purple arrow), resulting in a decrease (increase) in the fraction of the short-lived (long-lived) exciton species.
Finally, we put this scenario to its ultimate test, by applying a magnetic bias of Bstat = 200 mT (Fig. 3b,d), which can enforce an AFM–FM phase transition below TN. Intriguingly, the slow-decay component now occurs for temperatures as low as T′ = 80 K (Fig. 4c and Extended Data Fig. 6), where also the density of interlayer excitons sets on (Fig. 4e). These findings demonstrate that the magnetic order not only controls the effective dimensionality and fine structure of excitons in CrSBr, but also the coexistence of different exciton species.
Discussion
We have directly resolved the anisotropic fine structure of quasi-1D excitons by intraexcitonic Rydberg spectroscopy. Our quantitative experiment–theory comparisons of the exciton binding energy reveal how the band structure and Coulombic anisotropy lift the degeneracy of the 2p states and induce a strong direction-dependent oscillator strength. In the AFM state, the excitons are layer localized even in the bulk material, resulting in quasi-1D excitons. Forcing a phase transition, either by thermal heating above the Néel temperature or by applying a weak magnetic field, facilitates electronic hopping between neighbouring layers. This scenario relaxes the quantum confinement, reducing the electron–hole binding energy and dramatically enhancing the phase space for scattering. Our results, thus, introduce magnetic order as a critical tuning knob for excitonic correlations and highlight a pathway to switch exciton properties in CrSBr in future spintronic applications. As a next step, the strong interaction between excitons and magnetic order could be further tuned by proximity effects44,45,46. In this context, it would be of particular interest to study few-layer and monolayer samples47 with larger exciton binding energies. Moreover, strong light–matter coupling renders CrSBr a prime candidate for creating exciton–polaritons27,48 with strongly and simultaneously coupled electronic, magnetic and photonic degrees of freedom. In particular, our magnetic control of the internal structure of excitons could open a unique playground for interfacing macroscopic wavefunctions of exciton–polariton condensates with spintronics—a spectacular vision for novel solid-state quantum technologies.
Methods
Time-resolved NIR pump–MIR probe spectroscopy
A schematic of the experimental setup is shown in Extended Data Fig. 1a. Our home-built Ti:sapphire laser amplifier (repetition rate, 400 kHz) delivers ultrashort NIR pulses with a duration of 20 fs (full-width at half-maximum). The NIR pulses are split into pump, probe and gate branches. A half-wave plate in the pump branch was installed to excite excitons along the b direction and to probe either along the a or b direction of the CrSBr crystal. Optical rectification of ultrashort NIR pulses in a 10-µm-thick GaSe crystal is used to generate phase-locked MIR probe pulses. After a variable delay time tpp, an MIR probe pulse propagates through the photoexcited sample. The transmitted MIR waveforms are superimposed with ultrashort gate pulses onto a second 10-μm-thick GaSe electro-optic crystal to record the electric field EMIR as a function of the electro-optic sampling time tEOS (Extended Data Fig. 1b). The MIR probe pulses are centred at a frequency of 17 THz with a full-width at half-maximum of 15 THz and an approximately flat spectral phase between 15 and 40 THz (Extended Data Fig. 1c). The changes to the electric field, ΔEMIR(tEOS), transmitted through the excited and unexcited sample are directly resolved in absolute amplitude and phase by serial lock-in detection as a function of tEOS. We use a transfer matrix formalism technique to extract the full complex-valued dielectric response function, characterized by Δα and Δε1 (refs. 6,32,40). These spectroscopic data are sensitive to the total population of bound and unbound electron–hole pairs, irrespective of interband selection rules and can, thus, address optically dark and bright excitonic states.
Theoretical analysis
To describe the MIR response, we utilize a full many-body theory as presented in other work30,34. Exciton states and energies that determine the internal structure and dipole moments of intraexcitonic transitions are obtained by solving an anisotropic Wannier equation. We obtain the necessary material parameters from ab initio density functional theory band structure calculations including many-body corrections within the GW approximation26. The dielectric screening of the Coulomb interaction is described via an anisotropic dielectric function derived from Poisson’s equation49 for a CrSBr monolayer embedded in bulk CrSBr. Our computations incorporate spatial non-locality via the in-plane momentum dependence of the dielectric function, resulting from single-layer-localized electronic states in the AFM state25,26 and multilayer-extended states in the PM state.
Since the MIR wavelength is much longer than the sample thickness L, the MIR field propagates through an effectively thin two-dimensional layer whose intrinsic optical properties are described by an effective two-dimensional susceptibility χ2D(ω) (in units of metres) as a function of the angular frequency of the MIR field. We compute the full many-body χ2D(ω) via the steps outlined above. Following the discussion in refs. 28,34, it is useful to introduce a dimensionless, scaled susceptibility ({rm{xi }}left({rm{omega }}right)=frac{{rm{omega }}}{2c}{chi }_{2{rm{D}}}left({rm{omega }}right)) containing the speed of light c in a vacuum. This response function ξ(ω) connects computations directly with the measured transmission amplitude T(ω) and linear absorption α(ω) via (Tleft({rm{omega }}right)=frac{1}{1-i{rm{xi }}left({rm{omega }}right)}) and ({rm{alpha }}left({rm{omega }}right)=frac{2{rm{Im}}left[{rm{xi }}left({rm{omega }}right)right]}{{left|1-i{rm{xi }}left({rm{omega }}right)right|}^{2}}) that become T(ω) → 1 + iξ(ω) and α(ω) → 2Im[ξ(ω)] for the small |ξ(ω)| ≪ 1 studied here. Additionally, the pump-induced dielectric change becomes (Delta {{{varepsilon }}}_{1}=mathrm{Re}left[frac{2c}{{{omega }}L}{rm{xi }}left({{omega }}right)right]). With the help of the measured MIR probe spectrum (Extended Data Fig. 1), we predict the pump-induced changes to the transmitted electric field as ΔE(ω) = iξ(ω)EMIR(ω) to determine ΔE(tEOS) and the time shift tshift of each half-cycle in the time domain. Extended Data Fig. 2a,b compares the measured versus computed ΔE(tEOS), respectively, for four representative temperatures. In all these cases, theory reproduces experimental details with great precision.
Precision of delay-based measurement in detecting excitonic features
Since our theory rigorously connects the temporal traces, ΔE(tEOS), to the computed excitonic MIR responses, ξ(ω), we can quantitively determine how accurately our temporal-shift measurements (Fig. 3) can track the changes in the excitonic dephasing γ or the 1s–2p transition energy E1s–2p; Extended Data Fig. 2c shows Im[ξ(ω)] corresponding to the four temporal traces in Extended Data Fig. 2a. Among these cases, γ changes by δγ = 70 meV and E1s–2p by δE1s–2p = 35 meV as the temperature rises from 40 K to 200 K.
To precisely quantify the minimum experimentally detectable excitonic changes, we start from ξ(ω) at 40 K, separately vary δγ and δE1s–2p computationally and determine the resultant changes in the timing of the peak field (δtpeak) and the relative peak field strength (δEpeak/Epeak) at the electric field extrema (Extended Data Fig. 2a, dashed rectangle). These values are compared with the experimental temporal (Δtres) and peak-field-strength (ΔEpeak) precision values determined from four consecutive measurements performed at a temperature of 40 K. The standard deviation of these measurements yields Δtres = 0.5 fs and ΔEpeak/Epeak = 5%. Specifically, Extended Data Fig. 2d shows the changes in δtpeak (top) and δEpeak/Epeak (bottom) as a function of perturbations δγ (solid lines) or δE1s–2p (dashed lines). We conclude that variations in δγ and δE1s–2p as small as 5 meV already produce changes above the experimental detection thresholds of Δtres and ΔEpeak/Epeak (Extended Data Fig. 2d, shaded area). At 200 K, separate changes of δγ = 70 meV or δE1s–2p = 35 meV alone yield the results indicated by the open squares. In the actual measurements, simultaneous changes in δγ and δE1s–2p are connected (solid circles in Extended Data Fig. 2d); the arrows indicate the response changes between the individual (open squares) and simultaneous (solid circles) variations in δγ and δE1s–2p.
These cases considerably exceed the detection thresholds, corroborating that our measurements and temporal analysis can sensitively assign the key excitonic features γ, E1s–2p and ξ(ω) reported in the main text. Although tshift depends on both δγ and δE1s–2p, it alone cannot assign an exact value for them because multiple combinations of δγ and δE1s–2p produce the same tshift (Extended Data Fig. 2d). However, our combined spectral–tshift analysis uniquely assigns (γ, E1s−2p) from the experiments, as confirmed in Extended Data Fig. 2.
Impact of exciton localization and scattering on the internal exciton structure
To analyse the temperature-dependent MIR response, we first identify the connection of many-body and measurable quantities. At low temperatures, the AFM order prevents interlayer hybridization and localizes the exciton wavefunction within a single layer25,26. Thermal fluctuations relax the constraints induced by the magnetic order, which, in turn, allows the exciton wavefunction to spread across adjacent layers. This spreading reduces both electron–hole Coulomb interaction and exciton binding energy. The underlying localization length scale d modifies the unscreened Coulomb potential (U(|{bf{q}}|)=frac{{e}^{2}}{2{varepsilon }_{0}q}F(q)) through a form factor50 (Fleft(qright)=frac{2}{uppi }arctan left(frac{uppi }{{qd}}right)). Extended Data Fig. 3a shows the exciton series for varying extensions of the wavefunction over adjacent layers. Increasing the localization length results in a monotonic reduction in energy E1s, whereas the other states remain essentially unchanged. This trend shifts the E1s−2p energy defining the position of the MIR absorption peak (Extended Data Fig. 2 and Fig. 3). Figure 3b displays the values of E1s−2p = 46 meV below and E1s−2p = 16 meV above TN, respectively. On the basis of Extended Data Fig. 3b, this change in E1s−2p corresponds to a transition from a single monolayer (1 ML) to eight monolayers (8 ML) as TN is crossed. The spreading across 8 ML also increases the effective dimensionality of electrons and holes as the confinement is relaxed, enabling new transition and scattering possibilities across the layers. The increased scattering induces an elevated dephasing γ. As shown in Fig. 3b, γ grows by more than a factor of six when the system undergoes the Néel transition, which corroborates a substantial increase in the exciton’s dimensionality.
To illustrate the effects of delocalization and broadening, Extended Data Fig. 4c,d compares the MIR response at a low temperature (T = 40 K; localization to 1 ML) to a delocalized case (shaded area; spreading across 8 ML) with substantially enhanced γ. The corresponding 1s–2p transition energies are ({E}_{1s-2p}^{1{rm{L}}}=42,{rm{meV}}) for the 1 ML case and ({E}_{1s-2p}^{8{rm{L}}}=15,{rm{meV}}) for the 8 ML case. We observe that the peak in the MIR absorption follows the 1s–2p energy (red arrow) only for the 1 ML case, whereas the 8 ML peak shifts to higher energies contrary to the reduced E1s−2p. This seemingly counterintuitive trend is explained by the considerably increased dephasing (from γ1L = 13 meV to γ8L = 82 meV) that renormalizes51 the observed absorption peak to an energy ({widetilde{E}}_{1s-2p}=sqrt{{left({E}_{1s-2p}right)}^{2}+{{rm{gamma }}}^{2}}) (Extended Data Fig. 4c, black arrow), and causes a substantial blueshift in the MIR absorption peak.
Accurate parameterization of the Néel transition
As shown above, localization yields a strong d dependence for γ and, in particular, E1s from the entire Rydberg series. This identifies (γ, E1s−2p) as the minimum set of d-dependent many-body quantities; we use the experimentally measured intraexcitonic energy separation E1s−2p to single out the relevant Coulomb-induced many-body effects from bandgap renormalization effects.
To test whether (γ, E1s−2p) parameterizes the Néel transition, we compare a full 8 ML computation including all many-body changes with a 1 ML computation that is adjusted to match the 8 ML one by changing only (γ, E1s−2p). Specifically, Extended Data Fig. 4a,b shows the scaled susceptibility, ξ(ω), for the full 1 ML (red line, γ = 13 meV, E1s−2p = 42 meV), full 8 ML (shaded area, γ = 82 meV, E1s−2p = 15 meV) and adjusted 1 ML (black line, γ = 82 meV, E1s−2p = 15 meV) cases. The change from the full 1 ML to full 8 ML is dramatic, as expected when the system undergoes a Néel transition. However, the adjusted 1 ML computation accurately predicts the 8 ML result only when the (γ, E1s−2p) pair is changed in an otherwise consistent computation.
Thus, we have verified that the experimentally studied dimensionality control (via the Néel transition) can be parameterized via (γ, E1s−2p) alone. This allows us to similarly add the E1s polariton shift to E1s−2p (see the section below) and strongly reduce the numerical effort because the many-body details need to be computed only once, whereas a (γ, E1s−2p) pair accurately describes the dimension-dependent effects. We have applied this scheme in Figs. 2b and 3 and Extended Data Fig. 4 to accurately include a polariton correction of Δ = 10 meV to E1s−2p.
Full spectral analysis
To map the temperature dependence of the (γ, E1s−2p) parameters, we carefully assign the maximum likelihood (γ, E1s−2p) corresponding to each measurement. We simply convert the measured MIR transmission coefficient T(ω) to the scaled susceptibility ({rm{xi }}left({rm{omega }}right)={rm{i}}frac{1-Tleft({rm{omega }}right)}{Tleft({rm{omega }}right)}). This allows us to compare the experimental ξexp(ω) and computed ξ(ω) values, as well as the absorptive (Im[ξexp(ω)]) and dispersive (Re[ξexp(ω)]) responses, in the same absolute units to have a reliable assignment of maximum likelihood. Specifically, we minimize the least-mean square deviation, Mean[|ξ(ω) – ξexp(ω)|2], as a function of (γ, E1s−2p). Extended Data Fig. 4a,b shows the maximum-likelihood solution (red line) to the measured response (spheres) at T = 170 K without an external magnetic field. The calculated time shift tshift of the time transient is comparable with the experimental estimate (tshift = –8 fs, third half-cycle). As discussed above, the same tshift can be obtained by changing only γ or only E1s−2p compared with the 170 K experiment. Adjusting either γ (black line) or E1s−2p (blue line) individually to achieve tshift of –8 fs results in notable spectral deviations (Extended Data Fig. 4b, inset). This confirms that using the full spectral information is necessary to accurately determine a unique (γ, E1s−2p) pair from the tshift measurements, as demonstrated in the main text.
Phase transition model
The temperature-dependent maximum-likelihood (γ, E1s−2p) parameters are shown as symbols in Fig. 3b. Clearly, both parameters exhibit a strong change above TN (marked as the dashed blue line), and the magnetic field shifts the transition temperature to a smaller value (dashed grey line). On the basis of these data, (γ, E1s−2p) closely follows the empirical phase transition model below:
with fitting parameters for the transition temperature (Tγ and TΔ), transition rate (ΔTγ and ΔTE), and low (γ0 and E0) and high (γ∞ and E∞) temperature limits. Without an external magnetic field, we find Tγ = 137.5 K, TΔ = 132.5 K, ΔTγ = 18.9 K, ΔTE = 14.8 K, γ0 = 12.8 meV, E0 = 45.7 meV, γ∞ = 81.6 meV and E∞ = 16.5 meV; and with a magnetic field, Tγ = 80 K, TΔ = 75 K, ΔTγ = 16.2 K, ΔTE = 9.1 K, γ0 = 15.8 meV, E0 = 35.7 meV, γ∞ = 61.7 meV and E∞ = 18.8 meV. The maximum likelihood (γ, E1s−2p) (Fig. 3b, solid line) matches well with the measurement-based ones (symbols). The calculated temperature-dependent MIR response and the corresponding time shift are based on this phase transition model; its validity is further confirmed by the quantitative agreement with the measured data shown in Fig. 3 and Extended Data Fig. 2.
Polaritonic effects in bulk CrSBr
The excitonic response of CrSBr is exceptionally strong, inherently generating bulk-exciton-polariton resonances27, whose energetics is further controlled by sample thickness through cavity effects. It is important to note that the 2pa/b states are optically dark and, therefore, do not form polaritons. For our 620-nm-thick sample, multiple polariton modes emerge near the 1s-exciton interband resonance. Their photon fraction determines the in-plane dispersion of each polariton (Extended Data Fig. 5a). The lower polaritons (LPs) are located energetically below the 1s state and the upper polaritons (UPs) above the 1s state. Typically, the energy states of the cavity polaritons become more closely spaced as they approach the energy of the bare 1s-exciton resonance. Although polaritonic effects do not qualitatively influence the interpretations discussed in the main text, there are some quantitative corrections. For instance, intraexcitonic transitions exhibit a shift in the E1s−2p resonance energy, which is fully included in the analysis, as discussed above.
Complementary experiments quantifying polaritonic effects
Extended Data Fig. 5b shows the pump-induced change in the MIR absorption (Δα) and the real part of the dielectric function (Δε1) for different pump–probe delay times tpp up to 4 ps and for a pump fluence of ΦNIR = 75 μJ cm–2. At tpp = 0.5 ps, the response is dominated by a maximum in Δα at an energy of 50 meV and a corresponding dispersive feature in Δε1. At later tpp, the resonance peak in Δα experiences a blueshift Δ that saturates at 4 ps and reaches a maximum value of Δ = 10 meV (Extended Data Fig. 5a, yellow arrow). For our pump tuned 215 meV above the 1s-exciton energy, photoexcitation initially creates unbound electron–hole states, which rapidly form higher-lying lower polaritons close to the bare 1s-exciton energy. At early delays, the MIR pulses probe the transition from these states into the 2pb orbital located 50 meV higher in energy (Extended Data Fig. 5a, light-blue arrow). Within 4 ps, the cavity polaritons will gradually relax towards energetically lower-lying LP states and establish a quasi-equilibrium of the momentum and energy distributions of excitons and polaritons (curved arrow), which increases the energy separation from the 2pb state. For 1s–2pb transitions driven by the MIR probe transients, only polariton branches with a sufficiently large excitonic character play a role, corroborating the polaritonic energy shift of Δ = 10 meV, identified above and in the main text.
To further decouple the polaritonic and excitonic effects in CrSBr, we compare the internal structure of the excitons in a bulk and a thin flake of CrSBr. We prepared a flake with a thickness of 20 nm, in which polaritonic hybridization effects are irrelevant, because the optical path length is substantially smaller than the wavelength of NIR light. Extended Data Fig. 5c shows the pump-induced change in the dielectric response of the bulk (dark blue) and the thin film (red and orange) for the same photoexcitation density. For the relatively high pump fluence (ΦNIR = 640 μJ cm–2), chosen for improved signal-to-noise ratio, the renormalization of the resonance energy in the bulk sample towards 62 meV already occurs within a delay time of tpp = 1 ps. By contrast, the 1s–2p transition energy in the thin sample is located at 50 meV for the same pump fluence and does not show any shift with delay time. Since the energy difference (10 meV) between the 1s–2p resonances in the thin and bulk samples exactly matches the ultrafast blueshift Δ in the bulk sample due to polaritonic corrections (compare Extended Data Fig. 5a,b), we can conclude that the thin sample remains unaffected by strong light–matter coupling27. Consequently, the resonance in the thin sample represents the bare 1s–2pb transition of the exciton in contrast to thicker samples requiring polaritonic corrections.
Furthermore, the temperature-dependent 1s–2p transition in the 20-nm-thin sample of CrSBr exhibits similar features as observed in the 620-nm-thick bulk crystal (Extended Data Fig. 5d). In particular, the resonance considerably broadens across the magnetic phase transition like that in the 620-nm-thick sample. The main difference lies in the lower signal-to-noise ratio obtained from the thinner sample and the redshift of the 1s–2p resonance due to the absence of polaritonic effects. For these reasons, the measurements discussed in the main text were recorded on the 620-nm-thick sample.
These findings unequivocally confirm that the bulk crystals of CrSBr induce exciton-polaritons, resulting in a renormalization of the 1s–2p resonance with an energy correction (Δ) of 10 meV at low temperatures. Conversely, at high temperatures, the 1s–2p resonance is primarily influenced by broadening (γ), rendering polaritonic corrections negligible (as discussed above). The measured value of Δ has been validated by calculations based on the transfer matrix formalism.
Fitting of temperature-dependent recombination dynamics of excitons
The decay of the exciton density (Fig. 4a) can be fitted using a biexponential decay function:
Whereas at higher temperatures, we find finite amplitudes for both A1 and A2, A2 vanishes in the low-temperature AFM phase. The corresponding decay constants are shown in Fig. 4b. The fitted amplitudes A1 and A2 are converted into density fractions (Supplementary Section 4 and Fig. 4d). Figure 4 illustrates the ultrafast exciton decay in the absence of a magnetic bias, whereas the corresponding dynamics with a magnetic field of 200 mT along the b axis are depicted in Extended Data Fig. 6. The maximum of the pump-induced change in the MIR field transient, (Delta {E}_{{rm{MIR}}}^{max }), as a function of tpp, exhibits a fast rise across all temperatures, followed by a temperature-dependent decay on the picosecond timescale. At low temperatures, this decay is best fit by a single exponential (A2 = 0) with a time constant of τ1 ≈ 11 ps. As the magnetic order changes (Fig. 4c), a slower-decay component appears. The corresponding intra- and interlayer exciton density fractions are shown in Fig. 4e. Compared with the measurements without an external magnetic field, the slower decay and the corresponding density fraction become apparent at a temperature of T′ = 80 K.
Responses