Serum small extracellular vesicles-derived BST2 as a biomarker for papillary thyroid microcarcinoma promotes lymph node metastasis
Background
Papillary thyroid cancer (PTC) is a common malignant disease of the endocrine system, the incidence of which has risen steadily in recent decades [1]. Papillary thyroid microcarcinoma (PTMC) is defined as a PTC with a maximum diameter of 10 mm or smaller [2]. Owing to the indolent biological behavior and favorable prognosis in most cases, the treatment scheme for PTMC is still controversial. Active surveillance was adopted by the American Thyroid Association (ATA) guidelines as a nonsurgical alternative management method for low-risk PTMC patients in 2015 [3]. Although most PTMCs are inert, a proportion of PTMCs exhibit aggressive clinicopathological characteristics, such as cervical lymph node metastasis (LNM), vascular invasion, extrathyroidal extension, or remote metastasis which necessitate surgical resection to improve patient prognosis. PTC was found to be involved in cervical LNM in 20–50% of patients with metastasis and approximately 90% of patients with micro-metastasis [4,5,6]. Even in the early stage of the disease, PTMC can be transferred to regional lymph nodes, with an incidence of 24.4–64.1% in central lymph nodes and 1.1–44.5% in lateral lymph nodes [7,8,9]. Indeed, it is difficult to determine whether cervical LNM is present in PTMC patients before surgery. Currently, ultrasound is mainly adopted for detecting LNM, with a sensitivity of only 20–38%, which could be helpful for surgical procedures in only 20% of patients [10, 11]. Consequently, a large proportion of metastatic lymph nodes are missed during preoperative imaging, which poses a major obstacle for surgeons in the formulation of treatments for PTMC patients without accurate preoperative judgement of LNM. Therefore, there is a need to fully clarify the molecular mechanism that triggers LNM in PTMC and to discover novel biomarkers for prediction of preoperative LNM in PTMC patients.
Small extracellular vesicles (sEVs) are nanosized particles with lipid bilayer membranes actively released by a variety of cells that enter the circulation and are detectable in serum, plasma, or urine [12]. SEVs contain many functional substances, including nucleic acids, proteins, metabolites, and lipids [13]. Tumor-secreted sEVs participate in the communication between tumor cells and stromal cells in local and distant microenvironments [14]. In addition, sEVs function in primary tumor growth and metastatic evolution and can reprogram stromal cells to support tumor progression, premetastatic niche formation, and subsequent metastasis [15]. Notably, increasing evidence has established that sEVs in body fluids could be utilized as potential biomarkers for tumorigenesis as well as tumor metastasis [16, 17].
Therefore, we conducted a data-independent acquisition (DIA) proteomics technique combined with bioinformatic strategies to compare the protein profiles of serum sEVs purified from patients with benign thyroid nodules, from PTMC patients with LNM, and from PTMC patients without LNM and to discover the biological functions of sEVs in different groups. Proteomic analysis revealed that the serum sEV protein bone marrow stromal cell antigen 2 (BST2) was significantly overexpressed in PTMC patients with LNM. Furthermore, we demonstrated that serum sEV-derived BST2 could promote cancer progression through tumor cell growth, migration, and lymphangiogenesis and might be a clinically useful biomarker for preoperative risk stratification and a novel therapeutic target for PTMC.
Methods
Sample collection and study design
PTMC patients with LNM (LNM, n = 10), PTMC patients without LNM (NLNM, n = 10), and patients with benign thyroid nodules (BN, n = 9) were recruited at Peking Union Medical College Hospital from August 2020 to October 2020. The patients in the BN group underwent hemithyroidectomy or total thyroidectomy, which was confirmed by histological examination. PTMC patients who underwent thyroidectomy were divided into LNM and NLNM groups according to their postoperative pathological results. The following exclusion criteria were applied: (a) systemic or blood system diseases, (b) previous thyroid surgery, or (c) other neoplasms. The sex and age of these three subgroups are matched. The procedure of the study is schematically outlined in Fig. 1.
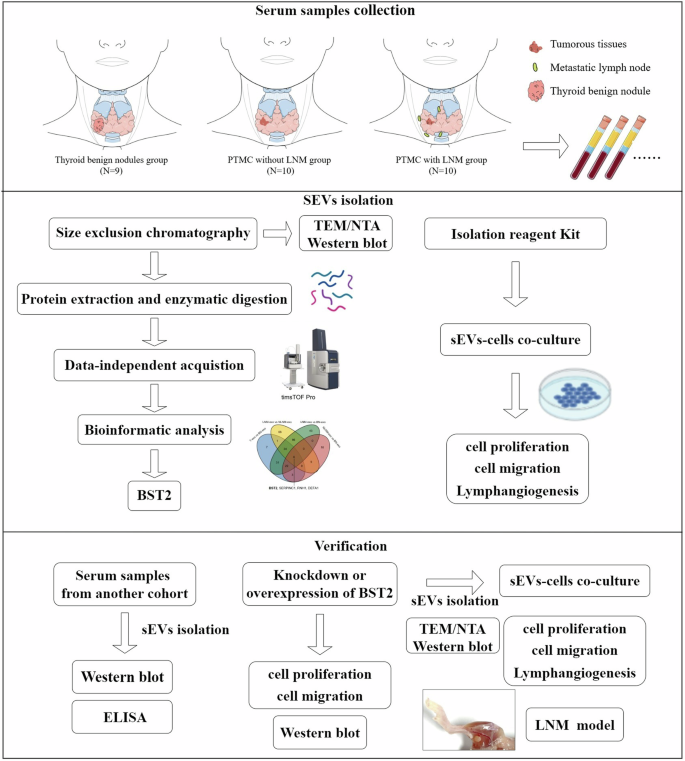
The rectangular frame indicates the analytical procedures and tools employed in this proteomic study (see the “Methods” section for details).
SEVs isolation from serum and medium
The whole blood was collected into serum sep clot activator tubes (Vacuette®, Cat. No. 454067CN). The sample was allowed to clot at room temperature for 30 min and then centrifuged at 3000 × g for 15 min at 4 °C. The upper layer containing the serum was collected and divided into three centrifuge tubes each with 2 mL of serum, and stored at −80 °C until use. The sEVs from the serum samples were isolated via size exclusion chromatography (qEVoriginal, 70 nm, qEV IZONTM, USA) for proteomics analysis and via Total Exosome Isolation Reagent (Cat. No. 4478360, Thermo Scientific, Waltham, MA, USA) following the protocol for the cell and enzyme-linked immunosorbent assay (ELISA) experiments. Additionally, sEVs isolated from pooled serum were used for subsequent cell experiments. The present method meets the Minimal Information for Studies of Extracellular Vesicles (MISEV) 2023 guidelines [13]. We removed the serum sample from storage at −80 °C and the serum sample was kept on ice for the subsequent extraction of sEVs. Specifically, the qEV columns were washed with phosphate-buffered saline (PBS), and 500 μL of each serum sample was loaded on each qEV column. Every 500 μL of effluent was collected as fractions 1–9. According to the manufacturer’s instructions, fractions 7–9 contain the majority of EVs and the subsequent fractions contain a large amount of serum proteins. Fractions 7–9 were used for further experiments. Then, the EV-rich fractions were pooled and loaded in an Amicon Ultra-4 10-k centrifugal filter device (Merck Millipore, Merck) and centrifuged at 4 °C for 15 min at 14,000 × g. The concentrated samples were subjected to upside-down centrifugation at 4 °C for 2 min at 1000 × g. For the Total Exosome Separation Reagent Kit, the serum was diluted with an equal volume of PBS to reduce viscosity, and a 0.2 volume of reagent was added. The mixture was vortexed and incubated at 4 °C for 60 min, centrifuged at 10,000 × g for 10 min, and subsequently dissolved in 200 μL of PBS for subsequent experiments. The sEVs from transfected cell were isolated via ultrahigh-speed centrifugation. After dead cells and other debris were removed via centrifugation at 750 × g and 2000 × g for 10 min, the supernatant was collected and further centrifuged at 10,000 × g for 45 min, followed by filtration via 0.22 μm filters. Then, the supernatant was centrifuged at 100,000 × g for 90 min. Finally, the sEVs were extracted and purified from the precipitate and preserved in PBS. All procedures were carried out at 4 °C. The sEVs were used within 24 h at 4 °C for short-term storage and at −80 °C for long-term storage.
Protein extraction and quantification
The sEVs were lysed by adding lysis buffer (2% sodium dodecyl sulfate [SDS], 7 M urea, with 1× protease inhibitor cocktail) and then sonicated for 1 min. The sEV proteins were incubated on ice for 2 h followed by centrifugation at 12,000 × g for 20 min. Next, six volumes of prechilled acetone at −20 °C were added to the supernatant. The protein was allowed to precipitate overnight at −20 °C, centrifuged at 12,000 × g for 20 min, resuspended in 20 mM Tris, and prepared via the filter-assisted sample preparation (FASP) method [18]. Briefly, the proteins were deoxidized with 20 mM dithiothreitol (DTT) at 95 °C for 5 min and alkylated with 50 mM iodoacetamide (IAA) at room temperature in the dark for 45 min. Then, the proteins were loaded onto a 30 kDa cut-off ultrafiltration unit and centrifuged at 14,000 × g at 4 °C. After being washed three times with 20 mM Tris, the samples were digested with MS-grade trypsin (1:50) at 37 °C overnight. After centrifugation at 12,000 × g at 4 °C for 10 min, the peptide mixture was collected and store at −80 °C for subsequent use.
Liquid chromatography-tandem mass spectrometry (LC‒MS/MS) analysis
LC-MS/MS analysis was applied to analyze purified proteins from the sEV fractions via a TimsTOF Pro mass spectrometer (Bruker Daltonics, Bremen, Germany). Briefly, all the samples were subjected to high-performance liquid chromatography (nanoElute, Bruker Daltonics, USA). All peptides were eluted into analytical columns at 50 °C (1.7 µm beads size C18, IonOpticks, 25 cm × 75 µm) with a linear gradient of 2–35% buffer B (0.1% formic acid in acetonitrile) over 60 min gradient at a constant flow rate (300 nL/min). Peptides were then analyzed via a CaptiveSpray nanoelectrospray source at a voltage of 1.5 kV. The eluted peptides were analyzed on a TimsTOF Pro. TIMS was enabled with a 100 ms ramp time and 100% duty cycle. The ion mobility ranged from 0.75 to 1.4 V s cm−2. We defined up to eight windows for single 100 ms TIMS scans following the m/z-ion mobility plane. The final data were obtained from 16 PASEF MS/MS scans per cycle and acquired from m/z 100–1700.
The DIA-PASEF data files were analyzed via Spectronaut Pulsar X (Biognosys, AG, Schlieren, Switzerland) software. All the results were filtered with a Q-value cut-off of 0.01 (corresponding to a 1% FDR), and the proteins were then determined on the basis of two unique peptides. Peptide intensity was calculated by summing the peak areas of the respective fragment ions for MS2, and protein intensity was calculated by summing the intensities of the individual peptides. The proteomics data have been uploaded to the ProteomeXchange Consortium (http://proteomecentral.proteomexchange.org) via the iProX partner repository with the dataset identifier PXD037205.
Proteomic data analysis and bioinformatics
For proteomics of serum-derived sEVs, a t-test with Benjamini-Hochberg correction for multiple comparisons was used for the analysis of the proteomics data, and a 1.5-fold change was set as the threshold for differentially expressed proteins (DEPs). Orthogonal partial least squares discriminant analysis (OPLS-DA) was performed via SIMCA software (version 14.1, Umetrics, Sweden). Gene Ontology (GO) functional enrichment analyses were conducted via the R program (version 3.5.1, R Foundation for Statistical Computing, Vienna, Austria) via the clusterProfiler package. A false discovery rate (FDR) < 0.05 was set as the threshold for statistical significance in the GO enrichment analysis. All DEPs were imported into Ingenuity Pathway Analysis software (IPA, version 2.3; Qiagen, CA, United States) to analyze pathways, diseases, and functions. The proteins were mapped to the canonical pathways and then ordered on the basis of the P value. The Venn diagram of the DEPs was generated via the Venn software package of the R program.
Data sources and processing
The PTMC cohort from the Gene Expression Omnibus (GEO) database (http://www.ncbi.nlm.nih.gov/gds) was used as the verification cohort. The RNA expression data were downloaded on October 1, 2023. The GSE33630 and GSE65144 datasets were downloaded via the GEOquery package, and processed via the Tidyverse package. The probe was converted via the org.Hs.eg.db package, followed by a half violin diagram drawn via the gghalves package.
Transmission electron microscopy (TEM) and nanoparticle tracking analysis (NTA)
The serum and conditioned media of sEVs were characterized via TEM and NTA. SEV samples (10 μL, 30 μg/mL) were placed on a continuous carbon grid and negatively stained with 2% uranyl acetate. The morphology and size of the sEVs were observed using TEM via a JEM1400 plus (JEOL Ltd., Tokyo, Japan). The original sEVs were diluted and resuspended in PBS for NTA analysis. The concentration and size of the sEVs were examined using NTA with a NanoSight LM10 instrument (Malvern Instruments Ltd, Malvern UK) and Nanoparticle Tracking Analysis 2.0 software.
Cell culture
The human PTC well-differentiated cell line BCPAP (RRID: CVCL_0153) and the poorly differentiated cell line KTC-1 (RRID: CVCL_6300) were obtained from the National Collection of Authenticated Cell Cultures of the Chinese Academy of Sciences. All cancer cells were cultured in RPMI 1640 medium (Invitrogen, Cat. No. 11875-093) supplemented with 10% foetal bovine serum (FBS, fetal bovine serum, Gibco, Cat. No. 10099141), sodium pyruvate (Invitrogen, Cat. No. 11360070), GlutaMax (Invitrogen, Cat. No. 35050061), and nonessential amino acids (Invitrogen, Cat. No. 11140050) in 5% CO2 at 37 °C. Human lymphatic endothelial cells (HLECs, RRID: CVCL_B7U4) was purchased from ScienCell Laboratories and cultured in endothelial cell medium (ECM, ScienCell Research Laboratories, USA) in 5% CO2 at 37 °C.
Cell proliferation and migration
A Cell Counting Kit-8 (CCK8, Solarbio, Cat. No. CA1210) was used to evaluate the proliferation ability of the cells. In brief, BCPAP and KTC-1 cells were cultured in 96-well plates with 180 μL of medium (3 × 10³ cells per well), and sEVs (50 μg/ml) in 20 μL of PBS were added to each well. At each indicated time point (0–96 hours, every 24 hours), 10 μL of CCK8 was added to the medium. After 2.5 hours of incubation, the optical density (OD) was measured at 450 nm and 630 nm by a microplate reader. A transwell chamber (Corning, Cat. No. 3422) was used to measure the cell migration ability. Briefly, BCPAP cells (2 × 10⁴), KTC-1 cells (2 × 10⁴), and HLECs (2 × 10⁴) were seeded in the upper chambers within 100 μL of FBS-free medium, and 600 μL of medium containing 10% FBS was added to the lower layer of the 6-well plates. Then, sEVs (50 μg/ml) in 200 μL of PBS were added to each upper chamber. After being incubated for 24 hours in 5% CO2 at 37 °C, the cells were fixed with formaldehyde and further stained with crystal violet solution. The chambers were photographed with a microscope.
Tube formation assay
A tube formation assay was conducted to evaluate the lymphangiogenesis of HLECs. A total of 4 × 10⁴ HLECs were seeded in a 6-well plate with 2 mL of the medium after the addition of sEVs (50 μg/ml) in 200 μL of PBS. After 24 hours of incubation, the processed HLECs were digested and resuspended in 200 μL of medium. Two hundred microlitres of BD Matrigel (Corning, Cat. No. 356234) were added to the bottom of 24-well plates and incubated in 5% CO2 at 37 °C for 30 minutes. The cell suspensions were seeded on the surface of the Corning Matrigel. After 6 hours of incubation, the medium was removed. The images of the tubes were examined and photographed by a microscope. The total length of the tubes was measured via ImageJ software and the relative values were used for the quantification.
Cell transfection and construction of inducible BST2 in BCPAP cells
Lipofectamine 3000 (Invitrogen, Cat. No. 31985062) and Opti-MEM™ (Invitrogen, Cat. No. 31985062) were used to perform siRNA or plasmid transfection according to the manufacturer’s protocols. A negative control siRNA (GGCUCUAGAAAAGCCUAUGCdTdT) was used. BST2 siRNA (CCTTGATTATCTTCACCAT) and an overexpression plasmid were obtained from Tsingke Biotechnology Co., Ltd. The BCPAP cell line stably expressing BST2 was constructed with BST2 lentivirus (Shanghai Genechem, China). The BCPAP cells were seeded in a 6-well plate and transfected with the lentivirus. After transfection for 48 h, puromycin (2 µg/mL) was used for screening. The efficiency was verified by qPCR and western blotting (WB) assays.
Cell RNA extraction and qRT‒PCR
TRIzol reagent (Invitrogen, Cat. No. 15596-026) was used to extract total cell RNA following the instructions. The concentrations of RNA were measured with a NanoDrop spectrophotometer (NanoDrop Technologies, ND-1000, Wilmington, DE). Complementary DNA was synthesized via the reverse transcription kit (Thermo Fisher, Cat. No. #K1622). Quantitative RT-PCR (qRT-PCR) was conducted with PowerUp SYBR Green Master Mix (Thermo Fisher, Cat. No. A25742). The PCR primers for BST2 were F: CAAGGACAAAAGAAAGTGGAGG and R: CAAGGACAAAAGAAAGTGGAGG. β-actin (Sangon Biotech, Shanghai, China) was used as an internal reference. The relative expression of a gene was calculated via the 2^-ΔΔCt method.
Western blotting
The proteins from the serum-sEVs, cells and conditioned media-sEVs were extracted with RIPA lysis buffer (Beyotime, Cat. No. P0013B). The protein concentration was calculated with a BCA protein assay kit (Thermo Scientific). All the WB experiments were conducted with equal protein quantities (e.g., 20 μg) by BCA quantification, including the sEV samples. The proteins were separated via SDS-PAGE and transferred onto PVDF membranes. The membranes were blocked with 5% milk for one hour and then incubated overnight with primary antibodies. The primary antibodies used were CD9 (1:2000, Abcam, ab92726), CD63 (1:2000, Abcam, ab134045), Alix (1:2000, Proteintech, 12422-1-AP), CD81 (1:2000, Abcam, ab109201), TSG101 (1:2000, Abcam, ab125011), flotillin-1 (1:5000, Abcam, ab133497), calnexin (1:1000, Abcam, ab92726), albumin (1:5000, Proteintech, 66051-1-Ig), BST2 (1:5000, Abcam, ab243230) and APOA1 (1:2000, Proteintech, 14427-1-AP). β-actin (1:10000, Abcam, ab8226) was used as the internal reference. The membranes were further incubated with secondary antibodies for 1 h and visualized with an enhanced chemiluminescence detection kit (Beyotime, Cat. No. P0018S), and photographed with an automatic chemiluminescence image analysis system (Tanon, China). The secondary antibodies used were goat anti-mouse IgG HRP (1:5000, Proteintech, SA00001-1) and goat anti-rabbit IgG HRP (1:2500, Proteintech, SA00001-2).
Enzyme-linked immunosorbent assay (ELISA)
BST2 levels in human serum sEVs collected from patients with BN, NLNM and LNM were quantified via an ELISA kit (Abcam, Cat. No. ab231931) following the manufacturer’s protocol. The sEV samples from BN patients were used as controls. In brief, serum sEVs (50 μg/ml) and the antibody cocktail were transferred to the wells of plates enriched with the primary antibody. After being incubated for 1 h at room temperature, the wells were washed three times. Then, TMB development solution was added to each well, and the samples were incubated for 10 minutes. Finally, the OD was recorded at 450 nm. The protein concentration of BST2 was calculated from the BST2 standard curve.
Popliteal lymph node metastasis assay
To observe the effect of sEV-derived BST2 in vivo, a popliteal lymph node metastasis model was adopted. BALB/c nude mice (4 weeks, male) were purchased from KeyGEN Biotech Co. In brief, 4 × 10⁵ BCPAP cells were injected with 50 μL of control or BST2-enriched sEVs into each footpad. Each group contained 6 mice. These EVs were separated from the culture medium of the vector-transfected BCPAP cells and OE-BST2-BCPAP cells. After 6 weeks, the mice were euthanized, and the popliteal lymph nodes were observed and collected. The volumes of the lymph nodes were calculated as the length × width squared. The lymph node samples were further formalin-fixed, and paraffin-embedded and cut into sections for haematoxylin and eosin (HE) staining and immunohistochemical (IHC) staining. A BST2 polyclonal antibody (1:200, Proteintech, 13560-1-AP) was used to visualize BST2 expression via an IHC assay. IHC staining was analyzed according to the percentage of positive cells and the intensity of each sample. The percentage of positive cells was scored as 1–4 (1 = 1% ~ 25%, 2 = 26% ~ 50%, 3 = 51% ~ 75%, and 4 = 76% ~ 100%). The staining intensity of positive cells was scored as 0–3 (0 = no, 1 = weak, 2 = moderate, and 3 = strong). The final scores were obtained by multiplying the percentage scores and the intensity scores. All experiments were performed under the guidelines of the Institutional Animal Care and Use Committee (Beijing, China).
Experimental statistical analysis
All experimental statistical analyses and data visualization were carried out via SPSS statistics (version 25.0, IBM Corp., Armonk, NY, USA) and GraphPad Prism (version 8.0.2, GraphPad Software Inc, San Diego, USA). Continuous clinical variables are expressed as the means and standard deviations (SDs), and categorical variables are expressed as frequencies and percentages. Comparisons of the selected peptides between groups were analyzed via t-test when appropriate. Receiver operating characteristic (ROC) analyses were adopted to assess the performance of the diagnostic biomarkers. The area under the curve (AUC) was determined for each protein. The Benjamini-Hochberg procedure was used to control the FDR. All experimental data are presented as the means ± SDs. All the statistical comparisons for the animal and cell experiments were performed via an unpaired t-test or analysis of variance (ANOVA). All the experiments were repeated at least three times. Two-sided P < 0.05 was considered statistically significant.
Results
Serum sEVs from PTMC patients promoted cell growth and migration in vitro
The clinicopathologic characteristics of the patients in the study groups are shown in Table 1. Notably, six patients in the LNM group presented enlargement of the lymph nodes according to preoperative ultrasonography, but the other four patients did not, indicating the limitations of ultrasonography. PTMC and LNM were confirmed by postoperative histological evidence. SEVs from BN patients (BN-sEVs, n = 9), PTMC patients without LNM (NLNM-sEVs, n = 10), and PTMC patients with LNM (LNM-sEVs, n = 10) were isolated via size exclusion chromatography. The purified sEVs were characterized (Fig. 2A–C). The morphological characteristics and size of the sEVs were inspected via TEM and NTA. TEM confirmed typical sEV structures, which exhibited saucer-like particle shapes with membranous structures (Fig. 2A). NTA revealed the typical particle size of sEVs from one sample (Fig. 2B). Western blotting was used to characterize these sEVs and observe the stable expression of common sEV-enriched or sEV-deficient marker proteins (CD9, TSG101, CD63, CD81, and calnexin, Fig. 2C). The PTC cell lines BCPAP and KTC-1 were used to investigate the influence of BN-sEVs, NLNM-sEVs, and LNM-sEVs on tumor cell proliferation and migration. CCK-8 analysis indicated that, compared with BN-sEVs, both NLNM-sEVs and LNM-sEVs facilitated the proliferation of BCPAP and KTC-1 cells (Fig. 2D). Compared with BN-sEVs or PBS, NLNM-sEVs and LNM-sEVs significantly promoted the migration of BCPAP, KTC-1, and HLEC cells, and LNM-sEVs had a more powerful effect than NLNM-sEVs did (Fig. 2E, F). Compared with BN-sEVs or PBS, NLNM-sEVs and LNM-sEVs clearly enhanced the tube formation of HLECs. Furthermore, compared with NLNM-sEVs, LNM-sEVs were more effective at promoting the tube formation of lymphatic vessels (Fig. 2F).
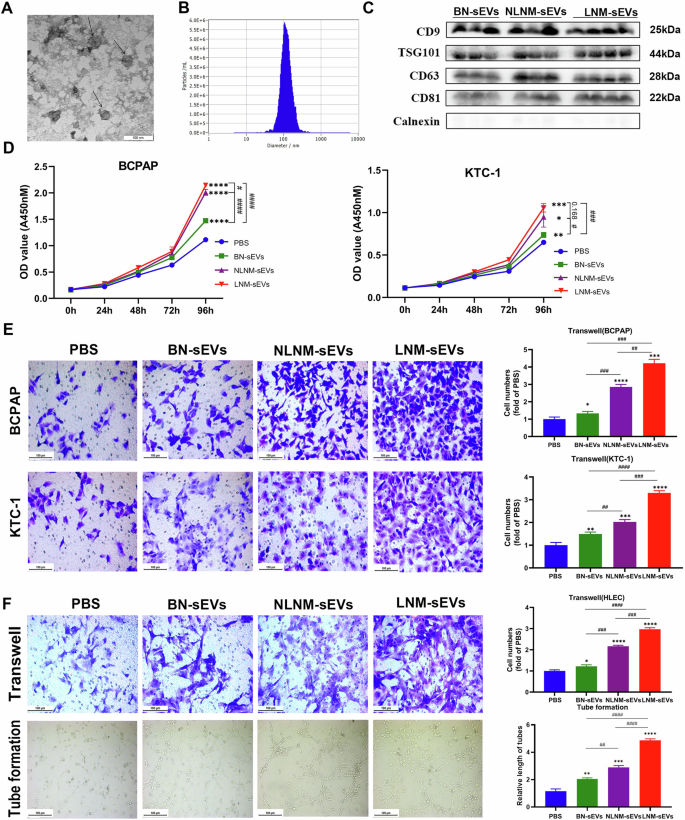
A Transmission electron micrographs (TEM) of sEVs; scale bar: 100 nm. B Representative nanoparticle tracking analysis (NTA) profiles of sEVs from one serum sample. C CD9, TSG101, CD63, CD81, and Calnexin (common sEV-enriched markers) immunoblots of BN-sEVs, NLNM-sEVs, and LNM-sEVs. D After incubation with sEVs (50 µg/ml) and PBS (negative control) for 96 h, the proliferation of PTC cell lines (BCPAP and KTC-1) was measured by cell counting kit-8 assay (*sEVs vs PBS, *P < 0.05, **P < 0.01, ***P < 0.001, ****P < 0.0001; #P < 0.05, ###P < 0.001, ####P < 0.0001). E The cell migration of PTC cell lines (BCPAP and KTC-1) in response to sEVs (50 µg/ml) or negative control was determined. scale bar: 100 µm (*sEVs vs PBS, *P < 0.05, **P < 0.01, ***P < 0.001, ****P < 0.0001; ##P < 0.01, ###P < 0.001, ####P < 0.0001). F The HLEC cell migration and lymph tube formation response to sEVs and negative control are shown. (*sEVs vs PBS, *P < 0.05, **P < 0.01, ***P < 0.001, ****P < 0.0001; ##P < 0.01, ###P < 0.001, ####P < 0.0001); Scale bar: 100 µm. Error bars represent standard deviations.
Tumorous- and BN-derived serum sEVs displayed distinct proteomic profiles
Given the different effects of sEVs from different sources on the phenotypes of cancer and HLEC cells, the protein profiles of sEVs isolated from the serum samples of PTMC patients (PTMC with NLNM and PTMC with LNM) and BN patients were determined. In total, 1,298 proteins with at least two unique peptides were identified in 29 samples (Supplementary Table 1). The score plots of OPLS-DA indicated that LNM, NLNM, and BN could be separated from each other in the model (Fig. 3A). To explore the proteomic profile of carcinogenesis in PTMC, the differences in protein expression between the tumorous and BN groups were studied. On the basis of the threshold of a > 1.5-fold change in sEV proteins, 102 DEPs were identified consisting of 93 upregulated proteins and 9 downregulated proteins (Supplementary Fig. 1A and Supplementary Table 2). To further investigate the molecular mechanisms involved, GO enrichment analyses were performed on 102 DEPs (Supplementary Fig. 1B and Supplementary Table 3). Most DEPs in the biological process category were enriched in wound healing, leukocyte migration, and T-cell migration. According to the cellular component analysis, the top enriched categories were associated with the secretory granule lumen, cytoplasmic vesicle lumen, and collagen-containing extracellular matrix. Molecular function analysis revealed that these proteins were involved mainly in heparin binding, structural constituents of muscle, and molecular adaptor activity. Then, IPA was conducted to explore the biological pathways involved. Numerous signaling pathways, including the phagosome maturation signaling, tight junction signaling, GP6 signaling, integrin signaling, and chemokine signaling pathways, were identified (Supplementary Fig. 1C).
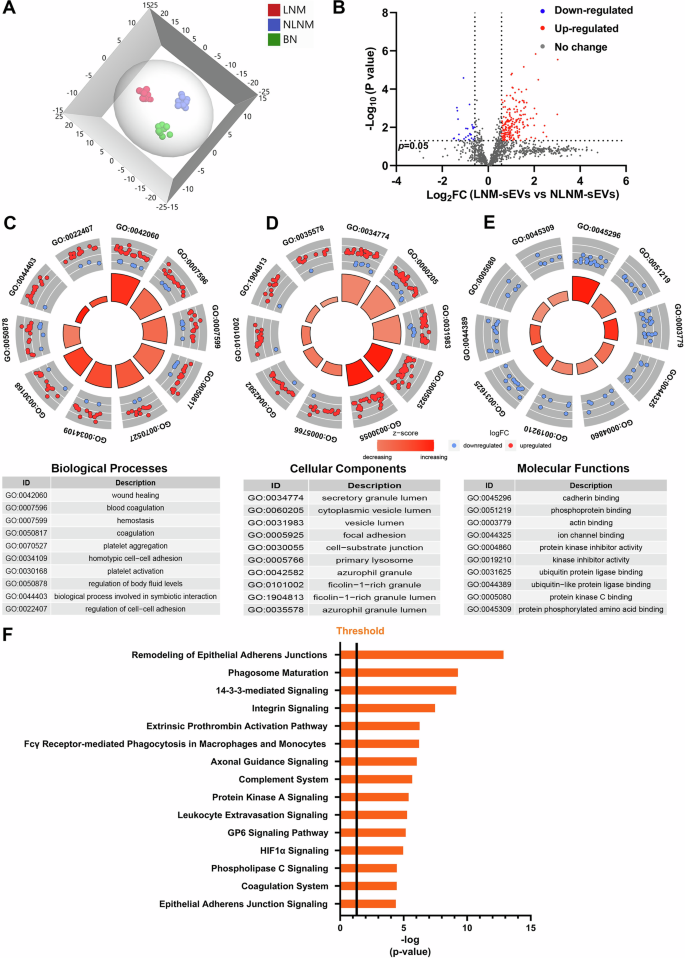
A Orthogonal partial least squares discriminant analysis (OPLS-DA) revealed differences in the proteome profiles among the LNM, NLNM, and BN groups. “LNM” refers to PTMC with lymph node metastasis, “NLNM” refers to PTMC without lymph node metastasis, and “BN” refers to patients with benign thyroid nodules. B Scatter plot showing the distribution of downregulated (blue dots) and upregulated (red dots) differentially expressed proteins (DEPs) between the LNM and NLNM groups. C–E Gene Ontology enrichment analysis of DEPs between the LNM and NLNM groups. The categories of biological processes (BP), cellular components (CC), and molecular functions (MF) are respectively shown. F Annotation and functional characterization of DEPs.
Characteristics of DEPs in serum sEVs between the LNM and NLNM groups
To identify changes in serum sEV proteomics during cancer development, we obtained global protein profiles from the LNM and NLNM groups. A total of 213 DEPs were found (1.5-fold change, P < 0.05), with 188 upregulated proteins and 25 downregulated proteins (Fig. 3B and Supplementary Table 4). Furthermore, GO analysis revealed that these DEPs were primarily associated with the biological processes of wound healing, blood coagulation, and platelet aggregation (Fig. 3C and Supplementary Table 5). These DEPs were associated mainly with the cellular components of focal adhesion, cell-substrate junction, and primary lysosome (Fig. 3D and Supplementary Table 5). Additionally, the DEPs related to molecular function were significantly enriched in the cadherin binding, actin binding, and ubiquitin protein ligase binding categories (Fig. 3E and Supplementary Table 5). IPA was performed to further understand the biological pathways associated with LNM. Several signaling pathways, including remodeling of epithelial adherens junction signaling, integrin signaling, complement system signaling, and GP6 signaling were associated with DEPs (Fig. 3F).
Serum sEV-derived BST2 was correlated with LNM in PTMC
BST2, SERPINC1, RNH1, and DEFA1 were differentially expressed according to all comparisons (Fig. 4A). The AUCs of BST2, SERPINC1, RNH1, and DEFA1 for differentiating PTMC from BN were 0.906, 0.867, 0.878, and 0.844, respectively (Supplementary Fig. 2A–D). Compared with those in the BN group, the levels of these proteins continuously changed in the NLNM and LNM groups (Supplementary Fig. 2E–G). Among the candidate proteins, BST2 was selected for further research because of its relatively high prediction efficiency. Additionally, BST2 was apparently upregulated in both the NLNM-sEV and LNM-sEV groups compared with the BN-sEV group. BST2 expression was also significantly higher in the serum sEVs of PTMC patients with LNM than in those of PTMC patients with NLNM (LNM-sEVs vs. NLNM-sEVs, Fig. 4B), suggesting that BST2 expression is correlated with PTMC metastasis and could serve as a biomarker of metastasis. Western blotting results also confirmed the differential expression of BST2 (Fig. 4C). Additionally, to further determine BST2 levels in serum sEVs during cancer progression, ELISA-based serum sEV BST2 levels were determined in BN (N = 30), NLNM (N = 30) and LNM (N = 30) PTMC patients from our center (validation cohort). BST2 expression was significantly upregulated in the serum of PTMC patients with LNM and without LNM compared to that in BN patients (Fig. 4D). The serum sEV BST2 levels in the PTMC patients with LNM were greater than those in the PTMC patients with NLNM in the validation cohort (Fig. 4D). The AUC value of BST2 in the validation cohort reached 0.803 (95% CI = 0.714–0.892; Fig. 4E). External validation was performed in the GEO cohort. We found that BST2 was highly upregulated in thyroid cancer tissue samples compared with normal tissue samples (Supplementary Fig. 3G). Therefore, BST2 could be a high-performance biomarker for the auxiliary diagnosis of PTMC.
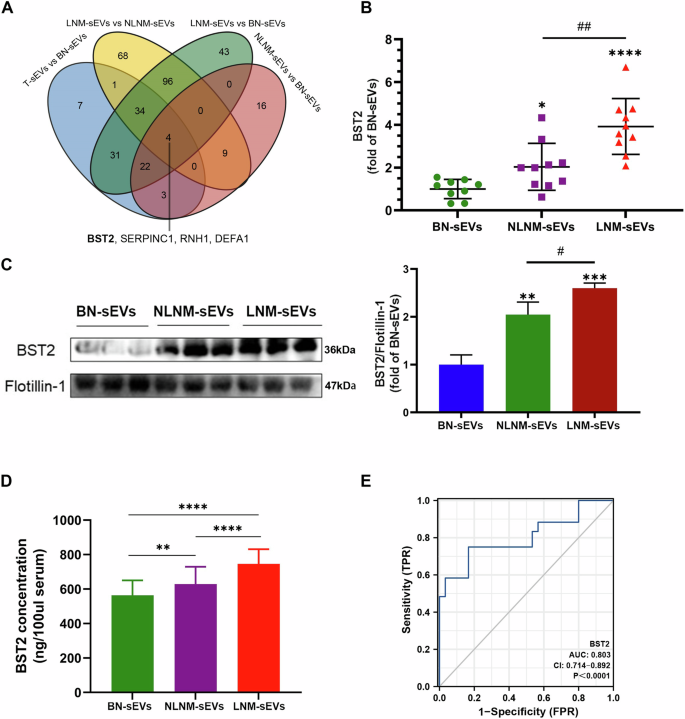
A Venn diagram of differentially expressed proteins from different comparisons. B BST2 levels according to proteomic analysis (n = 10 for NLNM-sEVs and LNM-sEVs; *BN-sEVs vs. other groups, *P < 0.05, ****P < 0.0001; #NLNM-sEVs vs. LNM-sEVs, ##P < 0.01). C Western blot analysis showed BST2 levels in serum sEVs (n = 3 for BN-sEVs, NLNM-sEVs, and LNM-sEVs, *BN-sEVs vs. other groups, **P < 0.01, ***P < 0.001; #NLNM-sEVs vs. LNM-sEVs, #P < 0.05); Flotillin-1 as sEVs protein marker was used as the control. D ELISA results revealed BST2 protein concentrations in serum sEVs of the validation cohort (**P < 0.01, ****P < 0.0001). E ROC curve analysis of the sensitivity, specificity, and AUC of serum sEVs BST2 level in the validation cohort. The T refers to the whole group of PTMC samples (LNM and NLNM). Error bars represent standard deviations.
Cellular and sEV-BST2 promoted the proliferation and migration of PTC cells in vitro
To further explore its function, knockdown and overexpression of BST2 in PTC cell lines (BCPAP and KTC-1) were performed. The efficiency is shown in Supplementary Fig. 3A–F. The CCK-8 assay results revealed a decrease in the proliferative capacity after the knockdown of BST2 and an increase in the proliferative capacity after the overexpression of BST2 in BCPAP and KTC-1 cells (Fig. 5A–C; Supplementary Fig. 4A–C). Transwell assays revealed that cell migration ability was impaired after the knockdown of BST2 and enhanced after the overexpression of BST2 in BCPAP and KTC-1 cells (Fig. 5B–D; Supplementary Fig. 4B–D). We further explored the effect of the sEV BST2 protein. SEVs were separated from the culture medium of BCPAP cells after BST2 was overexpressed and verified via TEM, NTA, and western blot assays (Fig. 5E–G). The levels of EV-positive markers (CD63 and TSG101), an EV-negative marker (calnexin), and serum contaminants (albumin and APOA1) were compared between the serum sEVs and the cell-derived sEVs, as shown in Supplementary Fig. 3H, indicating that they were essentially comparable. BST2-overexpressing sEVs increased the proliferation, migration, and tube formation of HLEC cultures (Fig. 5H–J). SEVs from BST2-knockdown cells also impaired the tube formation ability, cell migration ability, and proliferation of HLECs (Supplementary Fig. 4E–G). These results demonstrated that both cellular and sEV-derived BST2 promoted cancer cell progression and lymphangiogenesis.
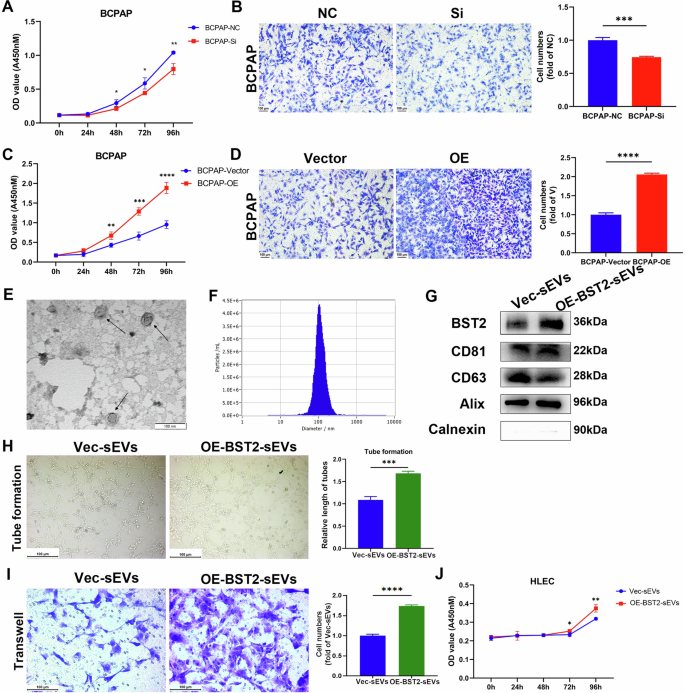
A The proliferation rate of BCPAP cells was downregulated after the knockdown of BST2 (*P < 0.05, **P < 0.01). B The cell migration of BCPAP cells was downregulated after the knockdown of BST2 (***P < 0.001). NC: negative control. C The proliferation rate of BCPAP cells was upregulated after overexpression of BST2 (**P < 0.01, ***P < 0.001, ****P < 0.0001). D The cell migration of BCPAP cells was upregulated after overexpression of BST2 (****P < 0.0001). E, F The morphology and size of BCPAP-derived sEVs were determined by TEM and NTA; scale bar: 100 nm. G SEVs markers CD81, CD63, ALIX, Calnexin, and sEVs BST2 levels were measured using western blot. H Lymph tube formation response to OE-BST2 sEVs is determined (***P < 0.001). I–J The cell migration and proliferation of HLEC cells in response to OE-BST2 sEVs are shown (*P < 0.05, **P < 0.01, ****P < 0.0001). Error bars represent standard deviations.
SEV-derived BST2 promoted the enlargement of PTMC lymph nodes in vivo
For verification, LNM mouse models were generated by injecting BCPAP thyroid cancer cells into the footpad with control sEVs or BST2-enriched sEVs (Fig. 6A). We found that the swelling popliteal lymph nodes were obviously greater in the BST2-enriched sEV group than in the corresponding control group (Fig. 6B, C). HE staining revealed more reactive hyperplasia of the lymph nodes in the BST2-enriched sEV group than in the control group. Furthermore, the immunohistochemistry results revealed a greater proportion of BST2-positive cells in the experimental group than in the control group (Fig. 6D, E).
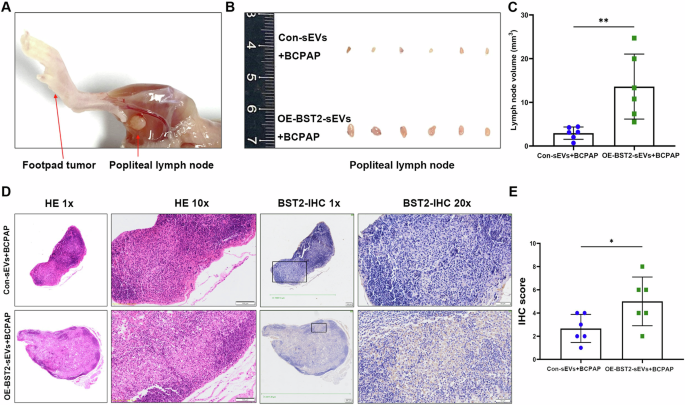
A Representative gross anatomical image of the lower limb of a nude mouse with footpad tumor (left arrow) and metastatic popliteal lymph node (right arrow). B Images of the popliteal lymph nodes in control-sEVs-BCPAP or BST2-sEVs-BCPAP groups (n = 12). C Statistical comparison of the volume of popliteal lymph nodes in each group (n = 12, **P < 0.01). D Representative images of HE staining and BST2 IHC staining for popliteal lymph nodes in each group with different magnifications. Scale bars: 100 μm for the 10 × magnified images and 50 μm for the 20 × magnified images. E The IHC staining was assessed as the sum of the percentage and intensity scores (*P < 0.05). Error bars represent standard deviations.
Discussion
Cancer cell-released sEVs play unique roles in regulating tumor invasion, metastasis, and angiogenesis, indicating that sEVs have great potential for development as clinically relevant diagnostic, prognostic, and therapeutic markers [16, 19]. The identification of novel biomarkers to diagnose PTMC or preoperatively predict LNM could be helpful for more effective clinical management. The present study provides new evidence that serum sEVs from PTMC patients contribute to cancer growth and lymphangiogenesis. Next, differences in sEV-protein expression among BN patients, and PTMC patients with and without LNM were investigated. Elevated BST2 was observed in serum sEVs from PTMC patients, suggesting that circulating sEV-BST2 may serve as a noninvasive biomarker for the auxiliary diagnosis of PTMC. In addition, we verified for the first time that BST2 was highly expressed in serum LNM-sEVs from PTMC patients and could be related to the promotion of lymphangiogenesis and LNM in patients with PTMC. Finally, sEV-derived BST2 apparently promoted lymph node enlargement in mouse model, which indicated that sEV-derived BST2 might contribute to LN metastasis in PTMC patients.
Using direct-DIA proteomics, 1298 credible proteins from 29 samples were identified. The results revealed clear separation of protein profiles among the PTMC with LNM, PTMC with NLNM, and BN groups. The DEPs between the tumorous and BN groups were involved in tight junction signaling, integrin signaling, and chemokine signaling. Tight junctions are multiprotein complexes located at the apical-lateral borders of epithelial cells, that control paracellular permeability and regulate epithelial proliferation and differentiation [20]. CD137 (BST2) was found to maintain physical connections between lipid rafts and apical actin networks in polarized epithelial cells, which matched the signaling of tight junctions [21]. Specific effects on tight junctions have been demonstrated to be integral to cancer progression and key to metastasis [22, 23]. Integrins, a family of heterodimeric cell surface receptors can control cell proliferation, adhesion, and migration [24]. Recent studies have shown that several oncogenes might require integrin signaling for their ability to initiate cancer growth [25]. This property might be exploited therapeutically. Chemokines were initially discovered for their ability to attract immune cells to sites of inflammation. Chemokine signaling may play critical roles in the proliferation, angiogenesis, immune evasion, and metastasis of various cancers [26,27,28,29]. Additionally, chemokine signaling may increase the affinity of cancer cells for endothelial cells and promote blood vessel extravasation and invasion [30]. Taken together, these findings indicate that tight junction signaling, integrin signaling, and chemokine signaling pathways are strongly associated with tumorigenesis in PTMC.
There were significant differences in DEPs between the LNM and NLNM groups. In the GO analyses, the DEPs were enriched mostly in the categories of epithelial-to-mesenchymal transition (EMT)-related proteins, which included wound healing, focal adhesion, cadherin binding, and actin binding. The early events of metastatic dissemination are considered to be initiated by EMT processes in tumor cells, which are similar to our findings. We proposed that DEPs between the LNM and NLNM groups might promote EMT and accelerate distant metastasis. Furthermore, IPA of the DEPs revealed enrichment in the remodeling of epithelial adherens junctions signaling, integrin signaling, complement system signaling, and GP6 signaling pathways. Remodeling of adherens junctions (AJs) in epithelia is key to the development of functional epithelia and is commonly altered during cancer progression and metastasis [31]. AJs are remodeled during epithelial morphogenesis, especially during the EMT process [32]. We surmised that the EMT pathway might play a crucial role in the early events of cancer metastasis in patients with PTMC. Increasing evidence implies that integrin signaling enables tumor cells to detach from neighboring cells and reorientate their polarity during progression from primary tumor growth to metastasis [33, 34]. One study published by Luo et al. reported that integrin signaling was aberrantly activated in PTC patients with LNM compared with those without LNM [35]. Although the study methods, patient populations and groupings differed between these two studies, our results were consistent with these findings. We speculated that the integrin signaling pathway might play key roles in the sEV-mediated metastasis of thyroid cancer. However, this assumption needs to be further studied and verified. Complement activation in the tumor microenvironment not only increases cell proliferation but also may enhance metastasis through the EMT pathway in tumor cells [36]. It was reasonable that the proteins related to complement system signaling were enriched in the LNM group. The GP6 signaling is primarily considered to be involved in endometrial cancer metastasis, which was consistent with our analyses [37]. Overall, we believe that serum sEVs from PTMC patients with LNM can promote tumor dissemination and metastasis.
Mass spectrometry-based proteomics analysis revealed that SERPINC1, RNH1, DEFA1, and BST2, which are potential biomarkers for tumorigenesis and tumor metastasis, exhibited consecutive changes in NLNM and LNM compared with BN. Xu et al. reported that upregulated SERPINC1 could be beneficial in inhibiting hepatocellular carcinoma growth by inducing apoptosis and macrophage polarization [38]. A study by Chen et al. revealed that RNH1 could shape the inflammatory tumor microenvironment and activate immune response cycle steps, which has the potential to predict the response to immune checkpoint blockade therapy [39]. With respect to DEFA1, Xie et al. reported that DEFA1 could promote M1 to M2 macrophage polarization and had indirect beneficial effects on chondrocytes, indicating that DEFA1 might be a promising target for osteoarthritis [40].
BST2, known as CD317 or tetherin, is a type II transmembrane protein induced by interferon. In recent decades, substantial attention has been given to the tumor-promoting role of BST2, which is overexpressed in different malignant tumor, including breast cancer, head and neck cancer, and endometrial cancer [41,42,43,44]. He et al. reported that BST2 could recruit and educate tumor-associated macrophages (TAMs) to the M2 phenotype in colorectal cancer [45]. A previous study also revealed that BST2 regulated by FGD5-AS1 could increase the M1 to M2 macrophage polarization rate in cervical cancer [46]. Both of the abovementioned studies revealed the oncogenic contribution of BST2 to shaping the immunosuppressive microenvironment. Liu et al. demonstrated that BST2 promoted cell proliferation and migration by inducing NF-κB activation in gastric cancer [47]. Increased tumor cell adhesion and resistance to apoptosis are also proved to be associated with BST2 expression [48,49,50]. However, the precise role of BST2 in PTMC has yet to be fully defined. This study revealed that the BST2 protein level was increased in serum sEVs from PTMC patients, and was greater in those from PTMC patients with LNM than in those from patients with PTMC with NLNM. Moreover, in the validation cohort, BST2 was elevated in serum sEVs from PTMC patients with NLNM. We confirmed that both cellular BST2 and sEV-BST2 could enhance cell proliferation and migration, and that BST2-overexpressing sEVs could stimulate HLEC lymphangiogenesis. A recent study published in Cell revealed that BST2 expressed on the cell membrane and serves as a cancer-specific T-cell receptor (TCR) in multiple types of cancer. These findings suggest that BST2 may be present on the cell membrane in our study and may be encapsulated in the EV membrane [51]. Therefore, circulating sEV-BST2 could be a promising biomarker indicating the occurrence and progression of PTMC. However, the mechanism of action of sEV-BST2 in PTMC progression is not yet clear.
Although we discovered a valuable sEV-protein biomarker for the auxiliary diagnosis and risk stratification of PTMC, several limitations exist. First, the current EV-samples are insufficient. Further studies are ongoing to collect the serum sEVs of PTMC patients for verification from multiple centers and the serum sEVs of PTMC patients before and after surgery to determine the origin of BST2-EVs. Second, the impact of BST2 on signaling pathways and the underlying mechanisms need further research to enhance our comprehensive understanding of the molecular networking of PTMC. Animal experiments are also needed for further validation. Third, sEV-BST2 could be overexpressed in different malignancies. However, owing to the predominantly low-grade malignant behavior and certain imaging characteristics of thyroid tumors, distinguishing thyroid cancer from other types of malignancies from a clinical perspective is easy.
Conclusion
In summary, the proteomic profiles of serum sEVs from PTMC patients with LNM differ from those of serum sEVs from PTMC patients without LNM. We confirmed that the protein level of BST2 in serum sEVs changed during tumor progression, which indicated that the BST2 protein in serum sEVs could be a potential biomarker for the auxiliary diagnosis of PTMC and the preoperative prediction of LNM. Furthermore, serum sEV-BST2 can promote tumor progression and lymphangiogenesis, which might spur the development of novel prevention and treatment strategies against LNM in patients with PTMC.

Responses