Nasal anti-CD3 monoclonal antibody ameliorates traumatic brain injury, enhances microglial phagocytosis and reduces neuroinflammation via IL-10-dependent Treg–microglia crosstalk
Main
Traumatic brain injury (TBI) is a leading cause of death and disability, with both direct and indirect costs1,2,3. TBI is implicated in long-term morbidity, including motor deficits, cognitive decline and long-term medical comorbidities and neurodegeneration4,5,6. Current treatments primarily focus on early surgical intervention to limit hematoma expansion and supportive therapy; however, there are few pharmacological interventions to reduce long-term cognitive sequelae post-injury7,8,9,10. TBI induces a primary mechanical injury followed by a secondary biochemical and cellular response which contributes to neurological impairment11. Critically, neuroinflammation is one of the key mechanisms implicated in both the acute and the chronic phases of TBI12 and, as such, has been identified as an important and potentially modifiable driver of secondary injury in both animal and human studies13,14,15,16,17,18,19. TBI drives secondary injury via the activation of resident microglia, induction of cytokine release and recruitment of circulating monocytes or lymphocytes to the CNS, which further amplifies pathological inflammation11,20. Despite the clear clinical implications, no treatment specifically targets this neuroinflammatory process, partly as the result of the largely unknown molecular and cellular mechanisms that lead to neurological deficits after TBI20,21. Therefore, identifying new therapies to address chronic CNS inflammation after TBI represents an important unmet need.
FoxP3+ regulatory T cells (Treg cells) represent a crucial subset of CD4+ T cells that modulate and limit adherent inflammatory responses22. There is a growing body of evidence showing that FoxP3+ Treg cells play a critical role in maintaining immune homeostasis and suppressing immune responses in several acute23,24 and chronic neurological diseases25,26. Experimentally, the depletion of FoxP3+ Treg cells in mice with controlled cortical impact (CCI) injuries leads to increased T cell infiltration, enhanced reactive astrogliosis and exacerbated motor deficits27. Conversely, expanding CD4+ FoxP3+ Treg cells through IL-2 treatment has been shown to improve outcomes in animal models of TBI28. In humans with TBI, the level of CD4+CD25+FoxP3+ Treg cells positively correlates with clinical outcomes29. Together, these studies suggest that inducing Treg cells is a promising approach for the treatment of TBI.
The mucosal immune system is a unique tolerogenic organ that provides a physiological method for inducing Treg cells and is clinically appealing as a result of its apparent lack of toxicity. Our laboratory has investigated the induction of Treg cells by the nasal administration of anti-CD3 monoclonal antibody (aCD3 mAb) and has shown the ameliorating effects of nasal aCD3 in both autoimmune30 and CNS models of disease, including models of progressive multiple sclerosis (MS)31 and Alzheimer’s disease32. Based on this, we investigated whether nasal aCD3 could influence outcomes in relevant TBI models by modulating both systemic and local CNS immune responses.
Accordingly, we demonstrated that nasal aCD3 induces FoxP3+ Treg cells, which ameliorate TBI by modulating CNS innate immunity, enhancing microglia phagocytosis and improving neuropathological and behavioral outcomes post-injury in an IL-10-dependent manner. These findings highlight a new immune-based approach for treating TBI and potentially other types of acute brain injury.
Results
Nasal aCD3 mAb improves cognitive and motor outcomes after TBI
To investigate the therapeutic effect of nasal aCD3 in TBI, we employed the CCI model of TBI, which is known for its accuracy and reproducibility33, to recapitulate features of moderate-to-severe TBI features, including cerebral contusion, neuroinflammation, blood–brain barrier (BBB) dysfunction and long-term behavioral outcomes. We investigated the therapeutic effects of nasal aCD3 on motor and behavioral outcomes in male mice treated at different times after injury: immediate (4-6 h post-injury), early (3 d post-injury) and delayed (14 d post-injury) (Fig. 1a). Treatment was continued once daily for 7 d, then 3× weekly for up to 1 month after injury (Fig. 1a). In the immediate treatment group, we found improvement in motor function and coordination assessed by the rotarod test (Fig. 1b). Using the Morris water maze (MWM) test, TBI mice treated with aCD3 exhibited near-complete restoration of spatial memory and increased time spent in the target quadrant during the probe trial (Fig. 1b) compared with isotype-treated TBI mice. In addition, we found that male mice treated with immediate nasal aCD3 exhibited less anxious behavior, using the open field test. We found a similar beneficial effect with early treatment (3 d post-injury), except for anxiety (Extended Data Fig. 1a).
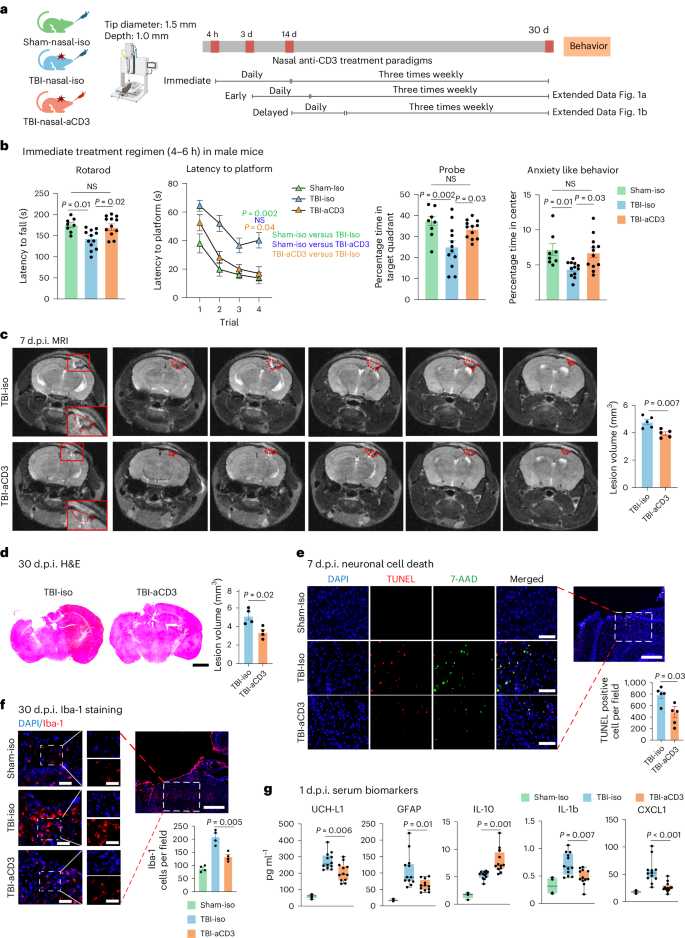
a, Experimental timeline schematic for treatment regimens (created with BioRender.com). b, Behavioral testing (rotarod, MWM test, probe trial, open field for anxiety-like behavior) in the immediate treatment group (sham-iso n = 8, TBI-iso n = 12, TBI-aCD3 n = 12). The MWM test was analyzed by two-factor, repeated-measure, two-way ANOVA (group × time) and others by one-way ANOVA with Tukey’s multiple comparisons. Data are shown as mean ± s.e.m. c, MRI lesion volume 7 d post-TBI (TBI-iso n = 5, TBI-aCD3 n = 5), analyzed by two-sided, unpaired Student’s t-test. Data are shown as mean ± s.e.m. The red dashes indicate the lesion area. d, Lesion volume from H&E-stained brain sections 30 d post-TBI measured with ImageJ (TBI-iso n = 4, TBI-aCD3 n = 4), analyzed by two-sided, unpaired Student’s t-test. Data are shown as mean ± s.e.m. Scale bars, 1,000 µm. e, Immunofluorescence of neuronal death 7 d post-TBI at pericontusional cortex (DAPI, blue; TUNEL, red; 7-AAD, green). Scale bars, 200 µm (500 µm for zoomed out). TUNEL-positive cells were quantified using ImageJ (TBI-iso n = 5, TBI-aCD3 n = 5) and analyzed using two-sided, unpaired Student’s t-test. Data are shown as mean ± s.e.m. f, Immunofluorescence of Iba-1 at 30 d post-TBI in pericontusional cortex (DAPI, blue; Iba-1, red). Scale bars, 200 µm (500 µm for zoomed out). Iba-1+ cells quantified using ImageJ (sham-iso n = 4, TBI-iso n = 4, TBI-aCD3 n = 4), analyzed by one-way ANOVA with Tukey’s multiple comparisons. Data are shown as mean ± s.e.m. g, Serum biomarkers 1 d post-TBI measured by Quanterix SiMoA and V-Plex proinflammatory assays (sham-iso n = 4, TBI-iso n = 12, TBI-aCD3 n = 12), analyzed by one-way ANOVA with Tukey’s multiple comparisons. Data are shown as box plots (min., max., interquartile range (IQR), median). d.p.i., d post-injury; NS, non-significant. All data represent biological replicates from two independent experiments.
We then investigated the effect of delayed (14 d post-injury) nasal aCD3 treatment on behavioral outcomes in male mice and found no improvement in the treated the group compared with the TBI-iso control (Extended Data Fig. 1b). In addition to male mice, we investigated the effects of immediate nasal aCD3 treatment on TBI in female mice. We did not find notable differences in motor or spatial memory testing between the groups after moderate CCI. As reported in the literature, female rodents may outperform males in behavioral tasks after brain injury34,35,36. Thus, we were unable to demonstrate the beneficial effect of nasal aCD3 treatment in female mice at this injury level (Extended Data Fig. 1c).
We then investigated the effect of nasal aCD3 treatment on behavioral outcomes in a more severe form of TBI (3 mm tip diameter and 1.5 mm depth) in both male and female mice. We found improvement in motor function and coordination in the TBI-aCD3 group when compared with TBI-iso control in both sexes (Extended Data Fig. 1d,e). There was partial restoration in spatial memory and increased time spent in the target quadrant during the probe trial in the nasal aCD3-treated mice compared with TBI-iso control in both sexes. Male mice treated with nasal aCD3 exhibited less anxiety-like behavior after severe TBI, but we were unable to assess the beneficial effects of nasal aCD3 in female mice because they did not develop an anxiety phenotype after severe TBI (Extended Data Fig. 1d,e). These data clearly demonstrate that nasal aCD3 improves behavioral outcomes in moderate and severe CCI-induced TBI, with a greater effect being observed in male mice.
Nasal aCD3 mAb ameliorates TBI neuropathology
TBI induces BBB disruption, edema, neuronal death and tissue loss, in addition to the increased production of inflammatory mediators and gliosis20. Therefore, we assessed the effects of nasal aCD3 on these neuropathological outcomes (Fig. 1a). We first measured the parenchymal lesion volume in sham-iso, TBI-aCD3 and TBI-iso groups at 7 d post-injury, using 3-tesla magnetic resonance imaging (MRI). We found a reduction in lesion volume in the nasal aCD3-treated group compared with TBI-iso controls (Fig. 1c and Extended Data Fig. 2a). We also measured lesion volume at 1 month post-CCI using hematoxylin and eosin (H&E) staining and, consistent with the MRI, we found a reduction in lesion volume in TBI-aCD3 mice compared with the TBI-iso control (Fig. 1d). Nasal aCD3 also improved BBB integrity at 3 d post-injury compared with the TBI-iso control (Extended Data Fig. 2b). The percentage of brain edema in the ipsilateral and contralateral hemispheres at 3 d post-CCI was reduced in the ipsilateral hemisphere for the TBI-aCD3 group compared with the TBI-iso control (Extended Data Fig. 2c). CCI increased cell death, as measured by TUNEL staining at 7 d after brain injury (Fig. 1e), which was reduced in nasal aCD3 treatment compared with TBI-iso controls. Consistent with previous reports, we found that CCI was associated with an increase in microglia or macrophage activation (Iba-1 staining) at 30 d post-injury compared with sham-iso controls (Fig. 1f)20,37. We found that there was a reduction in microgliosis at 30 d post-injury in male mice in both the immediate and the early nasal aCD3 groups (Fig. 1f and Extended Data Fig. 2d). Of note, TBI has also been associated with changes in serum biomarkers38 and we found a reduction in several TBI serum biomarkers in the immediate nasal aCD3 group, including glial fibrillary acidic protein (GFAP), UCH-L1 and the inflammatory cytokines IL-1b and CXCL1 versus controls. It is interesting that we also found an increase in the anti-inflammatory cytokine IL-10 in the immediate nasal aCD3 group versus control animals (Fig. 1g). These markers could be used to assess the efficacy of treatment in humans. As in male mice, we found that nasal aCD3 reduced lesion volume (Extended Data Fig. 2e) and microgliosis at the lesion site in female mice after severe TBI (Extended Data Fig. 2f). These data clearly demonstrate that the behavioral improvements observed in TBI mice treated with nasal aCD3 are associated with enhanced tissue integrity, as indicated by neuropathology and serum biomarkers.
Nasal aCD3 mAb expands central and peripheral Treg cells after TBI
TBI is associated with major changes in the cellular kinetics of both resident and infiltrating cells, which contribute to brain injury. Therefore, to characterize the effect of nasal aCD3 on TBI, we investigated the temporal roles of specific immune cell populations post-injury20. We performed flow cytometry analysis on immune cells isolated from cervical lymph nodes (cLNs), meninges and the ipsilateral hemisphere at multiple time points post-TBI. We found that the immediate treatment of nasal aCD3 increased the percentage of total CD4+ T cells and CD4+FoxP3+ Treg cells in cLNs at 1 d (Extended Data Fig. 3a) and increased the total number of those in the meninges at 2 d post-injury (Fig. 2a,b). Nasal aCD3 also expanded the total number of CD4+ T cells in the brain at 3 and 7 d post-injury and increased CD4+FoxP3+ Treg cells in the first 30 d post-injury compared with TBI isotype controls (Fig. 2a,b and Extended Data Figs. 3a and 4a). Of note, we did not observe an increase in CD4+ T cells expressing latency-associated peptide (LAP), a membrane-bound transforming growth factor β (TGF-β) compared with the TBI-iso group (Fig. 2c and Extended Data Figs. 3b and 4a). Thus, nasal aCD3 expands Treg cells to control neuroinflammation after TBI.
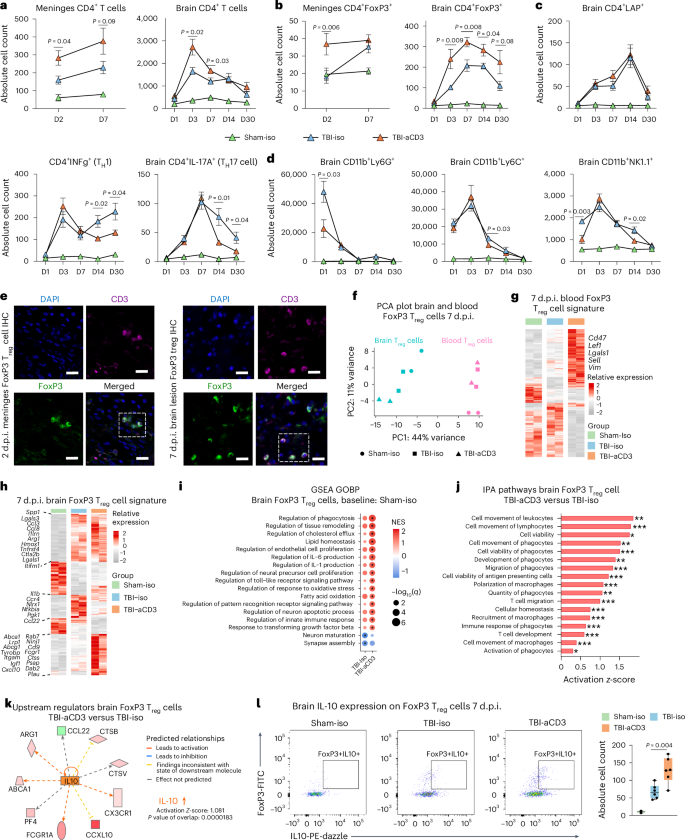
a,b, Flow cytometry analysis and quantification of CD4+ (a) and CD4+FoxP3+ (b) Treg cells in the meninges and ipsilateral hemisphere at 1, 3, 7, 14 and 30 d (D) after TBI and treatment. c, Quantification of CD4+ subsets at the same time points. d, Analysis of CD11b+-infiltrated cells across these intervals. Groups included sham-iso (n = 4), TBI-iso (n = 6) and TBI-aCD3 (n = 6). Data are analyzed by one-way ANOVA with Tukey’s multiple comparisons for every individual timepoint. Data are shown as mean ± s.e.m. representing biological replicates from two independent experiments per timepoint for a–d. e, Immunofluorescence of meninges (2 d post-TBI) and brain (7 d post-TBI) samples from FoxP3-GFP mice with DAPI (blue), CD3 (pink), FoxP3 (green). Scale bars, 100 µm. IHC, immunohistochemistry. f, PCA plot of brain and blood Treg cells 7 d post-TBI. Brain and blood samples are pools of 5 mice and sham-iso brain samples are pools of 20 mice. Due to the low number of FoxP3⁺ cells recruited to the brain and ethical considerations, we limited the study to two biological replicates, following practices from previous studies in the field23. Despite this limitation, the consistent and robust results observed support the validity of our findings. g,h, Heatmaps of DEGs from blood (g) and brain (h) Treg cells at 7 d post-TBI using DESeq2 (FDR-corrected P < 0.05, n = 2 pooled samples per group). i, GSEA of GOBP 7 d post-TBI for brain Treg cells. The asterisks indicate enriched terms (q < 0.05). NES, normalized enrichment score. j, IPA analysis of DEGs from brain Treg cells in TBI-aCD3 versus TBI-iso using DESeq2 analysis (two-sided Wald’s test, FDR-corrected P < 0.05). One-sided Fisher’s exact test was used: *P < 0.05, **P < 0.01, ***P < 0.001. Results with FDR-corrected P < 0.05 were selected. k, Predicted upstream regulators using IPA for TBI-aCD3 versus TBI-iso. l, Quantification of FoxP3+IL-10+ Treg cells in the ipsilateral hemisphere 7 d post-TBI. Groups included sham-iso (n = 4), TBI-iso (n = 6) and TBI-aCD3 (n = 6). Data are shown as box plots (min., max., IQR, median), analyzed by one-way ANOVA with Tukey’s multiple comparisons. Data are from biological replicates and represent two independent experiments.
Nasal aCD3 mAb modulates the innate and adaptive immune response after TBI
Nasal aCD3 also reduced the number of CD8+ cells at 14 and 30 d and helper T cells (TH1 and TH17 cells) at day 30 post-injury (Fig. 2c and Extended Data Figs. 3b and 4a). In addition, we found a significant reduction in neutrophil recruitment at day 1, monocytes at day 7 and natural killer cells at days 1 and 14 after CCI in the nasal aCD3 group compared with the TBI-iso controls (Fig. 2d and Extended Data Figs. 3c and 4b,c).
Treg cells induced by nasal aCD3 have a unique immunomodulatory profile
As shown in Fig. 2b, nasal aCD3 increased CD4+FoxP3+ Treg cells in the first 30 d post-injury compared with TBI isotype controls (Fig. 2b). To elucidate the mechanisms whereby aCD3-induced Treg cells may have contributed to post-TBI recovery, we performed RNA sequencing (RNA-seq) analysis on CD4+FoxP3(GFP)+ Treg cells isolated from both the pericontusional brain tissue and blood of the sham and injured mice 7 d after CCI (Fig. 2f–k, Extended Data Fig. 5a and Supplementary Table 1). Principal component analysis (PCA) showed that the transcriptomic profile of brain FoxP3 Treg cells was markedly different from blood FoxP3 Treg cells after TBI (Fig. 2f). Consistent with recent reports23, we found increased expression of multiple immunomodulatory and trophic factor genes (Il10, Spp1, Gas6, Igf1, Dab2, Lif, Areg, Il1r2, Irf8, Osm, Tgfa, Ccl8, and Hmox1) in brain-infiltrating Treg cells from TBI mice compared with blood Treg cells from sham mice (Extended Data Fig. 5b).
We first examined the effects of TBI and nasal aCD3 treatment on blood FoxP3 Treg cells (Fig. 2g, Supplementary Table 1). We found that FoxP3 Treg cells isolated from nasally treated aCD3 TBI mice had a unique transcriptomic signature with upregulation of several genes involved in Treg cell proliferation and homeostasis (Cd47 (ref. 39), Ndfip1 (ref. 40), Cd2 (ref. 41)) and Treg cell function (Lef1 (ref. 42), Lgals1 (ref. 43) and Runx1 (ref. 44)). Ingenuity pathway analysis (IPA) revealed IL-10 as a top activated upstream regulator in blood aCD3-induced FoxP3 Treg cells compared with TBI-iso FoxP3 Treg cells along with other transcription factors relevant for Treg cell development and function (Foxo3 and Foxo4)45 (Extended Data Fig. 5c). Notably, both Foxo4 and Stat3 have been reported to regulate IL-10 transcription in CD4+ Treg cells46.
We then examined the effects of TBI and nasal aCD3 treatment on brain-infiltrating Treg cells (Fig. 2h and Supplementary Table 1). We found both TBI groups (treated and untreated) had upregulated genes enriched in immune regulation (Spp1, Lgals3, Arg1, Ccl3, Ccl8, Hmox1, Ctsl, Lgals1, and Il1rn) (Fig. 2h). In addition, nasal aCD3-induced Treg cells had further increased expression of genes involved in immunomodulation (Lrp1, Tyrobp, Cxcl10, and Itgam), regulation of phagocytosis (Rab31 and Rab7), neurotrophic factors (Igf1 and Psap), lipid homeostasis (Abca1 and Lpl) and other genes required for Treg cell immunosuppressive function (Dab2 (ref. 47), Plau48 and Lgmn49). Gene set enrichment analysis (GSEA) and IPA revealed enrichment of biological pathways involved in migration, regulation of immune response, phagocytosis, neurogenesis, homeostasis and secretory functions in brain TBI-aCD3-FoxP3 Treg cells compared with brain sham-iso controls (Fig. 2i) and TBI-iso-FoxP3 Treg cells (Fig. 2j). Similar to blood FoxP3+ Treg cells, IPA identified IL-10 and Stat3 among the most activated upstream regulators of Treg cells in the brain of TBI mice treated with nasal aCD3 (Fig. 2k and Extended Data Fig. 5d). The IL-10–Stat3 axis has been reported as playing a role in the immune tolerance conferred by Treg cells50; consistent with this, flow cytometry analysis of brain Treg cells showed upregulation of IL-10 expression in aCD3-treated animals compared with TBI-iso controls (Fig. 2l). Taken together, these findings demonstrate that peripheral and central Treg cells possess unique immunomodulatory profiles associated with the amelioration of TBI via nasal aCD3 treatment.
Nasal aCD3 mAb modulates the microglial inflammation after TBI
Microglia play a critical role in TBI pathogenesis and their adherent activation contributes to long-term functional deficits after TBI20. Nasal aCD3 treatment increased the migration of FoxP3+ Treg cells to the meninges and CCI lesion site (Fig. 2e), where they were found to be in close contact with microglial dendrites after injury (Fig. 3a). Thus, to further elucidate the effects of TBI and immediate nasal aCD3 treatment on the microglial inflammatory profile post-injury, we performed RNA-seq analysis on sorted microglial single-cell suspensions from the ipsilateral hemisphere of the mouse brains, using the microglia-specific 4D4+ antibody51 (Extended Data Fig. 6a) at 7 and 30 d post-CCI (Fig. 3b and Supplementary Table 2). In analyzing the highest expressed genes in the sham-iso, TBI-iso and TBI-aCD3 microglial groups, we found that multiple microglial genes, including Cx3cr1, Hexb and Tmem119, were among the highest expressed (Extended Data Fig. 6b). A heatmap of the microglial gene signature demonstrated that the TBI-iso and TBI-aCD3 groups had overall similar transcriptomic profiles at 7 d, yet with demonstration of early upregulation of anti-inflammatory genes such as Cx3cr1, CD33, Hspa1a, and Hspa1b, whereas there was a clear modulation of the microglial transcriptomic signature in TBI-aCD3 group toward the sham-iso phenotype at 30 d post-injury (Fig. 3c and Supplementary Table 2), including the downregulation of microglial proinflammatory genes (Il6, Il18, Cd36, Ifitm3, and Lgals1) and upregulation of key homeostatic genes (Tgfbr2, Adgrg1, Mertk, Rhob, Atp8a2, Abcc3, Fscn1, Pde3b, Inpp4b, and Cmklr1).
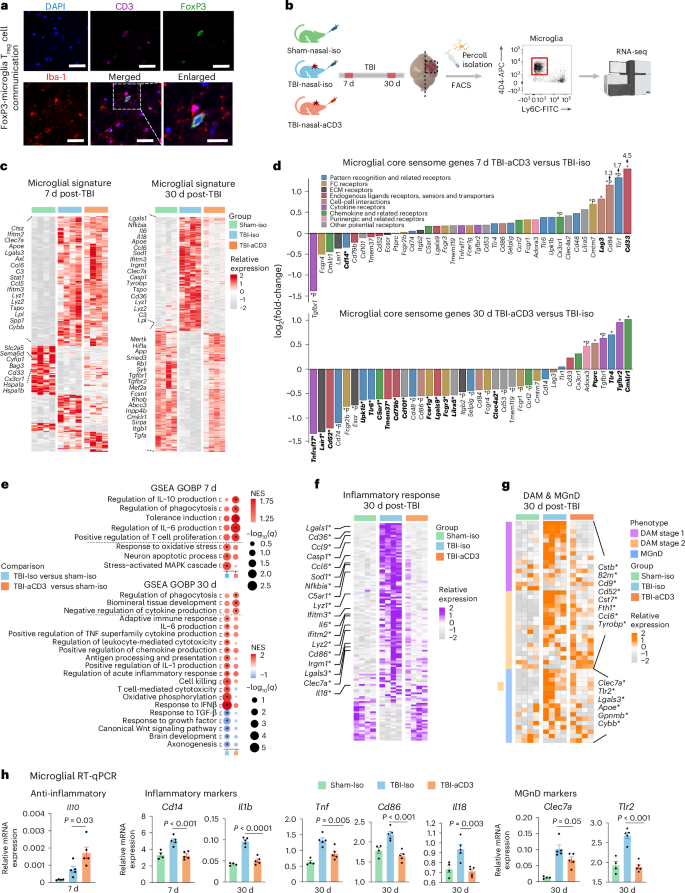
a, Immunofluorescence of ipsilateral brain lesion (7 d post-TBI) from FoxP3-GFP mice for DAPI (blue), CD3 (pink), FoxP3 (green) and Iba-1 (red) showing FoxP3 Treg cells in close proximity to Iba-1. Scale bars, 100 μm and 50 μm for the enlarged image. b, Experimental timeline schematic for microglial bulk RNA-seq at 7 and 30 d after TBI and treatment (created with BioRender.com). c, Heatmap of DEGs from microglia at 7 and 30 d post-TBI identified using DESeq2 analysis (two-sided LRT, n = 4 mice per group, FDR-corrected P < 0.05). d, Microglial core sensome genes at 7 and 30 d in TBI-aCD3 versus TBI-iso. Genes are colored by their function53,107,108. Emboldened DEGs have an asterisk: FDR-corrected P < 0.05; *P < 0.05 (DESeq2 analysis, two-sided Wald’s test, n = 4 mice per group). e, GSEA of GOBP at 7 and 30 d post-TBI based on the following pairwise comparisons: TBI-iso versus sham-iso and TBI-aCD3 versus sham-iso; the asterisk indicates enriched terms (q-value < 0.05). NES, normalized enrichment score. f, Heatmap of genes involved in inflammatory response from microglia at 30 d post-TBI. Genes identified with an FDR-corrected P < 0.05 using DESeq2 analysis are indicated by an asterisk (two-sided LRT, n = 4 mice per group). Genes were identified from the GOBP term inflammatory response as well as microglial inflammatory genes89. g, Heatmap of DAM and MGnD genes at 30 d post-TBI. Genes identified with an FDR-corrected P < 0.05 using DESeq2 analysis are indicated by an asterisk (two-sided LRT, n = 4 mice per group). Genes were identified based on the previous work of our group and others51,61. h, RT–qPCR of microglia sorted from the ipsilateral hemisphere at 7 and 30 d post-TBI. Expression was normalized to glyceraldehyde 3-phosphate dehydrogenase (GAPDH) and presented relative to that of sham-iso animals (sham-iso n = 4, TBI-iso n = 5, TBI-aCD3 n = 5), analyzed by one-way ANOVA with Tukey’s multiple comparisons. Data are shown as mean ± s.e.m. All data are biological replicates and represent two independent experiments.
Microglia possess a unique transcriptomic signature that enables them to perform sensing, homeostatic and housekeeping functions, which vary according to the brain’s physiological or pathological state52. To determine the effects of TBI and nasal anti-CD3 on these essential microglial functions, we examined the microglial sensome dataset for genes and pathways involved in each of these functions53. At 7 d post-TBI, we found that microglia from the nasal aCD3-treated group, compared with TBI-iso, were associated with increased expression of homeostatic and sensing genes involved in pattern recognition receptors (Tlr1), Fc receptors (Cmtm7), Siglec receptors (Cd33), cell–cell interaction (Cd84 and Lag3) and chemokine receptors (Cx3cr1) (Fig. 3d). Cd33 and Lag3 were among the most significantly differentially expressed genes (DEGs) in the TBI aCD3-treated group compared with TBI-iso control at 7 d post-injury. CD33 activity has been implicated in processes including microglial endogenous ligand receptors and sensors, adhesion processing of immune cells and inhibition of cytokines release by monocytes54,55. Lymphocyte activation gene-3 (Lag3) regulates T cell expansion and limits the duration and intensity of the immune response56. Moreover, the TBI aCD3-treated group exhibited downregulation of Cd14, a key regulator of microglial proinflammatory responses to injury57. At 30 d post-injury, we found that nasal aCD3 treatment was associated with increased expression of several transforming growth factor β (TGF-β)-signaling genes, including Smad3, Tgfbr1 and Tgfbr2 compared with TBI-iso control (Fig. 3c,d and Supplementary Table 2)58. TGF-β is required for maintaining the microglial homeostatic state59 and modulating microglia-mediated inflammation after acute brain injury60. Nasal aCD3 treatment was also associated with decreased expression of sensing genes involved in cytokine receptor (Tnfrsf17), FC receptor (Fcgr1, Fcgr4, Fcgr3, and Fcer1g) and pattern recognition receptors (Cd74, Tlr6, Upk1b, and Selplg) compared with TBI-iso control (Fig. 3d).
We then performed GSEA comparing the TBI groups with sham-iso controls at 7 and 30 d post-injury. At 7 d post-injury, we observed an upregulation in pathways involved in oxidative stress and neuron apoptosis in the TBI-iso group compared with the sham-iso group. The TBI-aCD3-treated animals had less upregulation of genes in these pathways and more upregulation in microglial pathways involved in the regulation of anti-inflammatory IL-10 production, phagocytosis and tolerance induction at 7 d post-injury (Fig. 3e). At 30 d post-TBI, we found enrichment of pathways involved in proinflammatory mechanisms (IL-6, IL-1 and tumor necrosis factor production), adaptive immune response, T cell cytotoxicity and cell killing pathways in the TBI-iso control compared with the sham-iso group. However, TBI-aCD3-treated animals had less upregulation of genes in these proinflammatory pathways and more upregulation in biological pathways involved in regulation of phagocytosis and cytokine production (Fig. 3e).
Previous studies have suggested an association between microglia-mediated chronic inflammation after TBI and subsequent chronic neurodegeneration20,52. To investigate this relationship, we analyzed the expression levels of inflammatory response genes and genes characteristic of disease-associated microglia (DAMs)61 and neurodegenerative microglia (MGnDs)51 in all three groups at 30 d post-injury. We found that the TBI-iso microglia had a unique proinflammatory response (Fig. 3f) and a DAM or MGnD signature (Fig. 3g), because we found increased expression of key proinflammatory (Casp1, Nfkbia, C5ar1, Lyz1, Ifitm3, Il6, Lyz2, Cd86, and Irgm1), DAM-1 and -2 genes (B2m, Cstb, Cd52, Cd9, Cst7, Fth1, Ccl6, and Tyrobp) and MGnD microglial genes (Cybb, Gpnmb, Lgals3, and Clec7a)51,61. Importantly, several of these genes were downregulated in nasal aCD3-treated mice, approaching expression levels observed in the sham group (Fig. 3f-g).
Consistent with the microglial transcriptomic data, quantitative PCR with reverse transcription (RT–qPCR) from ipsilateral hemisphere sorted microglia (Fig. 3h) and brain tissue (Extended Data Fig. 6c) revealed that, compared with the TBI-iso control, nasal aCD3 treatment increased the expression of the anti-inflammatory cytokine Il10 in both microglia and brain tissue at 7 d post-injury. Moreover, treatment reduced several proinflammatory markers in microglia (Clec7a, Tlr2, Il1b, Tnf, Cd86, and Il18) and brain tissue (Il6, Tnf, Ifng, Il17a, and Ccl5) at 30 d post-injury. Of note, mice treated with nasal aCD3 showed upregulation of brain-derived neurotrophic factor (Bdnf), a neurotrophin that has a critical role in neuronal survival and is involved in synaptic plasticity, learning and memory62, compared with the TBI-iso control, at 1 month post-injury (Extended Data Fig. 6c).
To further investigate whether delaying the therapeutic window of nasal anti-CD3 to 3 d post-injury would still modulate the microglial transcriptomic profile at 30 d post-injury, we performed bulk RNA-seq on isolated microglia from mice treated with nasal aCD3 or isotype control from day 3 to day 30 (early treatment) post-injury (Supplementary Table 2). We found that the early treatment paradigm also modulated the microglial transcriptomic signature in the TBI-aCD3 group toward the sham-iso phenotype (Extended Data Fig. 6d) and was associated with decreased expression of several proinflammatory and DAM or MGnD genes (Lpl, Lyz1, Nfkbia, Irgm1, Lyz2 and Apoe) (Extended Data Fig. 6e). Consistent with this, GSEA analysis revealed that the early nasal aCD3 treatment paradigm was also associated with downregulation in several inflammatory response and immune response-related pathways compared with TBI-iso (Extended Data Fig. 6f). In line with these results, RT–qPCR of ipsilateral brain tissue demonstrated a reduction in several proinflammatory genes including Il6, Il18 and Tnf in TBI-aCD3 compared with TBI-iso controls (Extended Data Fig. 6g).
To assess the effect of nasal aCD3 treatment on microglia inflammation in female mice after severe TBI, we performed bulk RNA-seq on sorted microglia at 30 d post-injury (Supplementary Table 2). We found a similar therapeutic effect in female mice with the TBI-aCD3 microglial transcriptomic profile reverting to that of sham mice, associated with a reduced inflammatory and DAM or MGnD profile relative to TBI-iso mice controls (Extended Data Fig. 6h,i). RT–qPCR of ipsilateral brain tissue showed consistent findings (Extended Data Fig. 6j). Taken together, these findings demonstrate that nasal aCD3 shifts microglia from a pathogenic, disease-associated phenotype to a beneficial, homeostatic phenotype.
Nasal aCD3 increases microglia phagocytosis in an IL-10-dependent manner
Acute brain injury leads to neuronal cell death and the release of substantial amounts of myelin and cell debris, which subsequently trigger a persistent and intense inflammatory response that may impede neurological recovery. Microglia and macrophages play an important role in debris removal and modulating the immune response post-injury20. However, uncontrolled phagocytosis may lead to progressive brain damage and worsening cognitive and memory impairments63. We found that TBI-aCD3-treated animals had increased upregulation in biological pathways involved in regulation of phagocytosis (Fig. 3e) and a distinct upregulated phagocytic signature at 7 d post-injury (Fig. 4a), with increased expression of several key microglial phagocytosis regulators at 30 d post-TBI, including Mertk64, Sirpa65 and Tlr4 (ref. 66), compared with TBI-iso microglia (Supplementary Table 2). To functionally assess the phagocytic capacity of microglia after TBI (with and without nasal aCD3 treatment), we performed an in vivo experiment in which the TBI-induced lesion was injected with either labeled apoptotic neurons or phosphate-buffered saline (PBS) on day 6 post-injury for 16 h and on day 7 post-injury for 4 h post-injection experiments (Fig. 4b). In line with our microglial transcriptomic data, aCD3-treated animals had higher microglial phagocytic capacity to uptake apoptotic neurons at both 4 and 16 h post-injection compared with the TBI-iso group (Fig. 4c,d and Extended Data Fig. 7a,b). To elucidate the mechanism by which nasal aCD3 enhanced microglial phagocytic capacity after TBI, we performed bulk RNA-seq on phagocytic and nonphagocytic microglia isolated at 4 and 16 h post-injection from TBI-iso and TBI-aCD3 groups at 7 d post-TBI (Supplementary Table 3). At 4 h post-injection, we observed a distinct microglial transcriptomic signature for phagocytic TBI-aCD3 microglia, characterized by the upregulation of several key phagocytosis genes (Fig. 4e). Compared with nonphagocytic TBI-iso microglia, phagocytic TBI-aCD3 microglia were associated with increased expression of genes involved in the recognition and engulfment (eat me and find me signals) of apoptotic cells and debris (Mertk67, Mrc1 (ref. 68), Abca1 (ref. 67), Lrp1 (ref. 67), and Stab1 (ref. 69)), digestion and degradation of engulfed material including lysosomal machinery (Rab27a70, Smcr8 (ref. 71), Clec16a72, and Vps8 (ref. 73)), lipid metabolism (Apoc1 (ref. 74), Olr1 (ref. 75) and Ldlr76), cytoskeleton dynamics pathways (Myo1e77) and regulation of microglial phagocytosis (Tspo78, Qk79 and Pik3cg80) (Fig. 4e,f and Supplementary Table 3). Consistent with these findings, GSEA analysis of phagocytic TBI-aCD3 microglia compared with nonphagocytic TBI-iso microglia showed enrichment for pathways involved in phagocytosis, along with other pathways pertinent for the phagocytic process such as endocytosis, pattern recognition and cell migration, all of which were not upregulated in the phagocytic TBI-iso microglia (Fig. 4g). In addition, compared with phagocytic TBI-iso microglia, phagocytic TBI-aCD3 microglia had increased upregulation of antigen presentation and IL-10 pathways (Fig. 4h). IPA analysis revealed IL-10 as a top regulator and signaling pathway in aCD3-treated phagocytic microglia post-TBI (Fig. 4h,i). We found a similar pattern of increased expression of phagocytosis machinery-related genes and pathways at 16 h post-injection (Extended Data Fig. 7c) and also observed that phagocytic TBI-aCD3 microglia had a more homeostatic and a less inflammatory (disease-associated) profile compared with phagocytic TBI-iso microglia (Extended Data Fig. 7d,e and Supplementary Table 3).
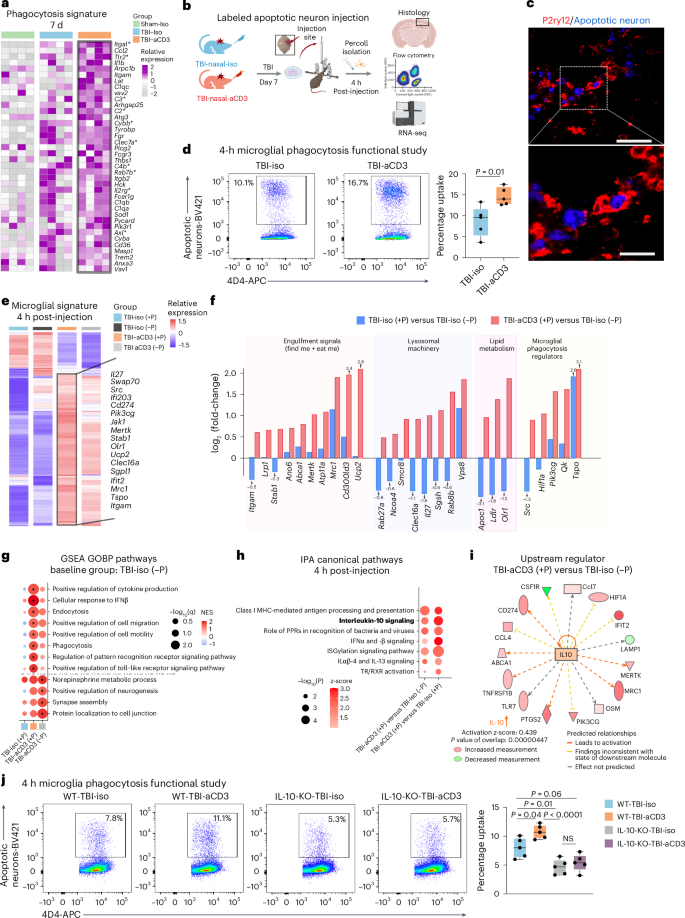
a, Heatmap of microglial phagocytosis genes 7 d after TBI. Genes identified with FDR-corrected P < 0.05 using DESeq2 analysis are indicated by an asterisk (two-sided LRT, n = 4 mice per group). Genes were identified from the GOBP term phagocytosis and microglial phagocytosis genes51,61. b, Schematic presenting a phagocytosis functional study (created with BioRender.com). c, Immunofluorescence of lesion (7 d post-TBI) for apoptotic neurons (blue) and P2ry12 (red) showing engulfment of apoptotic neurons by P2ry12. Scale bars, 100 μm and 50 μm for the enlarged image. d, Phagocytosis experiment where mice were injected with labeled apoptotic neurons and sacrificed 4 h post-injection. The gating strategy shows phagocytic positive microglia and data are shown as box plots (min., max., IQR, median) and n = 5 mice per group were used. Data were analyzed by two-sided, unpaired Student’s t-test. e, Clustered heatmap of DEGs of aggregated samples for phagocytic (+P) and nonphagocytic (−P) microglia 7 d post-TBI and 4 h post-injection of apoptotic neurons identified using DESeq2 analysis (two-sided LRT, n = 3-4 mice per group, FDR-corrected P < 0.05). f, Bar plots with log2(fold-changes) of genes from e pertinent to microglial phagocytosis and related functions in the following comparisons: TBI-iso (+P) versus TBI-iso (−P) and TBI-aCD3 (+P) versus TBI-Iso (−P). g, GSEA analysis of GOBP 7 d post-TBI and 4 h post-injection of apoptotic neurons based on pairwise comparisons: TBI-iso (+P) versus TBI-Iso (−P), TBI-aCD3 (+P) versus TBI-Iso (−P) and TBI-aCD3 (−P) versus TBI-Iso (−P). The asterisk indicates enriched terms (q-value < 0.05). h, Selected top canonical pathways from IPA analysis of DEGs in phagocytic TBI-aCD3 microglia compared with phagocytic and nonphagocytic TBI-iso microglial groups at 7 d post-TBI and 4 h post-injection of apoptotic neurons. i, Predicted upstream regulator in TBI-aCD3 (+P) versus TBI-iso (−P). j, Phagocytosis experiment with similar design to b. Data are shown as box plots (min., max., IQR, median) and n = 5 mice per group were used. The data were analyzed by one-way ANOVA with Tukey’s multiple comparisons. All data are biological replicates and represent two independent experiments.
To investigate the role of IL-10 in the regulation of microglia phagocytic capacity after TBI, we repeated the in vivo microglia phagocytosis assay using IL-10 knockout (KO) mice (Fig. 4j). We found that the increased phagocytic capacity of TBI-aCD3 microglia at 4 h post-injection was significantly attenuated in the IL-10 KO TBI-aCD3 microglial group. Collectively, these findings demonstrate that nasal aCD3 treatment increases the phagocytic machinery of microglia after acute TBI, in an IL-10-dependent manner. In addition, we found that the phagocytic capacity of wild-type (WT) TBI-iso microglia was significantly reduced in the IL-10 KO TBI-iso microglia group, demonstrating the importance of IL-10 in microglial phagocytic function after TBI.
Nasal aCD3 ameliorates TBI outcomes via IL-10/IL-10R signaling in microglia
IL-10 is a potent anti-inflammatory cytokine produced by Treg cells that acts on many cell types as a result of the presence of IL-10 receptor (IL-10R) on almost all hematopoietic cells81. IL-10 signaling is critical to maintain microglia under a homeostatic phenotype, because genetic depletion of IL-10 under proinflammatory conditions results in increased release of proinflammatory cytokines and chemokines82. We found a clear upregulation of the microglial IL-10-cytokine gene expression signature in TBI-aCD3 microglia group at 7 days post-CCI as compared to Sham-Iso and TBI-Iso controls (Fig. 5a). We also found that nasal aCD3 induced IL-10-secreting Treg cells (from day 3 to day 30 post-injury) (Fig. 5b and Extended Data Fig. 8a) and increased IL-10 expression in both microglia and brain tissue derived from the site of injury (Fig. 3h and Extended Data Fig. 6c). We then investigated whether IL-10 played a role in the beneficial effects of nasal aCD3 by administering anti-IL-10R (aIL-10R)-blocking antibody intraperitoneally (i.p.) every 3 d post-injury (Fig. 5c) and investigating the behavioral outcomes and BBB disruption in sham-iso, TBI-iso, TBI-aCD3 and TBI-aCD3+aIL-10R groups. We found that the improvements in BBB disruption (Fig. 5d) and motor coordination functions, spatial memory and anxiety-like behavior observed in TBI-aCD3 were abrogated by blocking IL-10R (TBI-aCD3+aIL-10R group) (Fig. 5e).
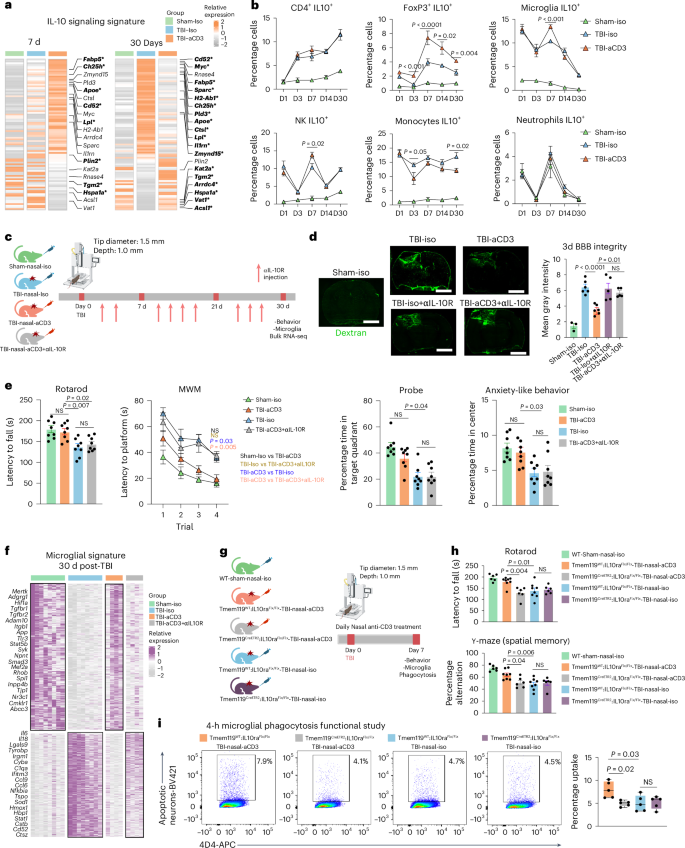
a, Heatmap of genes of aggregated samples involved in the IL-10 pathway for microglia at 7 and 30 d post-TBI. Genes identified with an FDR-corrected P < 0.05 using DESeq2 analysis are emboldened and indicated by an asterisk (two-sided LRT, n = 4 mice per group). Genes were identified from the literature109. b, IL-10 expression (flow cytometry) in different cells at different time points post-TBI and treatment in the ipsilateral hemisphere (sham-iso n = 4, TBI-iso n = 6, TBI-aCD3 n = 6), analyzed by one-way ANOVA with Tukey’s multiple comparisons for individual time points. Data are shown as mean ± s.e.m. NK, natural killer cell. c, Experimental timeline of anti-IL-10R-blocking mAbs (aIL-10R) (created with BioRender.com). d, Dextran 70-kDa (green) for measurement of BBB permeability (3 d post-TBI). Scale bars, 1,000 μm. Data are shown as mean ± s.e.m. (sham-iso n = 3, n = 6 for the rest of the groups), analyzed by one-way ANOVA with Tukey’s multiple comparisons. e, Behavioral testing (rotarod, MWM, probe trial, OF for anxiety-like behavior). The MWM was analyzed by two-factor, repeated-measures, two-way ANOVA (group × time) and the others by one-way ANOVA with Tukey’s multiple comparisons. Data are shown as mean ± s.e.m. (n = 8 mice per group). f, Clustered heatmap DEGs at 30 d post-TBI identified using DESeq2 analysis (two-sided LRT, n = 4–8 mice per group, FDR-corrected P < 0.05). The microglial data at 30 d post-TBI from Fig. 3c were integrated. g, Experimental timeline for the microglia-specific IL-10ra KO (created with BioRender.com). h, Behavioral testing of rotarod and Y-maze assessed between the groups. Data are shown as mean ± s.e.m. (WT sham-nasal-iso n = 6, Tmem119WT:IL-10raFlx/Flx-TBI-Nasal-aCD3 n = 8, Tmem119CreETR2:IL-10raFlx/Flx-TBI-Nasal-aCD3 n = 6, Tmem119WT:IL-10raFlx/Flx-TBI-nasal-iso n = 8, Tmem119 CreETR2:IL-10raFlx/Flx-TBI-nasal-iso n = 6). Analysis was by one-way ANOVA with Tukey’s multiple comparisons. i, Phagocytosis experiment with a similar design to Fig. 4b. Data are shown as box plots (min., max., IQR, median; n = 5 mice per group), analyzed by one-way ANOVA with Tukey’s multiple comparisons. All data are biological replicates and represent two independent experiments.
We next investigated the impact of blocking IL-10R on the microglial inflammatory transcriptomic profile by performing RNA-seq on sorted microglia from the ipsilateral hemisphere of the brain (Extended Data Fig. 6a) at 1 month post-CCI (Fig. 3b and Supplementary Table 4). We found that the modulatory effect of nasal aCD3 on microglia was abrogated by blocking IL-10 as shown in the microglial heatmap signature (Fig. 5f). At 1 month post-CCI, similar to the transcriptomic signature of TBI-iso control, microglia from the TBI-aCD3+aIL-10R group had a more proinflammatory profile compared with sham-iso and the TBI-aCD3 group and was associated with decreased expression of homeostatic markers such as Mertk, Tgfbr2, Atp8a2, and Adgrg1 (Fig. 5f and Supplementary Table 4).
We hypothesized that the beneficial effect of the Treg cells induced by nasal aCD3 was dependent on IL10R signaling in microglia. We thus investigated this hypothesis by using IL-10Rflox/floxTmem119CreETR2 conditional and tamoxifen-induced KO mice and littermate controls (Extended Data Fig. 8b). We investigated the effects of microglial IL-10R ablation on the behavioral and microglial phagocytic capacity at 7 d post-TBI (Fig. 5g). We found that tamoxifen-treated TBI-aCD3-IL-10Rflox/floxTmem119CreETR2 mice exhibited worse motor and cognitive outcomes (Fig. 5h) and reduced microglial phagocytic capacity (Fig. 5i) compared with tamoxifen-treated TBI-aCD3 littermate controls, further supporting the role for IL-10 in modulating the microglial gene signature after nasal aCD3 treatment. Taken together, these data clearly demonstrate a critical role for IL-10/IL-10R signaling in augmenting microglial phagocytic capacity and ameliorating disease in TBI.
Nasal aCD3-induced CD4+FoxP3+ Treg cells ameliorate neuroinflammation and TBI outcomes
In the days to weeks after TBI, lymphocytes appear at the lesion site and both effector T cells and Treg cells infiltrate the injured brain83,84,85,86. We found that nasal aCD3 expanded FoxP3+ Treg cells at the injury site from day 3 to day 30 post-injury compared with the TBI-iso controls (Fig. 2b) and that nasal aCD3 improved behavioral and neuropathological outcomes of TBI by decreasing microglial inflammation (Figs. 1b and 3c). Thus, we next investigated whether these beneficial outcomes were dependent on Treg cells by employing multiple experimental approaches including adoptive transfer experiments (discussed here) and an ex vivo Treg cell–microglia transwell co-culture system and Treg cell depletion experiments (discussed below). In the experiments involving adoptive transfer, we found that the adoptive transfer of CD4+FoxP3+ Treg cells from aCD3-treated mice improved motor function and coordination and restored spatial memory when compared with mice that received either CD4+FoxP3+ Treg cells from TBI-iso mice or CD4+ T cells depleted of Treg cells from anti-CD3-treated mice at 7 d post-TBI (Fig. 6b). We then performed RNA-seq on microglia isolated from the ipsilateral hemisphere of TBI-aCD3-FoxP3+, TBI-iso-Foxp3+ and TBI-aCD3-FoxP3− green fluorescent protein (GFP) groups at 7 d post-TBI (Supplementary Table 5). We found that TBI-aCD3-FoxP3+ microglia had a distinct transcriptomic profile when compared with other groups (Fig. 6c). GSEA analysis comparing TBI-aCD3-FoxP3+ microglia with TBI-aCD3-FoxP3− microglia demonstrated that the TBI-aCD3-FoxP3+ microglia were associated with downregulation of several proinflammatory pathways including interferon (IFN)γ and IFNα (Fig. 6d). IPA revealed IL-10Ra as one of the top activated upstream regulators and IL-1b as one of the top inhibited upstream regulators in TBI-aCD3-FoxP3+ microglia compared with TBI-aCD3-FoxP3− microglia (Fig. 6e). IFNγ was one of the most downregulated regulators in TBI-aCD3-FoxP3+ microglia compared with TBI-iso-FoxP3+ microglia (Fig. 6f,g). Consistent with the microglial transcriptomic data, RT–qPCR of TBI-aCD3-FoxP3+, microglia from the lesion site showed reduction in proinflammatory cytokines (Inf-γ, Cd14 and Tnf) and increased expression of homeostatic (Cd206) and anti-inflammatory cytokines (such as Il10) compared with the two other groups studied (Fig. 6h). Importantly, we also found that adoptive transfer of CD4+FoxP3+ Treg cells from aCD3-treated mice increased microglial phagocytic capacity at 7 d post-injury compared with the two other groups (Fig. 6i). The microglial phagocytic capacity was also increased in mice that received CD4+FoxP3+ Treg cells from TBI-iso-mice compared with mice that received FoxP3− cells from aCD3-treated mice, indicating the importance of CD4+FoxP3+ Treg cells in increasing microglial phagocytic function after TBI.
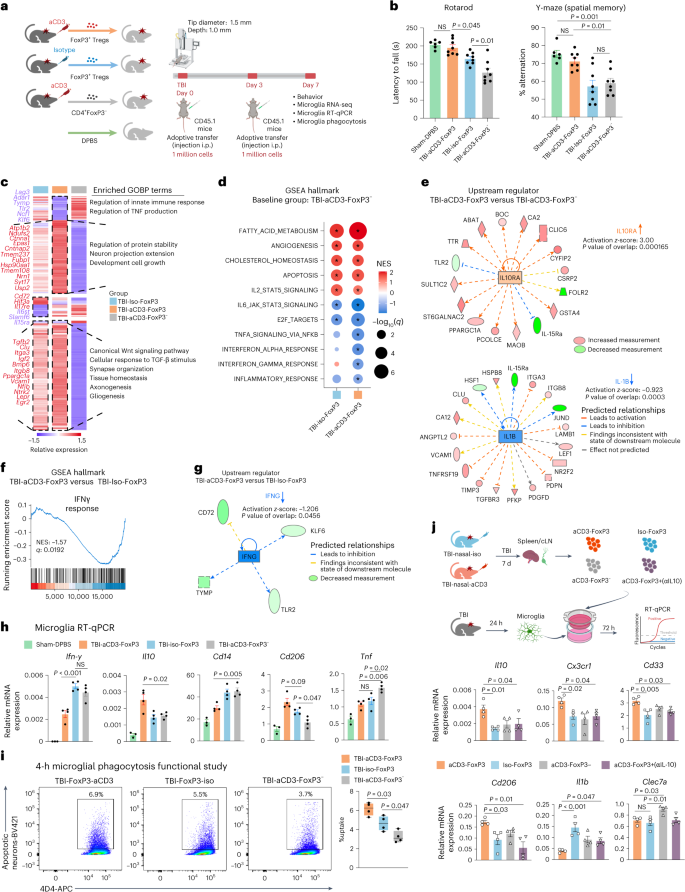
a, Experimental timeline of adoptive transfer (created with BioRender.com). b, Behavioral testing of rotarod and Y-maze assessed. Data are shown as mean ± s.e.m. (sham-DPBS n = 6, TBI-aCD3-FoxP3 n = 8, TBI-iso FoxP3 n = 8, TBI-aCD3-FoxP3− n = 8) and analyzed by one-way ANOVA with Tukey’s multiple comparisons. c, Clustered heatmap of unique and shared DEGs of aggregated samples from microglia at 7 d post-TBI on the following comparisons: TBI-iso FoxP3 versus TBI-aCD3-FoxP3− and TBI-aCD3-FoxP3 versus TBI-aCD3-FoxP3−. Clusters were functionally annotated using enriched GOBP terms (q-value < 0.05). DEGs were identified using DESeq2 analysis (two-sided Wald’s test, n = 3 mice per group, FDR-corrected P < 0.05). d, GSEA analysis of Hallmark pathways at 7 d post-TBI for the following: TBI-iso FoxP3 versus TBI-aCD3-FoxP3− and TBI-aCD3-FoxP3 versus TBI-aCD3-FoxP3−. The asreisk indicates enriched terms (q-value < 0.05). e, Predicted upstream regulators (IPA analysis) in TBI-aCD3-FoxP3 versus TBI-aCD3-FoxP3−. f, GSEA analysis of Hallmark pathways comparing TBI-aCD3-FoxP3 versus TBI-iso FoxP3. g, Predicted upstream regulator (IPA analysis) in TBI-aCD3-FoxP3 versus TBI-Iso FoxP3. h, RT–qPCR of microglia sorted from the ipsilateral hemisphere 7 d post-TBI. Expression was normalized to GAPDH and presented relative to sham-DPBS mice. Data are shown as mean ± s.e.m., n = 3–4 mice per group and analyzed by one-way ANOVA with Tukey’s multiple comparisons. i, Phagocytosis experiment with similar design to Fig. 4b. Data are shown as box plots (min., max., IQR, median), n = 4 mice per group and analyzed by one-way ANOVA with Tukey’s multiple comparisons. j, Schematic representing microglia and Treg cell transwell co-culture (created with BioRender.com). Microglia were isolated 24 h post-TBI and cultured with FoxP3 Treg cells from either nasal aCD3 or isotype-treated TBI mice for 7 d. j, RT–qPCR of microglia, expression normalized to GAPDH. Data are shown as mean ± s.e.m., n = 4 conditions per group and analyzed by one-way ANOVA with Tukey’s multiple comparisons. All data and conditions are biological replicates and represent two independent experiments.
To assess the beneficial effects of Treg cells on behavioral outcomes and microglial inflammation at more chronic time points (30 d) post-TBI, we employed an alternative approach where total splenic T cells (CD45.2+CD4+) isolated from TBI-iso (iso-total CD4+) and TBI-nasal aCD3-treated mice (aCD3-total CD4+) and CD45.2+CD4+FoxP3− GFP cells isolated from aCD3-treated animals (aCD3-FoxP3− GFP) post-CCI were transferred i.p. into untreated but CCI-injured congenic CD45.1-expressing mice (Extended Data Figs. 8c and 9a). Adoptive transfer was performed at three time points post-CCI with each mouse receiving 2.5 × 10⁶ cells per injection. We found improvement in motor function and coordination, restoration of spatial memory and increased time spent in the target quadrant during the probe trial in mice that received total CD4+ T cells from aCD3-treated mice compared with mice that received CD4+ T cells depleted of Treg cells at 30 d post-TBI (Extended Data Fig. 9b). We performed flow cytometric analyses to track adoptively transferred cells in recipient mice by transferring cells from CD45.2 mice into CD45.1 mice and found CD45.2 transferred cells in all organs analyzed (Extended Data Fig. 9c). We then performed RNA-seq on microglia isolated from the ipsilateral hemisphere of iso-total CD4+, aCD3-total CD4+ and aCD3-FoxP3− GFP groups at 30 d post-TBI (Supplementary Table 5). A heatmap signature showed a distinct microglial transcriptomic signature of aCD3-total CD4+ compared with iso-total CD4+ and aCD3-FoxP3− GFP groups at 30 d post-CCI (Extended Data Fig. 9d). GSEA pathway analysis demonstrated that the aCD3-total CD4+ group was associated with the upregulation of neuron development pathways and the downregulation of several proinflammatory pathways involved in innate and adaptive immune responses, immune effector processes and antigen presentation compared with the iso-total CD4+ group, all of which were not notably upregulated in the aCD3-FoxP3− GFP group (Extended Data Fig. 9e). Similarly, the aCD3-total CD4+ group was associated with a downregulation of the innate immune response pathway when compared with the aCD3-FoxP3− GFP group (Extended Data Fig. 9f,g), where IPA analysis demonstrated IL-10 as a top activated upstream regulator and IFNγ as a top inhibited upstream regulator (Extended Data Fig. 9h). Consistent with the microglial transcriptomic data, RT–qPCR of the ipsilateral hemisphere showed an increase in the expression of several anti-inflammatory cytokines (Il10 and Il2), and growth factors including Gdnf at 1 month post-CCI in the aCD3-total CD4+ group compared with the iso-total CD4+ and aCD3-FoxP3− GFP groups (Extended Data Fig. 9i). Taken together, these data demonstrate a critical role for FoxP3+ Treg cells in augmenting microglia phagocytic capacity and ameliorating disease in TBI.
CD4+Foxp3+ Treg cells suppress microglial inflammatory and homeostatic markers in vitro
To further investigate the interaction between Treg cells and microglia after TBI, we employed an ex vivo transwell co-culture system in which microglia were isolated from the ipsilateral hemisphere of CCI mice 24 h after injury and Treg cells were isolated from spleens of a separate cohort of mice subjected to CCI and treated with nasal aCD3 or isotype control for 7 d (Fig. 6j). Microglia were placed in the lower chamber and Treg cells in the upper chamber and we performed RT–qPCR of microglia 72 h after incubation. We found an increase in anti-inflammatory and homeostatic markers (Il10, Cx3cr1 and Cd206) and a reduction in the proinflammatory marker Il1b in the TBI-aCD3 microglia, which are consistent with our in vivo microglial transcriptomic data at 7 d post-TBI. This effect was lost by blocking IL-10 in vitro which is also consistent with what we observed following in vivo Il-10 neutralization (Fig. 5).
IL-10-producing Treg cells modulate microglial phagocytosis, neuroinflammation and TBI outcomes
FoxP3 Treg cells play a critical role in suppressing CNS inflammation in acute stroke and chronic neurological diseases87 and, as shown above, we found that adoptive transfer of FoxP3 Treg cells from nasal aCD3-treated mice ameliorated TBI and IL-10 is an important factor in this process. We then asked whether IL-10 produced by Treg cells was responsible for this effect. To address this question, we first depleted FoxP3 Treg cells using FoxP3-DTR transgenic mice that express the diphtheria toxin receptor (DTR) under control of the FoxP3 promoter and then investigated the role of lL-10-producing Treg cells in TBI by using a dual reporter system that involved the gene encoding IL-10 and transcriptomic factor FoxP3 (10BiT.FoxP3GFP)88 which allowed us to sort IL-10+ and IL-10− Treg cells. In the first FoxP3 Treg cell depletion experiment, DT was injected 3 d before CCI and repeated every 3 d until 7 d after CCI or sham operation (Fig. 7a and Extended Data Fig. 10a). We found that the depletion of FoxP3 Treg cells worsened motor function as measured by rotarod behavioral testing (Fig. 7b) and exacerbated microglial inflammation (Fig. 7c). We also observed increased expression of proinflammatory microglial markers including Il1b, Tnf, Il6, and Il18, as measured by RT–qPCR. Most importantly, we found that the depletion of FoxP3 Treg cells reduced microglial phagocytic capacity to uptake dead neurons (Fig. 7d), highlighting their pivotal role in regulating microglial phagocytosis. Based on these results, we then investigated the role of lL-10-producing Treg cells in TBI by using a dual reporter system that involved the gene encoding IL-10 and 10BiT.FoxP3GFP (ref. 88) that allowed us to sort IL-10+ and IL-10− Treg cells (Fig. 7e-f). We assessed the effect of IL-10+ and IL-10− Treg cells by adoptive transfer of these cells to FoxP3-depleted mice (Fig. 7g and Extended Data Fig. 10b). We observed that DT has similar behavior outcomes in WT TBI DT mice and the FoxP3 TBI DT-PBS group (Fig. 7h). However, we found that the adoptive transfer of IL-10+ Treg cells was associated with improvements in motor function measured by rotarod and spatial memory measured by the Y-maze compared with the mice that received IL-10− Treg cells (Fig. 7h). Moreover, IL-10+ Treg cells attenuated the microglial inflammatory response with reduction in proinflammatory markers such as Il1b, Tnf, Il6, and Il18 compared with IL-10− Treg cells (Fig. 7i). Most importantly, adoptive transfer of IL-10+ Treg cells enhanced the microglial phagocytosis of dead neurons (Fig. 7j), indicating their critical role in modulating microglial inflammation and augmenting microglial phagocytosis. Thus, IL-10 plays a critical role in the beneficial effect of nasal aCD3-induced FoxP3 Treg cells on TBI.
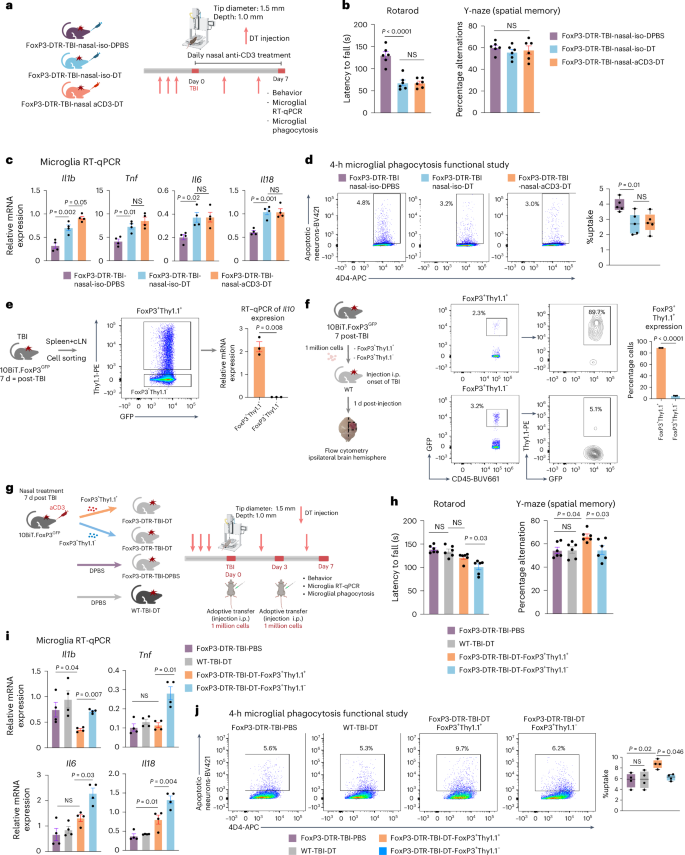
a, Experimental timeline of FoxP3-DTR Treg cell depletion (created with BioRender.com). b, Behavioral testing of rotarod and Y-maze was assessed between the groups. Data are shown as mean ± s.e.m., n = 6 mice per group and analyzed by one-way ANOVA with Tukey’s multiple comparisons. c, RT–qPCR of microglia sorted from the ipsilateral hemisphere 7 d post-TBI. Expression was normalized to GAPDH. Data are shown as mean ± s.e.m., n = 4 mice per group and analyzed by one-way ANOVA with Tukey’s multiple comparisons. d, Phagocytosis experiment with similar design to Fig. 4b. Data are shown as box plots (min,. max., IQR, median), n = 5 mice per group and analyzed by one-way ANOVA with Tukey’s multiple comparisons. e, Schematic representing validation of Il10 expression (created with BioRender.com). RT–qPCR of Il10 expression was done for FoxP3+Thy1.1+– and FoxP3+Thy1.1−-sorted cells and expression was normalized to GAPDH. Data are shown as mean ± s.e.m., n = 3 mice per group and analyzed by two-sided, unpaired Student’s t-test. f, Schematic representing adoptive transfer experiment (created with BioRender.com). Expression of Thy1.1 on FoxP3 was analyzed between the two groups. Data are shown as mean ± s.e.m., n = 3 sample per group and analyzed by two-sided, unpaired Student’s t-test. Each sample was a pool of five injured hemispheres. g, Schematic representing experimental timeline of adoptive transfer experiment. h, Behavioral testing of rotarod and Y-maze assessed between the groups. Data are shown as mean ± s.e.m, n = 6 mice per group and analyzed by one-way ANOVA with Tukey’s multiple comparisons. i, RT–qPCR of microglia sorted from the ipsilateral hemisphere 7 d post-TBI. Expression was normalized to GAPDH. Data are shown as mean ± s.e.m., n = 4 mice per group and analyzed by one-way ANOVA with Tukey’s multiple comparisons. j, Phagocytosis experiment with similar design to Fig. 4b. Data are shown as box plots (min., max., IQR, median), n = 4 mice per group and analyzed by one-way ANOVA with Tukey’s multiple comparisons. All data are biological replicates and represent two independent experiments.
Discussion
Neuroinflammation plays a crucial role in both acute and chronic stages of TBI and contributes to secondary injury11,20. Our study demonstrates that nasal aCD3-induced IL-10+FoxP3+ Treg cells promoted cognitive and motor recovery from TBI, enhanced microglia phagocytosis and reduced neuroinflammation via IL-10-dependent Treg cell–microglia crosstalk.
Microglia play a critical role in neuroinflammation after TBI and their activation contributes to long-term functional deficits and neurodegeneration20. We previously identified a time-dependent change in the microglial transcriptomic phenotype after contusional brain injury with reduced homeostasis, housekeeping and sensing tissue damage in the early stages and the development of a proinflammatory state over time89. Microglia also play a role in recovery by migrating to sites of neuronal death to phagocytose dead or dying cells or debris, and participate in synaptic remodeling to minimize neuronal injury and restore tissue integrity in the injured brain52. In the present study, nasal aCD3-induced FoxP3+ Treg cells enhanced the phagocytic, homeostatic, sensing and housekeeping microglial phenotype in the acute stage of injury. Transcriptomic analyses and functional studies demonstrated that nasal aCD3 increased the microglial phagocytic capacity to uptake apoptotic neurons post-injury in an IL-10-dependent manner. Importantly, we found that IL-10-producing FoxP3+ Treg cells play a critical role in augmenting microglial phagocytic capacity after TBI. We also found that aCD3 modulation of microglia at the lesion site is involved in controlling synaptic pruning and remodeling and myelin homeostasis. The expression of Bdnf, a key mediator of synaptic plasticity, which increases neuronal TrkB phosphorylation at the site of injury90, was increased in the aCD3-treated mice.
In the chronic phase of TBI, nasal aCD3-induced FoxP3+ Treg cells regulated the function of microglia from a phagocytic phenotype in the acute stages to a homeostatic and less inflammatory phenotype. It also decreased the expression of MGnD and DAM genes, which are associated with neurodegeneration51, toward homeostatic levels seen in sham-treated animals at 30 d post-injury. By removing cellular debris by phagocytosis early after injury and releasing neurotrophic factors and anti-inflammatory cytokines, microglia contribute to the reduced cell death and improved behavioral and neuropathological outcomes observed after nasal aCD3 treatment of TBI.
Studies have shown T lymphocyte infiltration into the brain after TBI91. Treg cells comprise a population of CD4+ T cells that include FoxP3+ Treg cells and FoxP3− Treg cells, the latter of which includes TH3 and Type 1 regulatory T (Tr1) cells92. Depletion of FoxP3+ Treg cells increased T cell CNS infiltration and expression of inflammatory IFNγ after TBI27. However, the function of the interaction between Treg cells and microglia is largely unknown. Our transcriptomic analyses of peripheral and brain-infiltrating Treg cells revealed that they were reprogrammed in favor of the mobilization, immunoregulation and cell–cell interactions, especially the activation of phagocytes. Consistent with a recent study in stroke23, brain-infiltrating Treg cells exhibited higher expression of genes involved in immunoregulatory and trophic factors which were enhanced with nasal aCD3. Adoptive transfer of total CD4, CD4+FoxP3+ Treg cells and, most importantly, CD4+FoxP3+IL-10+ Treg cells from nasal aCD3-treated mice modulated the microglial response and improved behavioral and neuropathological outcomes. We reported that nasal aCD3 treatment in a progressive experimental autoimmune encephalitis (EAE) model of MS27 and a model of lupus30 induced an IL-10-dependent CD4+LAP+FoxP3+ Treg cell response. In our nasal aCD3 TBI studies, we did not observe an increase in LAP+ T cells, although we did observe expansion of CD4+FoxP3+ Treg cells and IL-10+FoxP3+ Treg cells. These differences may be related to distinct regulatory mechanisms induced by acute injury such as TBI versus an autoimmune inflammatory process such as EAE or lupus, although, in both instances, nasal aCD3 induced a Treg cell phenotype that ameliorated disease.
Treg cells exert their immunoregulatory functions after TBI by secreting regulatory cytokines such as IL-10 (ref. 93), IL-4 and TGF-β94,95. IL-10 is an anti-inflammatory cytokine that plays a role in resolution of neuroinflammation after brain injury93. The expression of IL-10 in the brain increases with acute brain injury, promoting neurological recovery by multiple mechanisms, including inhibiting microglia or macrophage cytokine production, reducing the activation of effector T cells, monocytes and macrophages, and promoting neuronal and glial cell survival93,96,97. Clinical studies have shown that IL-10 levels increase after TBI98,99. Preclinical studies have shown that IL-10−/− female mice have worse inflammation and motor and cognitive function post-CCI100. IL-10 pharmacological formulations reduce lesion volume and improve functional outcomes after TBI101,102. However, the role of IL-10 in Treg cell–microglia crosstalk and its effects on microglial function after TBI have not been explored. We found that nasal aCD3 mAb induced IL-10-producing FoxP3+ Treg cells that migrated to the CNS to downregulate microglial activation and improve behavior in an IL-10-dependent manner. Specific blocking of the IL-10R in vivo in microglia reversed the therapeutic effects of nasal aCD3 mAb, reduced microglial phagocytic capacity and contributed to a chronic microglial activation state. These results demonstrate the important role of Treg cell–microglial crosstalk via IL-10 in the treatment of TBI using nasal aCD3.
A major challenge for the treatment of TBI is to induce Treg cells in a fashion that is nontoxic and translatable to the clinic. Approaches such as infusion of cord blood Treg cells, astrocytes engineered to produce IL-2 and mesenchymal stromal cells have demonstrated preclinical benefit, but are difficult to translate to the clinic87,103. Nasal aCD3 is a unique immunotherapeutic approach to induce Treg cells to downregulate CNS inflammation and could be given immediately after TBI. Foralumab, a fully human aCD3 mAb, has been successfully given to humans and has demonstrated immunomodulatory effects with minimal toxicity104,105,106. A pilot trial in individuals with mild-to-moderate COVID-19 reduced lung inflammation and blood inflammatory biomarkers without side effects105,106 and nasal foralumab is being studied in individuals with progressive MS.
In conclusion, our study identifies nasal aCD3 as a new therapeutic approach for treating TBI. Nasal aCD3 induces Treg cells that enhance the phagocytic capacity of microglia to clear dead neurons, modulate the CNS innate and adaptive immune responses, and promote functional recovery in an IL-10-dependent manner. This approach has potential applications for the treatment of TBI and other types of acute brain injury, such as stroke.
Methods
Experimental animals
Studies were performed using 8- to 12-week-old C57BL6J mice (Jackson Laboratories cat. no. 000664), B6.CD45.1 mice (Jackson Laboratory, cat. no. 002014), FoxP3-GFP mice (Jackson Laboratory, cat. no. 023800), FoxP3-DTR mice (Jackson Laboratory, cat. no. 016958), IL-10 KO mice (Jackson Laboratory, cat. no. 002251), Tmem119-CreETR2 mice (Jackson Laboratory, cat. no. 031820), IL-10raFlx mice (Jackson Laboratory, cat. no. 028146) and 10BiT.FoxP3GFP (kindly provided by V. Kuchroo)88. All mice were housed under specific pathogen-free conditions, with free access to food and water. All animals were housed in temperature (20 °C) and humidity (60%)-controlled rooms, maintained on a 12 h:12 h light:dark cycle (lights on at 07:00). Mice were euthanized by CO2 inhalation. The Institutional Animal Care and Use Committee at Harvard Medical School and Brigham and Women’s Hospital has all experimental procedures involving animals.
Treatment with aCD3 mAb
Mice were nasally treated with a daily dose, immediately (4–6 hours) and for some experiments early (3 days) or delayed (7 days) post TBI, of 1 µg per mouse hamster immunoglobulin G (IgG) CD3-specific antibody (BioXCell, clone no. 145-2C11) or hamster IgG control antibody (BioXCell) dissolved in PBS and henceforth every other day after the first week until the experimental endpoint. For some experiments, mice were given 0.5 mg of monoclonal anti-IL-10R-blocking antibody (BioXCell, clone 1B1.3A), by intraperitoneal injection at the onset of TBI and henceforth every third day until the experimental endpoint.
Conditional genetic deletion of IL-10Ra in microglia
To induce Cre-recombinase expression, a dose of tamoxifen (150 mg per kg of body weight) in corn oil was injected i.p. for 5 d consecutively. IL-10Raflx/flx was crossed with Tmem119-CreETR2 mice110. Recombination was induced in Tmem119-CreETR2:IL-10Raflx/flx mice and Tmem119-CreWT:IL-10Raflx/flx littermates were used as controls. A washout period of 2 weeks was implemented after the last tamoxifen injection before starting any experiment.
FoxP3 cell depletion
Depletion of FoxP3 was done as previously described23. In short, DT (0.05 μg per g body weight) was injected i.p. 3 d before TBI and was repeated every 3 d to maintain FoxP3 depletion until sacrifice.
Controlled cortical impact
A CCI model was used as previously described111. Mice were anesthetized with 4.5% isoflurane (Anaquest) in 70% nitrous oxide and 30% oxygen using a Fluotec 3 vaporizer (Colonial Medical). The mice were placed in a stereotaxic frame and a 5-mm craniotomy was made over the right somatosensory cortex using a drill and a trephine. The bone flap was removed and discarded and a pneumatic cylinder with a 1.5- or 3-mm flat tip impounder and velocity 6 m s−1, depth 1.0 or 1.5 mm and dwell time of 0.8 s was used to induce CCI (Impact One, Leica Biosystems). The scalp was sutured closed and the mice were returned to their cages to recover.
Behavioral studies
Open field testing
The open field (OF) test is used to measure general locomotor activity and anxiety-like behavior of the animals112. The OF square chambers are made of blue Plexiglas with dimensions of 30 × 38 × 40 cm3. For each testing session, the animal was allowed to explore the chamber for 15 min. A computer-assisted tracking system and software (EthoVision XT, v.14, Noldus Information Technology) was used to record the behavior of the animals throughout the testing session. The percentage time spent in the center was measured.
Rotarod
The rotarod was carried out as previously described31. Mice were placed on a rotarod apparatus (Ugo Basile, cat. no. 7650), accelerating from 4 rpm to 60 rpm in 300 s. Each animal was given three trials and the times when the animal would no longer be able to hold on were recorded and averaged for analysis of motor function.
Morris water maze
The MWM was used to measure spatial learning and memory by training mice to use spatial cues to find a hidden platform to escape water113. The MWM apparatus is a circular pool with a diameter of 130 cm and depth of 50 cm. During the first day, the platform was visible and the animals were given three trials to find it. During the 4-d training period, mice received three trials per day learning how to find the hidden platform. Then 24 h after the last training day, a probe trial was performed in which the platform was removed and mice were allowed to swim for up to 60 s. The amount of time spent by the animal to find the platform and the time spent in the target quadrant for the probe trial were calculated using Noldus EthoVision XT tracking software.
Y-maze
The Y-maze was used to assess spatial working memory in mice. The test was conducted as previously described114. In short, the mice were placed in the center of the maze and given 5 min to explore all three arms, the number of triads (triplets of consecutive arm entries of ABC, BCA and CAB) were counted to the percentage alternation. The ratio of correct choice was determined by the equation: Percentage alternations = ((No. of alternations)/(Total arm entries − 2)) × 100 (ref. 115).
BBB permeability 70-kDa FITC-dextran
A 70-kDa FITC-dextran (Sigma-Aldrich, cat. no. 46945) was used to measure BBB permeability as described in previous studies116,117, with modifications: 0.2 mg of 70-kDa FITC-dextran per g of body weight was injected retro-orbitally118,119. Then, 10 min post-70-kDa FITC-dextran administration, the mouse was euthanized with a lethal dose of xylazine and ketamine cocktail (450 mg kg−1 and 45 mg kg−1) i.p. with a 29-gauge insulin pen. The mouse was transcardially perfused with 50 ml of PBS. The whole brain was removed and stored at −80 °C (ref. 120). Cryoprotected and flash-frozen brains were coronally sectioned (16-μm-thick serial sections, 300 μm apart)116. The brain sections were captured by a Leica DMi8 wide-field microscope. FITC-dextran visualization was done under a 488-nm excitation wavelength laser. For each mouse, we obtained five to six continued section slices from the brain tissue’s front, middle and posterior sections. An investigator blind to the experimental design manually measured the l mean gray value of the dextran tracer-positive area found in the brain parenchyma using ImageJ.
Brain edema
Brains were removed at 72 h after CCI, bisected into left and right hemispheres and each hemisphere was weighed (wet weight). Brains were then dried at 60 °C for 48 h and dry weights were obtained. The percentage of brain water content was expressed as ((wet − dry weight)/(wet weight)) × 100% as previously described121.
Magnetic resonance imaging
Imaging was done using a 7.0T Bruker BioSpect USR. In brief, mice were gently handled and placed in an isoflurane anesthesia chamber. Then the mice were placed inside the imaging apparatus with their nose in front of tubes releasing 2% isoflurane. Electrocardiogram (ECG) leads were placed on the animal’s paws and a pneumatic pillow sensor placed under the abdomen for continuous ECG and respiratory rate monitoring of the anesthetized animal. These waveforms were closely monitored throughout magnetic resonance imaging (MRI) by the MRI operator. The animal was placed on an MRI-compatible bed, which was placed inside the magnet for imaging. The imaging sessions lasted between 15 min and 60 min. Mice were then returned to their cages and monitored continuously after being returned to their cages before returning to a fully alert status. The following parameters were obtained to generate the T2 sequence images: slice thickness: 0.5 mm; repetition time: 3,000 ms; echo time: 50 ms; no. of averages: 3; spacing between slices: 0.5 mm; echo train length: 8; acquisition matrix: 200 × 200; flip angle: 90°; and field of view: 20 mm. Serial Images were viewed and analyzed using the three-dimensional (3D) Slicer platform122.
Immunohistochemistry
Animals were anesthetized with CO2 until the respiration rate slowed and perfused transcardially with Hanks’ balanced salt solution (HBSS). Brains were post-fixed in 4% paraformaldehyde for 48 h, then transferred to a 15% sucrose solution for 24 h and finally transferred to a 30% sucrose solution for 24 h. Brains were then flash frozen in Tissue-Tek Oct (Sakura, compound 4583) and stored at −80 °C until the time of sectioning. Brains were subsequently sectioned at −20 °C using a cryostat at the bregma position for each targeted brain. Sections were cut at 0.2 mm in a fourfold series interval. Five total sections were placed on Colorfrost Plus-treated adhesion slides (Thermo Fisher Scientific) and stored at −20 °C until the time of staining. Whole meninges were processed as previously described123. For immunofluorescence, sections were blocked in in a 10% normal horse serum solution, containing 0.1% Triton X-100, 1% glycine and 2% bovine serum albumin (BSA). Slides were incubated overnight at 4 °C with anti-Iba-1 (rabbit, 1:1,000, Wako). The following day sections were washed and incubated with an Alexa Fluor-647 goat anti-rabbit IgG (1:1,000, Abcam, cat. no. ab150075) for 1 h at room temperature. Sections were also stained with H&E (Abcam, cat. no. ab245880) and TUNEL (TUNEL Assay Kit, BrdU-Red, Abcam, cat. no. ab66110) according to their corresponding kit protocols. Iba-1- and TUNEL-stained slides were co-stained with DAPI mounting medium (Vector Laboratories, cat. no. UX-93952-24). FoxP3 GFP mice were used to visualize FoxP3 Treg cells in the meninges and brain using the Cy2 channel of the microscope and CD3 was stained using Alexa Fluor-647 anti-mouse CD3 (BioLegend, cat. no. 17A2, 1:50). Images were taken using a Leica DMi8 wide-field microscope on the ×20 objective or the Zeiss LSM710 confocal microscope.
Image analysis
Analysis of the percentage Iba-1 and number of TUNEL-positive cells per surface area was performed on five photomicrographs per animal (n = 4 or 5). The sections analyzed were taken between 300 μm and 1,500 μm laterally from the coronal plane. Each scanned photomicrograph was used to produce images of the area of contusion. All the images were analyzed using ImageJ software (National Institutes of Health: https://imagej.nih.gov/ij). Images were split by color channel, the channel of interest was threshold using the Yen setting and the number of positive cells were quantified as previously described124.
Serum biomarkers
Levels of cytokines in the serum of mice were measured with the V-PLEX Plus Proinflammatory Panel1 Mouse Kit (Meso Scale Discovery, cat. no. K15048G-1). All sample controls were diluted 1:2 and run as duplicates according to the manufacturer’s protocol, as previously described125.
Quanterix single-molecule array analysis
Levels of ubiquitin carboxy-terminal hydrolase L1 (UCH-L1) and GFAP were quantified in the serum using single-molecule array technology (SiMoA, Quanterix). The SiMoA Neurology 4-Plex B kit was run according to the manufacturer’s directions. Briefly, samples were thawed, vortexed and centrifuged at 10,000g for 5 min. All samples were run at a 4× dilution, along with eight calibrators run neat and two controls also run at a 4× dilution. The data were validated using a calibration curve with R2 > 0.99. For both UCHL-1 and GFAP, the dynamic range was 0–40,000 pg ml−1, with a lower limit of quantification of 9.38 pg ml−1.
Flow cytometry microglial sorting
For microglial cell sorting, mice were anesthetized with CO2 until their respiration rate slowed and then transcardially perfused with 50 ml of HBSS containing heparin (1:1,000). After perfusion, the ipsilateral hemisphere was homogenized using a Dounce glass tissue homogenizer. Cells were separated through a Percoll (GE Healthcare Life Sciences) 30% gradient centrifugation. Cells were isolated from the Percoll layer and stained on ice for 30 min with combinations of phycoerythrin (PE)/cyanine7 anti-mouse CD11b (BioLegend, cat. no. M1/70, 1:100), allophycocyanin (APC)/cyanine7 anti-mouse CD45 (BioLegend, cat. no. 30-F11, 1:100), FITC anti-mouse Ly6C (BD Bioscience, cat. no. AL-21, 1:200) and APC anti-mouse 4D4 (ref. 51) (marking resident microglia; 1:1,000) in blocking buffer containing 0.2% BSA (Sigma-Aldrich) in HBSS. Cell sorting was performed using a FACSAriaIII cell sorter (Becton Dickson). Microglial cells were identified as CD45+CD11b+Ly6C−4D4+ and dead cells were also excluded based on 7-aminoactinomycin D (7-AAD; BD Bioscience) staining. Cells were sorted directly in 1.5-ml Eppendorf tubes and stored at −80 °C. Phagocytic positive microglia were sorted as 4D4+ Alexa-405+.
Flow cytometry intracellular staining
Intracellular cytokine staining and cell isolation were done as previously described126. The meninges were carefully removed from the skull and the ipsilateral brain was further isolated. The enzyme dissociation mix used for the ipsilateral brain hemisphere and meninges was collagenase P (0.5 mg ml−1; Sigma-Aldrich, cat. no. 11213865001) and DNase-1 (250 U ml−1, Worthington, cat. no. LK003172) diluted in Roswell Park Memorial Institute (RPMI)-1640 with 10 mM Hepes. The samples were then finely minced and incubated in a room temperature shaker for 1 h. After enzyme dissociation, the cells were separated using Percoll (GE Healthcare Life Sciences) as described above. Cells isolated from the brain and meninges were incubated for only 2 h instead of the 4 h for cLN cells. Acquisition was performed on a Symphony (BD Biosciences) using DIVA software (BD Biosciences) and the data were analyzed with FlowJo software v.9.9 or v.10.1 (TreeStar Inc.). Intracellular staining antibodies used Zombie Aqua Fixable Viability Kit (BioLegend, cat. no. 423102, 1:1,000) or Zombie UV (BioLegend, cat. no. 423108, 1:1,000) was used to exclude dead cells. The staining antibodies used PE/cyanine7 anti-mouse CD11b (BioLegend, cat. no. M1/70, 1:300), APC/cyanine7 anti-mouse TCR-β (BioLegend, cat. no. H57-597, 1:100), BUV661 anti-mouse CD45 (30-F11, BD Biosciences, 1:200), PE anti-mouse CD4 (BioLegend, cat. no. GK1.5, 1:100), BUV805 anti-mouse CD8 (BD Biosciences, cat. no. 53-6.7, 1:100), FITC anti-mouse FoxP3 (eBioscience, cat. no. FJK-16s, 1:100), BV421 anti-mouse LAP (BioLegend, cat. no. TW7-16B4, 1:100), PE/Dazzle 594 anti-mouse IL-10 (BioLegend, cat. no. JES5-16E3, 1:100), BUV395 anti-mouse IL-17a (BD Biosciences, cat. no. TC11-18H10, 1:100), BV785 anti-mouse IFNγ (BioLegend, cat. no. XMG1.2, 1:100), BV605 anti-mouse Ly6G (BioLegend, cat. no. 1A8, 1:300), BV711 anti-mouse NK-1.1 (BioLegend, cat. no. PK136, 1:100), AF700 anti-mouse Ly6C (BioLegend, cat. no. HK1.4, 1:200), BV711 anti-mouse Ly6C (BioLegend, cat. no. HK1.4, 1:200) and APC anti-mouse 4D4 (ref. 47) (1:1,000) provided by Butovsky.
Flow cytometry FoxP3(GFP) Treg cell sorting from the brain and blood
The ipsilateral brain hemisphere was processed with the same enzyme dissociation kit described above and then processed as the microglial cell sorting above. The sample was purified and enriched using CD4 cell isolation microbead kit (Miltenyi Biotech, cat. no. 130-104-454) on a magnetic MACS separator before sorting. Cell sorting was performed using FACSAriaIII cell sorter (Becton Dickson). APC/cyanine7 anti-mouse CD45 (BioLegend, cat. no. 30-F11, 1:100), APC anti-mouse CD4 antibody (BioLegend, cat. no. GK1.5, 1:100) and 7-AAD (BD Bioscience) was used to identify the live CD4+ population and the FITC channel was used to identify the FoxP3+ population. Each RNA-seq sample is a pool of 5 ipsilateral hemispheres and 20 sham brain hemispheres. The blood samples were collected in heparin-coated tubes and then transferred to 15-ml tubes where ACK lysis buffer was used to lyse the erythrocytes. The sample was then strained through a 70-μm filter and stained as decribed above. Each RNA-seq sample is a pool of five mice.
Quantitative PCR
RNA was extracted with RNeasy columns (QIAGEN), complementary DNA was prepared and used for qPCR (Applied Biosystems, cat. no. 437466) and the results were normalized to Gapdh (Mm99999915_g1). Applied Biosystems supplied: Il10 (cat. no. Mm01288386_m1), Il6 (cat. no. Mm00446190_m1), Tnf (cat. no. Mm00443258_m1), Il1b (cat. no. Mm00434228_m1), Il2 (cat. no. Mm00434256_m1), Il18 (cat. no. Mm00434226_m1), Ifng (cat. no. Mm01168134_m1), Bdnf (cat. no. Mm04230607_s1), Gdnf (cat. no. Mm00599849_m1), Ccl5 (cat. no. Mm01302427_m1), Cd14 (cat. no. Mm01158466_g1), Mrc1 (Cd206) (cat. no. Mn01329359_m1), Tgfb1 (cat. no. Mm01178820_m1), Il17a (cat. no. Mn00439618_m1), Cd86 (cat. no. Mm00444540_m1), Clec7a (cat. no. Mm01183349_m1), Tlr2 (cat. no. Mm00442346_m1), Cd33 (cat. no. Mm00491152_m1), Cx3cr1 (cat. no. Mm00438354_m1) and Il10ra (cat. no. Mm00434151_m1). The 2−ΔΔCt method was used to calculate the relative expression of each gene.
Isolation of primary neurons
Primary neuron isolation was carried out as previously described51. In short, primary neurons were prepared from embryos at age E18. Cell density was determined using a hemocytometer and cells were seeded. Dulbecco’s modified Eagle’s medium (DMEM) with 10% fetal bovine serum (FBS) was used for initial plating and the medium was changed to neurobasal supplemented with 1× B27 (Invitrogen) 3 h later. The medium was changed every 3 d.
Induction of apoptosis and labeling of neurons
Apoptosis and labeling of neurons were done as previously described51. Neurons were irradiated with ultraviolet light (302 nm) with an intensity of 6 × 15 W for 15 min. The apoptotic neurons were labeled with labeling dye (Alexa-405 NHS Ester, Life Technologies/Thermo Fisher Scientific). Neurons were resuspended at a density of 500,000 cells per 4 μl for stereotactic injections.
Stereotactic injections
Mice were anesthetized by intraperitoneal injection of ketamine (100 mg kg−1). Apoptotic neurons or sterile Dulbecco’s PBS (DPBS) were injected into the lesion of TBI mice at two depths of 1.5 mm and 2 mm. Then, 2 μl was injected at each depth using stereotaxic equipment (Harvard Apparatus). After recovery from surgery, animals were returned to their cages. Post-surgery (4 or 16 h), mice were euthanized by CO2 inhalation and brains were processed for flow cytometry analysis of phagocytic microglia.
Adoptive transfer
Splenocytes and cLNs from FoxP3-GFP or 10BiT.FoxP3GFP mice were purified and enriched using CD4 cell isolation microbead kit (Militenyi Biotech, cat. no. 130-104-454) on a magnetic MACS separator before sorting. Cell sorting was performed using FACSAriaIII cell sorter (Becton Dickson). PE anti-mouse CD3 (BioLegend, cat. no. 17A2, 1:100), APC anti-mouse CD4 (BioLegend, cat. no. GK1.5, 1:100) and 7-AAD were used to identify the live CD4+ population and the FITC channel was used to identify the FoxP3+ population. For the 10BiT.FoxP3GFP, PE anti-mouse Thy1.1 (BioLegend, cat. no. S20007C, 1:1,500) was used to identify the FoxP3+Thy1.1+ IL-10-producing FoxP3 Treg cells. All cells were injected i.p. at 2.5 million for total CD4, 1 million for CD4+FoxP3+ and 1 million for FoxP3+Thy1.1+ or FoxP3−Thy1.1− populations.
In vitro cell culture
Sorted 4D4+ microglia 24 h post-TBI were cultured as previously described127 at 200,000 cells in a 24-well plate (Kemtec, cat. no. 4422A). The microglial culture medium was composed of 10% FBS (Gibco, cat. no. 10438026), 100 U ml−1 of penicillin–streptomycin mixture (Lonza, cat. no. DE17-602E), supplemented in DMEM/F-12 Glutamax medium (Gibco, cat. no. 10565018). FoxP3-GFP was treated with nasal aCD3 or the isotype control for 7 d and the splenic/cLN CD4+FoxP3+ and CD4+FoxP3(GFP)− population, specifically from aCD3-treated animals, was placed in a lymphocyte culture medium composed of 10% FBS, 100 U ml−1 of penicillin–streptomycin mixture, 55 µM 2-mercaptoethanol (Gibco, cat. no. 21985023), 1% sodium pyruvate (Lonza, cat. no. BE13-115E) and 1% Hepes (Lonza, cat. no. BE17-737E), supplemented in RPMI-1640 medium (Gibco, cat. no. 11875119) and then placed on the top of the hanging cell culture 0.4-µm insert (Millicell, cat. no. PTHT24H48) at 600,000 cells per insert on top of the cultured microglia, and the assay was left for 72 h in a CO2 Cell culture Incubator (InCusafe). There was a fourth group where IL-10-neutralizing antibody (BioXCell, cat. no. JES5-2A5) at a concentration of 50 μg ml−1 was added with the CD4+FoxP3+ which was cell sorted from nasal aCD3-treated mice After 72 h the microglia were lysed with buffer RLT and RNA was extracted with RNeasy columns (QIAGEN).
Bulk RNA-seq and analysis
Bulk RNA-seq was performed as previously described59. Briefly, 2,000 isolated microglia CD45+CD11b+Ly6C−4D4+ were lysed in 5 μl of TCL buffer + 1% 2-mercaptoethanol. Between 800 and 1,000 isolated CD4+FoxP3(GFP+) cells from the brain and blood were processed. Smart-Seq2 libraries were prepared and sequenced using the Broad Genomic Platform. The cDNA libraries were generated from sorted cells using the Smart-seq2 protocol5. RNA-seq was performed using Illumina NextSeq500 with a High Output v.2 kit to generate reads of 2× 38 bp. Sequencing data were demultiplexed and provided by the Broad Institute in FASTQ format. The processing of the bulk RNA-seq data (transcript assembly and quantification) was based on an established computational pipeline (HISAT, Stringtie and Ballgown)128 and sequencing quality was assessed using FastQC. Reads were aligned to the ‘mm10’ reference genome. Transcript abundances were then imported into R (v.4.1.2) and converted to gene-level estimated counts using the ‘tximport’ package (v.1.22.0) from Bioconductor. Low abundance genes that achieved <10 counts aggregated across all samples were filtered out. Raw read counts were then normalized using DESeq2 (v.1.34.0). Differential gene expression was performed using DESeq2 with a significance cutoff of false discovery rate (FDR)-adjusted P < 0.05. Analyses that did not pass the FDR-correction cutoff were denoted with P < 0.05. Pairwise group comparisons were conducted using Wald’s test with standard parameters, then log2(fold-changes) were shrunk using the lfcShrink function in DESeq2. Gene expression comparisons of three or more groups were conducted using a likelihood ratio test (LRT). Heatmaps were created using ComplexHeatmap (v.2.10.1) or pheatmap (v.1.0.12) and clusters were identified via hierarchal clustering. Identified clusters were functionally annotated with Gene Ontology Biological Process (GOBP) gene-set terms using the enrichGO function of the clusterProfilerpackage (v.4.2.2), where GOBP terms with q-values < 0.05 were considered significantly enriched.
Pathway analysis
GSEA was performed using the clusterProfiler package and the resulting enriched terms with q-values < 0.05 were visualized through dot plots and bar plots, which were generated using the ggplot2 and ggpubr (v.0.6.0) packages. For IPA (https://digitalinsights.qiagen.com/products-overview/discovery-insights-portfolio/analysis-and-visualization/qiagen-ipa), DEGs from pairwise comparisons with corresponding log2(fold-changes) and FDR-adjusted P values were used as input. Biological networks were generated in IPA based on canonical pathways and biological functions, as outlined in our group’s previous work59.
Statistical and reproducibility
Statistical analysis was performed using GraphPad Prism v.9 software. Data are presented as mean ± s.e.m and two-sided Student’s t-tests (unpaired), two-factor, repeated-measure, two-way analysis of variance (ANOVA) (group × time) or one-way ANOVA, followed by Tukey’s multiple-comparison analysis was used to assess statistical significance between the groups. All n and P values and statistical tests are indicated in the figure legends. No statistical methods were used to predetermine sample sizes, but our sample sizes are similar to those reported in previous publications15,23. Data distribution was assumed to be normal, but this was not formally tested. Data for each experiment were collected and processed randomly and animals were assigned randomly to various experimental groups as well. The investigators were blinded to allocation during experiments and outcome assessment. No animals or data points were excluded from the analyses. Each experiment was repeated 2–3 times.
Reporting summary
Further information on research design is available in the Nature Portfolio Reporting Summary linked to this article.
Responses