Neuronal polyunsaturated fatty acids are protective in ALS/FTD

Main
Amyotrophic lateral sclerosis (ALS) and frontotemporal dementia (FTD) are two progressive and invariably fatal neurodegenerative disorders. ALS is characterized by loss of upper and lower motor neurons in the brain and spinal cord, leading to muscle wasting and paralysis, whereas FTD leads to degeneration of the frontal and temporal lobes of the brain, resulting in behavioral and language abnormalities. It is now well established that ALS and FTD represent two ends of a disease continuum, with overlapping clinical and pathological features. ALS and FTD are also linked genetically, with the most common genetic cause of both diseases being an intronic G4C2 repeat expansion in the C9orf72 gene (C9 ALS/FTD)1,2.
The C9orf72 repeat is transcribed bidirectionally into sense and antisense repeat RNAs, which are translated into dipeptide repeat proteins (DPRs) by a process termed repeat-associated non-ATG (RAN) translation3,4,5,6,7,8. RAN translation occurs in all reading frames and on both strands to produce five distinct DPR species: poly(GR), poly(GP) and poly(GA) from the sense strand and poly(GP), poly(PR) and poly(PA) from the antisense strand. DPRs and the repetitive RNAs themselves have been implicated in driving neurodegeneration9,10,11,12,13,14,15. In addition, the repeat expansion leads to reduced levels of the C9orf72 protein16,17, which may exacerbate gain-of-function mechanisms18,19. Despite numerous cellular pathways implicated downstream of the C9orf72 repeat expansion since its discovery20,21, the molecular mechanisms driving neuronal loss are still unclear.
The brain has the second highest lipid content of any organ in the body, where these molecules serve as critical components of neuronal and organellar membranes. Brain lipids contain a particularly high proportion of polyunsaturated fatty acids (PUFAs)22 and epidemiological studies have demonstrated that increased dietary consumption of PUFAs, particularly ω-3 PUFAs, is associated with decreased ALS risk and longer survival after onset23,24,25. However, a molecular understanding of these findings and their relevance to neurodegeneration are unclear. Thus, in the present study, we sought to characterize lipid changes associated with C9 ALS/FTD and understand their contribution to neurodegeneration.
Results
Fatty acid and lipid metabolism pathways are decreased in C9 ALS/FTD
To identify pathways dysregulated in neurons in response to expression of the pathological C9orf72 repeat (C9) expansion, we performed RNA sequencing (RNA-seq) on Drosophila heads with 36 G4C2 repeats expressed exclusively in adult neurons9 (Fig. 1a). These experiments were performed at an early timepoint (5 d of repeat expression) to assess early gene expression changes. Gene ontology (GO) enrichment analysis of differentially expressed genes (DEGs) identified only three GO terms enriched among upregulated pathways (Extended Data Fig. 1a). However, among the most significantly downregulated pathways, we observed multiple terms related to fatty acid and lipid metabolism (Fig. 1b). This included reduction of several genes throughout the canonical long-chain fatty acid synthesis and desaturation pathway, such as AcCoAS, FASN1, FASN2 and Desat1 (Fig. 1c,d and Extended Data Fig. 1b). To determine whether these lipid gene expression changes were conserved in human disease, we reanalyzed the largest bulk RNA-seq dataset generated from ALS postmortem spinal cords, comprising 138 cases of ALS and 36 non-neurological disease controls26. Strikingly, genes in the same lipid and fatty acid metabolism pathway were also downregulated in ALS spinal cords, including ACACA, ACSS2, FASN, ELOVL6 and SCD (orthologous to Drosophila ACC, AcCoAS, FASN1/FASN2, Baldspot and Desat1, respectively) (Extended Data Fig. 1c). These genes were similarly downregulated in the subset of 28 spinal cords of patients with C9 ALS present within the dataset (Extended Data Fig. 1c). Together, these findings demonstrate conserved transcriptional dysregulation of lipid metabolism, and specifically downregulation of fatty acid synthesis and desaturation processes, in ALS/FTD neurons.

a, C9 flies were induced for 5 d before performing RNA-seq on heads compared with age-matched uninduced controls. b, GO biological process enrichment analyses showing lipid metabolism terms significantly enriched among downregulated genes in RNA-seq comparison of C9-induced fly heads versus uninduced controls (n = 4 biological replicates, with 15 fly heads per replicate). Genotype: UAS-(G4C2)36; elavGS. c, Volcano plot highlighting significantly downregulated fatty acid synthesis and desaturation genes in C9 fly heads. AcCoAS, Acetyl-coenzyme A synthetase. DEGs in b and c were calculated with DEseq2 using default parameters (Methods). d, Simplified long-chain fatty acid synthesis and desaturation pathway, with Drosophila genes in boxes and human orthologous genes in parentheses underneath. The blue boxes indicate genes that were significantly downregulated in C9 fly heads. The ‘C’ number indicates the number of carbons in the fatty acyl chain, the number after the colon denotes the number of double bonds and the ‘ω’ number denotes the position of the final double bond before the methyl carbon. e, C9 and wild-type (elavGS driver alone) flies induced for 7 d before brains were dissected for lipidomics analyses. f, Heatmap displaying all detected phospholipids as log2(fold-change) (log2(FC)) over wild-type fly brains (n = 3 biological replicates, with 20 fly brains per replicate). g, Volcano plots of all detected phospholipid species in C9 fly brains compared with wild-type control flies showing log2(fold-change) over wild-type and significance (two-sided Student’s t-test). Top, color corresponding to the number of double bonds in the phospholipid species’ most unsaturated fatty acyl chain. Bottom, all PUFA-containing species (two or more double bonds) colored cyan. Genotypes: elavGS, UAS-(G4C2)36; elavGS.
Source data
Altered phospholipid saturation in C9orf72 flies and iPS cell neurons
In light of the dysregulation of the fatty acid and lipid metabolism transcriptional signature, we next determined whether lipids were altered in C9 fly brains. We dissected brains from C9 and wild-type control flies after 7 d of repeat expression and conducted lipidomic analysis of >1,400 complex lipid species (Fig. 1e). Among the different lipid classes that were measured, these experiments revealed a consistent change across phospholipid species (Fig. 1f,g). Phospholipids are composed of two fatty acyl chains and a head group. The number of double bonds in each chain determines their saturation with zero double bonds being a completely saturated fatty acid (SFA) and each additional double bond increasing unsaturation. Species with two or more double bonds are classed as PUFAs. We observed a marked shift toward higher phospholipid saturation and loss of PUFA-containing phospholipids compared with control brains (Fig. 1f,g). To test whether this phenotype was being driven by repeat RNA or DPRs, we then conducted lipidomics on brains from RNA-only (RO) flies, where the repeat is interrupted by stop codons and does not produce DPRs, and GR36 flies, in which the repeat sequence is codon optimized to no longer produce G4C2 RNAs but does produce toxic poly(GR) through ATG-driven translation9,27. We found that RO flies, but not GR36 flies, recapitulate the reduction in PUFA-containing phospholipids observed in C9 fly brains (Extended Data Fig. 2a–c). This indicates that reduction in phospholipid unsaturation is driven by repeat RNA rather than DPRs.
To determine whether these lipidomic alterations are conserved in a human model, we performed lipidomic analyses on C9 repeat-containing iPS cell cortical neurons and isogenic controls, which were induced with the i3Neuron protocol28,29 and collected 21 d later (Fig. 2a). As in the C9 flies, we observed a striking shift toward higher phospholipid saturation and loss of highly polyunsaturated phospholipids (containing fatty acyl chains with four or more double bonds) compared with controls (Fig. 2b,c and Extended Data Fig. 3a–c). To confirm that these changes were driven by the C9 repeat expansion and not cell-line variability, or other mechanisms such as C9orf72 loss of function, we next performed lipidomic analyses in two cross-validation experiments (Fig. 2a). In the first, we exogenously expressed C9 repeats in control iPS cell neurons by transducing with (G4C2)92 or (G4C2)2 lentiviruses. As expected, lentiviral repeat expression resulted in substantial DPR production in (G4C2)92– but not (G4C2)2-transduced neurons (Extended Data Fig. 4). Exogenous repeat expression in control iPS cell neurons recapitulated the loss of highly polyunsaturated phospholipids that we observed in the C9 patient lines (Fig. 2b,c). This shows that expression of expanded C9orf72 repeats is sufficient to drive the lipid changes observed. Next, we treated our three C9 lines with an antisense oligonucleotide (ASO) that specifically targets transcripts containing the C9 repeat7. This led to an almost complete (>95%) reduction in DPRs compared with a nontargeting (NT) control, confirming effective knockdown (Extended Data Fig. 4). C9 repeat knockdown prevented the reduction in highly polyunsaturated phospholipids that we observed in the C9 patient lines, suggesting that the C9 repeat was driving these changes (Fig. 2b,c and Extended Data Fig. 3a,d,e). Lipid class proportionality was similar across conditions, suggesting that these observations are the result of a specific shift in phospholipid saturation rather than a global alteration in lipid class abundance (Extended Data Fig. 5a). Together, these results demonstrate a striking and specific decrease in PUFA-containing phospholipid species caused by the presence of expanded C9 repeats.

a, C9 and isogenic control i3iPS cells were induced using the i3Neuron protocol28,29 and cultured for 21 d in vitro (DIV21) for lipidomic analyses. To confirm disease specificity of lipid changes, control (Con.) lines were transduced with (G4C2)92 repeat or (G4C2)2 control lentiviruses, and C9 lines were treated with a C9orf72 ASO or an NT control ASO7. Tech. rep., Technical replicate. b, Heatmap displaying all detected phospholipids as log2(fold-change) over controls for each experimental condition (n = 3 C9 lines, n = 2 control lines + lentiviruses, n = 3 C9 lines + ASO). Highly unsaturated species (four or more double bonds, outlined) were reduced in C9 lines and after lentivirus-(G4C2)92 treatment but increased in C9 lines treated with the C9 ASO compared with C9 lines treated with the NT ASO, indicating that these changes were driven by C9 repeats. The gray boxes indicate phospholipid species that were outside the fold-change range. c, Volcano plots of all detected phospholipid species in each line or condition compared with its control, displaying downregulation of highly unsaturated species (four or more double bonds). Values represent log2(fold-change) over control and significance (two-sided Student’s t-test) across all replicates within the labeled group. Top, color corresponding to the number of double bonds in the phospholipid species’ most unsaturated fatty acyl chain. Bottom, the highly unsaturated species (four or more double bonds) highlighted in blue.
Source data
Given our observation of conserved phospholipid saturation alterations in i3Neurons, we wondered whether this was being driven by an alteration in neuronal desaturase expression as observed in our C9 flies. We assayed RNA levels of FASN, as well as the four major neuronal lipid desaturases, SCD, SCD5, FADS1 and FADS2, in DIV21 i3Neurons, but found no significant changes in any of these genes compared with isogenic control lines at this timepoint (Extended Data Fig. 5b). This suggests that either desaturase expression is altered at an earlier timepoint than we assayed here or alternative upstream mechanisms are driving the observed lipidomic saturation shifts in C9 i3Neurons.
Altered phospholipid saturation in FTLD postmortem frontal cortex
We next asked whether phospholipid saturation dysregulation is also present in human disease tissue. We performed lipidomic analyses on postmortem affected (frontal cortex) and less affected (cerebellum) brain tissue from a large cohort of 47 individuals with neuropathologically confirmed FTD, termed frontotemporal lobar degeneration (FTLD), 15 of whom had a C9 mutation and 13 age- and sex-matched, healthy controls (Fig. 3a). In concordance with our fly and iPS cell-neuron data, in FTLD frontal cortex we observed a decrease in highly unsaturated phospholipids, particularly those containing four or more double bonds in their most unsaturated fatty acyl chain (Fig. 3b,c and Extended Data Fig. 6a,b), whereas lipid class proportionality was similar between control and FTLD tissue in both brain regions (Extended Data Fig. 6c,d). It is interesting that there was one exception, in species containing arachidonic acid (C20:4), some of which were upregulated in FTLD tissues. This is consistent with the association of arachidonic acid with inflammatory signaling30, highlighting additional lipid alterations that occur in end-stage disease, as well as a previous study showing elevated arachidonic acid in C9 repeat disease models31. These changes in highly polyunsaturated phospholipids were largely specific to the frontal cortex. In both tissue regions, we also observed a decrease in species containing linoleic acid (C18:2), an essential PUFA that is a precursor for highly unsaturated fatty acid species32. Thus, consistent with C9 flies and iPS cell neurons, FTLD postmortem brains displayed a reduction in highly polyunsaturated species, specifically in the affected region.

a, Lipidomics performed on postmortem tissues from FTLD and age- and sex-matched control frontal cortex and cerebellum samples. b, Heatmap displaying all detected phospholipids as log2(fold-change) over control in each brain region. Highly unsaturated species (four or more double bonds, except those containing C20:4) are outlined in cyan and show broad downregulation in FTLD frontal cortex but not cerebellum. Species containing arachidonic acid (C20:4) are outlined in red and many display upregulation in FTLD frontal cortex. Species containing linoleic acid (C18:2) are outlined in blue and show downregulation in both tissue regions. Cbl, cerebellum; F. Ctx, frontal cortex. c, Unsaturation indices of phospholipids from FTLD and control brain regions, demonstrating a significant reduction in frontal cortex but not in cerebellum (two-way ANOVA, main effects of brain region (P < 0.0001) and disease state (P = 0.0154); post-hoc comparisons of FTLD versus control P values adjusted with Šídák’s multiple-comparison test; n = 13 control and n = 45 FTLD frontal cortex; n = 13 control and n = 47 FTLD cerebellum samples from separate individuals). The bounds of the box represent the 25th and 75th percentiles, whereas the whiskers represent minima and maxima and the line the median. Schematic in a created using BioRender; Cammack, A. (2024) https://BioRender.com/b41l552.
Source data
Promoting neuronal fatty acid desaturation increases C9 fly survival
To determine whether dysregulated lipid metabolism directly contributes to neurotoxicity, we first asked whether dietary supplementation with fatty acids could rescue survival of C9 flies. The PUFAs linoleic acid (C18:2) and α-linolenic acid (C18:3) (Fig. 4a) significantly but modestly extended median survival of C9 flies by 12–15% (Fig. 4b,c and Extended Data Fig. 7a–c), whereas adding saturated or monounsaturated fatty acid species (palmitic acid (C16:0), stearic acid (C18:0) and oleic acid (C18:1)) had either no effect or decreased survival (Extended Data Fig. 7d–f). The extensions in survival generated by PUFA supplementation were specific to the disease model, because supplementing wild-type flies with linoleic acid or α-linolenic acid either decreased or had no effect on wild-type survival (Extended Data Fig. 7g,h). Furthermore, these rescues were not the result of an alteration in feeding behavior, as measured by the proboscis extension assay (Extended Data Fig. 7i,j).

a, Simplified fatty acid desaturation pathway. b,c, Dietary supplementation of linoleic (b) or α-linolenic (c) acid at 0.15 mM extended C9 fly survival (linoleic acid P = 5.687 × 10⁻⁵; α-linolenic acid P = 2.951 × 10⁻⁶, log-rank test; n = 152 (0 mM), n = 134 (0.15 mM C18:2), n = 141 (0.15 mM C18:3)). d, Neuronal overexpression of FAT-2 extended C9 fly survival (P = 5.119 × 10−38), log-rank test, n = 147 ((G4C2)36), n = 146 ((G4C2)36) + FAT-2. e, Volcano plot showing neuronal expression of FAT-2 resulting in conversion of C18:1 into C18:2 and C18:3 within C9 fly brain phospholipids (n = 3 biological replicates, with 20 fly brains per replicate). Values represent log2(fold-change) over control and significance (two-sided Student’s t-test) across all replicates within the labeled group. f, Schematic diagram of cold stress assay. g, C9 flies show sensitivity to cold stress, with significantly increased death and paralysis, and decreased recovery compared with uninduced controls (P < 0.0001). Neuron-specific overexpression of Desat1 or FAT-2 in C9 flies significantly increased the proportion of flies experiencing a full recovery compared with (G4C2)36 alone and significantly reduced death post-exposure compared with (G4C2)36 alone (n = 3 biological replicates, containing 15 flies per replicate). Results were analyzed by χ2 test. Data are presented as mean ± s.d. Genotypes: UAS-(G4C2)36; elavGS, UAS-(G4C2)36; elavGS/UAS-Desat1, UAS-(G4C2)36; elavGS/UAS-FAT-2. Schematic in f created using BioRender; Isaacs, A. (2025) https://BioRender.com/v04i884.
Source data
As the rescue with feeding PUFAs was modest, we next asked whether neuronal overexpression of fatty acid synthase or desaturase genes, which encode enzymes that produce and desaturate long-chain fatty acids, respectively (Fig. 4a), could prevent C9-associated neurodegeneration in vivo. We crossed our C9 flies to flies overexpressing lipid pathway genes, using the same adult neuronal driver as the C9 repeats, and measured survival. Although overexpression of the fatty acid synthase genes FASN1 and FASN2 resulted in survival extensions (Extended Data Fig. 8a–c), the most impressive rescues occurred when overexpressing fatty acid desaturases. Overexpression of Desat1, which introduces a double bond into the acyl chain of saturated fatty acids (for example, C18:0) to produce the monounsaturated fatty acid oleic acid (C18:1) significantly extended C9 fly survival, increasing median survival from 15 d to 25 d, an increase of 67% (Extended Data Fig. 8d). Linoleic acid (C18:2) and α-linolenic acid (C18:3) are termed essential fatty acids, because these species cannot be synthesized endogenously by most animals, including Drosophila and humans, and must be obtained from the diet to serve as precursors for generating more highly unsaturated PUFAs. However, the nematode Caenorhabditis elegans does possess fatty acid desaturases capable of endogenously synthesizing these essential PUFAs from more saturated precursors. Neuronal expression in C9 Drosophila of C. elegans FAT-2, a Δ12/Δ15 fatty acid desaturase that produces linoleic acid and α-linolenic acid from monounsaturated fatty acids33,34, provided an even greater rescue, extending median survival from 15 d to 27.5 d, an increase of 83% (Fig. 4d). We confirmed that both desaturases modified lipid saturation in the expected way, with Desat1 converting C18:0 to C18:1 (Extended Data Fig. 8e) and FAT-2 causing a marked conversion of C18:1 to C18:2 and C18:3 in C9 fly brains (Fig. 4e). Importantly, these genetic rescues were not the result of an effect on DPR levels, because poly(GP) levels in C9 fly heads were unchanged by overexpression of any lipid-related genes (Extended Data Fig. 8f,g).
Lipid saturation influences the biophysical properties of cellular membranes, particularly the packing of membrane phospholipids, with increased unsaturation resulting in an increase in membrane fluidity33,35,36. As membrane fluidity increases with temperature, poikilothermic Drosophila must adjust their membrane lipid content on temperature fluctuations to survive37,38. Indeed, Drosophila alter their feeding preferences in response to cold exposure to incorporate more PUFAs into their lipid bilayers to maintain their membrane fluidity38. Therefore, to investigate the mechanism by which neuronal desaturase expression is beneficial and whether membrane fluidity plays a role, we used a Drosophila cold-stress membrane fluidity paradigm. C9 flies were exposed to 4 °C for 18 h, which causes a cold-induced paralysis attributable to decreased membrane fluidity33,39,40, and then returned to room temperature, with recovery scored 1 h later (Fig. 4f). Whereas all nonrepeat-expressing control flies showed a full recovery after this period, 42% of flies expressing (G4C2)36 were dead and 54% were partially paralyzed, with only 2% exhibiting a full recovery (Fig. 4g). Strikingly, overexpressing either Desat1 or FAT-2 specifically in neurons prevented death entirely after cold exposure in C9 flies and resulted in a dramatically improved recovery (Fig. 4g). These data suggest that an increase in membrane fluidity contributes to the beneficial effect of neuronal desaturase overexpression.
We next asked whether loss of fatty acid synthesis or desaturation exacerbates neurodegeneration or is sufficient to induce neurodegeneration on its own. Knocking down FASN1 in neurons did not alter C9 fly survival, however, expressing a Desat1 hypomorphic mutant allele exacerbated toxicity in C9 flies, reducing survival and worsening tolerance in the cold-stress assay (Extended Data Fig. 8h–j). We then tested whether loss or overexpression of these genes can modify lifespan and neurodegeneration in wild-type flies. Knocking down FASN1 or Desat1 in eye neurons of wild-type flies using a GMR-GAL4 driver was not sufficient to induce neurodegeneration (Extended Data Fig. 8k,l) and FASN1 knockdown in all neurons did not significantly modify wild-type fly lifespan (Extended Data Fig. 8m), suggesting that loss of these genes is insufficient to induce neurodegeneration on its own. Similarly, overexpressing these genes in neurons of healthy control flies had either no effect on survival or increased survival by a much smaller magnitude than that observed in the context of C9 repeats (Extended Data Fig. 8n–q). Thus, neuronal fatty acid desaturation alterations appear to sensitize neurons to degeneration and, accordingly, promoting lipid desaturation within neurons is beneficial for ameliorating C9-associated neurodegeneration in vivo.
FAT-1 or FAT-2 rescue stressor-induced toxicity in C9 iPS cell neurons
We next investigated whether lipid desaturase overexpression can prevent C9-driven neurotoxicity in iPS cell neurons. We first sought to confirm in our i3Neuron system that desaturase overexpression is able to increase lipid unsaturation. FAT-1 is a C. elegans lipid desaturase which adds a double bond to ω-6 fatty acids to create the more highly unsaturated ω-3 species41. As expected, we observed that lentiviral expression of FAT-1 caused an increase in ω-3 fatty acids (for example, C20:5 and C22:6) and concomitant decrease in ω-6 species (for example, C20:4), both in the free fatty acid pool and in phospholipids (Extended Data Fig. 9a–e). FAT-2, as a Δ12/Δ15 fatty acid desaturase, creates both ω-3 and ω-6 species from less unsaturated precursors34. Accordingly, our lipidomic analysis revealed that FAT-2 overexpression in C9 i3Neurons resulted in substantial increases in the essential fatty acids linoleic acid (C18:2) and α-linolenic acid (C18:3), as well as their more highly unsaturated derivatives (for example, C20:4, C20:5 and C22:6), in both the free fatty acid and phospholipid classes (Extended Data Fig. 9a–e). Thus, desaturase overexpression is a potent augmenter of lipid unsaturation in vitro.
We then tested whether overexpression of desaturase genes could prevent C9-associated neurodegeneration in human C9 neurons. We overexpressed FAT-1, FAT-2 or a BFP-only control in C9 iPS-cell-derived spinal neurons (iPS cell-SNs) and then exposed them to high levels of glutamate to induce excitotoxicity (Fig. 5a). As previously reported10,42, C9 SNs exhibited heightened susceptibility to excitotoxic cell death compared with SNs derived from healthy donor iPS cells (Fig. 5b–d). Importantly, however, overexpression of either FAT-1 or FAT-2 was sufficient to partially rescue glutamate-induced toxicity, significantly decreasing cell death in C9 SNs compared with BFP-only control (Fig. 5b–d). Thus, desaturase overexpression is beneficial in preventing C9-associated neurodegenerative phenotypes in human C9 neurons.
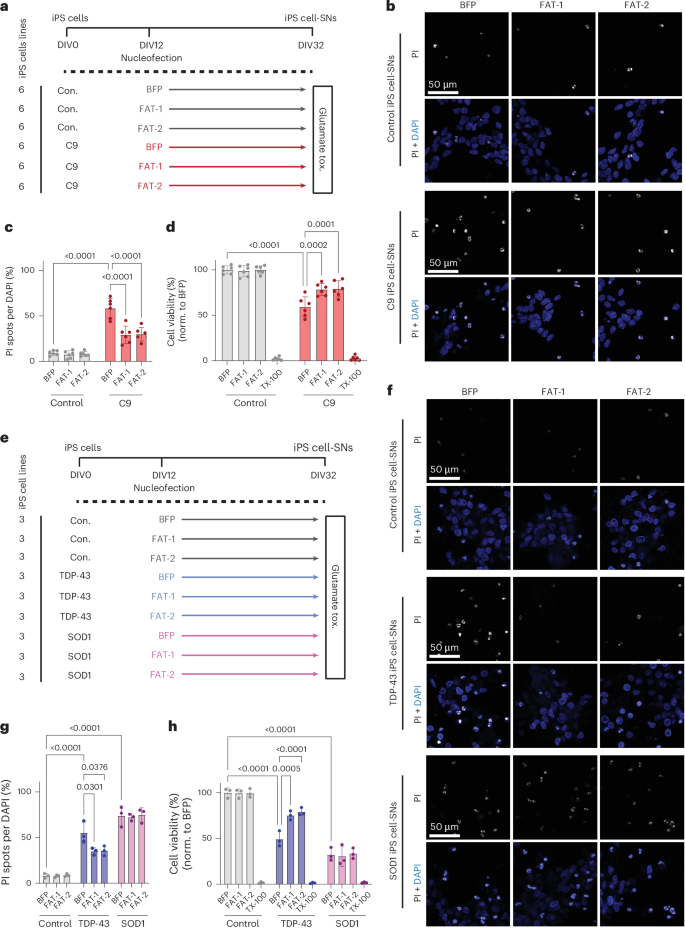
a, Schematic of SN differentiation timeline, with timepoints of nucleofection and glutamate-induced excitotoxicity measurements. tox., toxicity. b, Representative confocal images of cell death in control and C9orf72 iPS cell-SNs expressing BFP, FAT-1 or FAT-2, as measured by PI incorporation. c,d, Quantification of the ratio of PI-positive (c) spots to DAPI-positive (d) nuclei (quantification of cell death) and Alamar Blue cell viability assay after 4-h exposure to 10 µM glutamate (n = 6 lines per condition). norm., normalized. e, Schematic of glutamate-induced excitotoxicity assay in TDP-43 and SOD1 mutant lines. f, Representative confocal images of PI incorporation in control, TDP-43 and SOD1 iPS cell-SNs (n = 3 lines per condition). g,h, Quantification of PI incorporation (g) and Alamar Blue cell viability assays (h) after 4-h exposure to 10 µM glutamate. Datapoints for PI incorporation represent average percentage cell death across ten images per well. Datapoints for Alamar Blue assay represent average percentage viability from three replicate wells for each condition. Two-way ANOVA with Tukey’s multiple-comparison test was used to calculate statistical significance in c, d, g and h. Data are presented as mean ± s.d. throughout the figure.
Source data
Finally, we wondered whether the protective effect of desaturase overexpression might extend to other forms of ALS as well. To test this, we used our glutamate excitotoxicity assay on mutant TDP-43 or SOD1 iPS cell-SNs (Fig. 5e). In both disease groups, we observed heightened vulnerability to glutamate stress compared with control neurons (Fig. 5f–h). Overexpression of either FAT-1 or FAT-2 was able to partially rescue toxicity in TDP-43, but not SOD1 neurons (Fig. 5f–h). These results are consistent with the finding that lipid dysregulation is also found in sporadic ALS and FTLD (Fig. 3 and Extended Data Fig. 1c) and suggests that PUFA upregulation may be a common mechanism to combat stress that is protective in non-C9 ALS cases as well.
Discussion
In the present study, we uncovered lipid metabolism dysregulation in multiple models of C9 ALS/FTD, including transgenic Drosophila, iPS-cell-derived neurons and patient postmortem brain and spinal cord tissue of patients with ALS and FTD. We first identified transcriptional dysregulation of canonical fatty acid synthesis and desaturation genes, which was present at a predegeneration timepoint in C9 fly heads and was conserved in end-stage disease in ALS postmortem spinal cord tissue. Through lipidomic assays in C9 flies, iPS-cell-derived neurons and FTLD postmortem brains, we identified a loss of PUFA-containing phospholipids. In vitro, this was recapitulated by transduction of control neurons with 92 G4C2 repeats and prevented by treatment with a C9 ASO, demonstrating a disease-specific lipid signature. Importantly, promoting lipid desaturation through neuronal desaturase overexpression prolonged survival of C9 flies and rescued glutamate-induced excitotoxicity in C9 and TDP-43 patient iPS cell-SNs. C9 flies also displayed a dramatic defect in cold-stress recovery, a measure of impaired membrane fluidity, which was strongly reversed by neuronal desaturase overexpression. Together, this suggests a functional role for lipid unsaturation in modifying neurodegeneration in ALS/FTD.
Growing evidence links dysregulated lipid homeostasis to neurodegenerative diseases, including ALS/FTD. Several studies have shown altered levels of lipid species in postmortem tissue43, cerebrospinal fluid44,45 and blood46,47,48 of patients with ALS/FTD as well as ALS rodent models49. PUFAs have been specifically linked to ALS pathogenesis, with multiple epidemiological studies suggesting a protective role for dietary PUFAs in decreasing risk of developing ALS24,25,50. A recent study of plasma fatty acids from 449 patients with ALS revealed that higher levels of plasma α-linolenic acid (C18:3) at baseline are associated with prolonged survival and slower functional decline, whereas increased plasma linoleic acid (C18:2) and eicosapentaenoic acid (C20:5) were associated with a reduced risk of death during follow-up23. Linoleic acid and α-linolenic acid are essential PUFAs that must be obtained from the diet and serve as precursors for the highly unsaturated species arachidonic acid (C20:4), eicosapentaenoic acid (C20:5) and docosahexaenoic acid (C22:6)51. In the present study, we report that a wide range of PUFA-containing phospholipids are altered in C9 flies, iPS cell neurons and FTLD postmortem frontal cortex. It is interesting that in our fly experiments the effect appeared to be driven by repeat RNAs, rather than the highly toxic DPRs. This was surprising because the repeat RNA alone is not sufficient to drive neurodegeneration in flies9,52. This indicates that the presence of repeat RNA is sensitizing but that additional stressors are required to cause overt neurodegeneration. Consistent with this possibility, knockdown of the fatty acid desaturase Desat1 in wild-type flies was not sufficient to cause neurodegeneration on its own. This suggests that lipid saturation alteration is probably part of a ‘multistep’ disease process53, but importantly it is one that can be modulated to provide benefit. The mechanism by which repeat RNA leads to reduced phospholipid desaturation is not clear, but one possibility is that it could be driven by nucleocytoplasmic transport impairment, which could lead to mislocalization of master transcriptional regulators of lipid metabolism, such as sterol regulatory element-binding proteins or peroxisome proliferator-activated receptors, causing the widespread transcriptional dysregulation of lipid metabolism, with the resulting effects on lipid species reported here54,55,56. Although we see transcriptional changes that probably drive lipid changes in flies, it is possible that there are other triggers in the i3Neurons as well as sporadic ALS. For instance, alterations in lipid saturation could be a ‘lipid stress response’ to neurodegenerative insults. Our ‘DPR-only’ flies expressing 36 GR repeats exhibited an almost opposite brain lipid signature to that of RO flies and (G4C2)36 flies, with most PUFA-containing phospholipids appearing as increased compared with controls. As (GR)36 flies exhibit a highly aggressive neurodegenerative phenotype, it is still possible that they would also show reduced PUFA-containing phospholipids at earlier timepoints, although at this later disease stage surviving neurons that contain polyunsaturated phospholipids remain. This would be consistent with a loss of PUFAs sensitizing neurons to degeneration. A limitation of our study is the use of one Drosophila G4C2 repeat line, (G4C2)36, preventing us from assessing whether the number of repeats correlates with desaturation levels. Future work comparing lines with varying numbers of G4C2 repeats, inserted in the same locus, using the same driver and with otherwise genetically identical backgrounds, will help address this interesting question.
Our data fit well with the epidemiological evidence of PUFA levels and intake being protective in ALS, but crucially suggest that delivery of PUFAs to neurons is a key determinant of their protective function. We were able to study C9 lipid dysregulation specifically in neurons by using an inducible neuronal driver in Drosophila and employing pure neuronal cultures for lipidomic analyses. Using this approach, we observed a strikingly enhanced benefit of neuronal overexpression of desaturases in flies versus feeding PUFAs in the diet. To reach the brain, PUFAs need to pass the gut barrier, as well as the blood–brain barrier (BBB), and therefore the absolute quantities that reach neurons from the diet are unclear. A metabolic labeling study recently suggested that dietary sources account for 60–70% of the PUFAs in the mouse brain57. However, the efficiency of BBB transport varies for each fatty acid species58. This delivery issue may explain the differences in survival benefits observed between genetic overexpression of desaturases versus pharmacological supplementation of their fatty acid products, although we cannot rule out that dietary linoleic acid and α-linolenic acid may partially mediate their survival benefits through systemic actions. Furthermore, we have been able to show increased neuronal protection with increased unsaturation, demonstrating that any single gene in the lipid synthesis and desaturation pathway that can ultimately increase PUFAs in neurons can be beneficial; however, the extent of benefit is greater as one goes further down the pathway and increases the degree of unsaturation, with the benefit greatest with FAT-2, then Desat1, followed by FASN1 and FASN2.
Aging is a major risk factor for both ALS and FTD59,60. It is interesting that overexpression of either FASN1 or Desat1 in neurons also significantly increased wild-type fly lifespan (although to a lesser degree than in C9 flies), suggesting that this pathway may also be beneficial to aging neurons and warrants further investigation in this context. Furthermore, we observed lipid-related transcriptional dysregulation and decreased PUFA-containing phospholipids, not only in our C9 models but also in non-C9 ALS/FTD postmortem material. Although our data show that C9 repeats are sufficient to drive lipid saturation changes, there must be other parallel pathways that induce these changes in sporadic forms of the disease and aging-related changes are an obvious candidate. Taken together, impaired lipid metabolism is a common dysregulated pathway in ALS/FTD and it will now be important to investigate the different drivers of lipid-related changes.
Lipid saturation, along with fatty acyl chain length and head group composition, influences membrane physicochemical properties and physiological functions61,62. The role of unsaturated lipids in modulating membrane fluidity has been well described36,63,64,65,66,67. Our study explored membrane fluidity in a physiological paradigm by testing the ability of flies to recover from cold stress. Flies neuronally expressing (G4C2)36 were sensitive to cold stress, which was ameliorated by overexpressing either Desat1 or FAT-2 with the same neuronal driver, suggesting that these desaturase enzymes are fluidizing neuronal membranes. Future studies are now warranted to assess the role of neuronal membrane fluidity in neurodegeneration. In addition to altering membrane dynamics, other mechanisms may also be involved. For example, PUFAs can be de-esterified from membrane phospholipids and converted to bioactive signaling molecules known as oxylipins68,69,70,71. Elevated levels of arachidonic acid-derived oxylipins, called eicosanoids, have previously been reported in ALS motor neurons, whereas inhibiting their production through 5-LOX inhibition has been shown to rescue toxicity in the developing eye in a C9 Drosophila model31, thus highlighting another PUFA-related pathway that may contribute to disease.
Although we focus here on neuronal lipids, future work may benefit from expanding these studies to glial and co-culture paradigms to unpick the interplay between different cell types. Indeed, recent work demonstrated that reactive astrocytes secrete saturated fatty acids, which promote motor neuron degeneration in ALS models72,73,74,75, whereas astrocyte-specific knockout of ELOVL1, an enzyme responsible for producing long-chain saturated lipids, reduced astrocyte-mediated neuronal toxicity in vitro and in vivo72. These data are in line with our findings because they converge on the hypothesis that PUFAs are protective to neurons whereas saturated fatty acids are harmful, which further highlights an important role for lipid desaturation in ALS/FTD pathogenesis. Overall, the results presented in the present study identify dysregulated lipid metabolism as a direct contributor to neuronal toxicity in C9 ALS/FTD and suggest that modulating neuronal lipid saturation is a promising approach for ameliorating neurodegeneration.
Methods
Ethics statement
Patient iPS cell lines were collected with prior informed patient consent and derived from biopsied fibroblasts. Ethical approval was received from the National Healtlh Service (NHS) Health Research Authority East of England, Essex Research Ethics Committee (REC, reference no. 18/EE/0293). Brains were donated to the Queen Square Brain Bank (QSBB; UCL Queen Square Institute of Neurology) with full informed consent. Clinical and demographic data for all brains used in the present study were stored electronically in compliance with the 1998 Data Protection Act and are summarized in Supplementary Table 1. Ethical approval for the study was obtained from the NHS research ethics committee and in accordance with the human tissue authority’s code of practice and standards under license no. 12198. All cases underwent a pathological diagnosis for FTLD according to current consensus criteria76,77.
Drosophila maintenance
Drosophila stocks were maintained on SYA food (15 g l−1 of agar, 50 g l−1 of sugar, 100 g l−1 of autolysed yeast, 30 ml l−1 of nipagin (10% in ethanol) and 3 ml l−1 of propionic acid) at 25 °C in a 12-h light:dark cycle with 60% constant humidity. For RU486-induced experiments, food was supplemented with 200 µM RU486 (mifepristone). The elavGS stock was derived from the original elavGS 301.2 line78 and generously provided by H. Tricoire (CNRS, France)79. UAS-FASN1 and UAS-FASN2 lines were a gift from J. Montagne (Université Paris-Sud)80. The UAS-FASN RNAi line was obtained from Vienna Drosophila Resource Center (VDRC, cat. no. v29349). The w1118 line (BDSC, cat. no. 3605), GMR-GAL4 line (BDSC, cat. no. 9146) and UAS-Desat1 RNAi line (BDSC, cat. no. 37512) were obtained from the Bloomington Drosophila Stock Center (BDSC). The UAS-Desat1 (DGRC, cat. no. 118679), UAS-FAT-2 (DGRC, cat. no. 118682) and UAS-Desat1(42) (DGRC, cat. no. 118681) lines were obtained from the Kyoto Drosophila Stock Center33. The UAS-(G4C2)36, RO and (GR)36 stocks have been previously described9,27. All stocks were backcrossed to either a w1118 strain or v-w1118 stock for six generations before use in experiments. Stocks used in the present study are listed in Supplementary Table 2.
Fatty acid supplementation to Drosophila food
Fatty acids were added to SYA food, along with 200 µM RU486 (Sigma-Aldrich), although it was still liquid but had cooled to 50 °C. The food was mixed thoroughly with an electric handheld blender, before dispensing into individual vials. Fatty acids used were palmitic acid (Merk, cat. no. W283215), stearic acid (Thermo Fisher Scientific, cat. no. 10002390), oleic acid (Merck, cat. no. W281506), linoleic acid (Merck, cat. no. 436305) and α-linolenic acid (Merck, cat. no. L2376).
Drosophila behavioral and lifespan assays
Lifespan assays
The parental generation of experimental crosses was allowed to lay for 24 h on grape-agar plates supplemented with yeast paste. Eggs were washed briefly in 1× phosphate-buffered saline (PBS), pH 7.4 before being dispensed into bottles using a pipette at a standard density (20 µl of eggs in PBS, approximately 300 eggs). Then, 2-d post-eclosion flies were allocated to experimental vials at a density of 15 flies per vial. Deaths were scored and flies tipped on to fresh food at least 3× a week. All lifespans were performed at 25 °C on mated females.
Drosophila eye phenotype analysis
Flies carrying the UAS-FASN1 RNA interference (RNAi) or UAS-Desat RNAi construct were crossed to GMR-GAL4 flies at 25 °C. Then 2-day-old adult F1 female flies were used, with one eye per fly imaged using a stereomicroscope. All images were obtained under the same magnification; eye area was calculated from each image using Fiji.
Assessment of Drosophila feeding
The 2-day-old mated female flies were transferred to SYA food containing 200 μM RU486 or ethanol vehicle control with PUFAs at a density of five per vial on the evening before the assay, with between seven and nine replicate vials per experimental group. Vials were coded and placed in a randomized order in rows on viewing racks at 25 °C overnight. The next day, observations were performed ‘blind’ for 90 min, commencing 1 h after lights on and 30 min after the arrival of the observer to the room. In turn, each vial was observed for approximately 5 s, during which the number of flies feeding was noted. A feeding event was scored when a fly had its proboscis extended and touching the food surface while performing a bobbing motion. Once all vials in the experiment had been scored, nine additional rounds of observations were carried out in the same way for the whole 90 min. At the end of the assay, the vial labels were decoded and the feeding data expressed as a proportion by experimental group (sum of scored feeding events divided by total number of feeding opportunities, where total number of feeding opportunities = no. of flies in vial × no. of vials in the group × no. of observations)81. For statistical analyses, comparisons between experimental groups were made on the totals of feeding events by all flies within a vial, to avoid pseudoreplication.
Cold-stress recovery assay
Drosophila were induced on SYA medium containing 200 µM RU486 or ethanol vehicle control for 7 d, before exposure to 4 °C for 18 h to cause a cold-induced paralysis response. At the end of this period, lies were moved to room temperature for 1 h and recovery was assessed39. The number of flies exhibiting a full recovery (walking), partial recovery (partial paralysis) or death were quantified and expressed as a percentage of the total. The results were analyzed using the χ2 test.
Drosophila RNA-seq
Adult female flies were induced on SYA medium containing 200 µM RU486 or ethanol vehicle control for 5 d and subsequently snap frozen. Total RNA was isolated from 15 heads per replicate using TRIzol, and the experiment was performed in quadruplicate. RNA-seq was performed with an Illumina NextSeq2000, using 16 million paired-end reads per sample and 100-bp read length. Raw sequence reads were aligned to the Dm6 reference genome. DESeq2 (default parameters) was used to perform differential expression analysis (DEGs provided in Supplementary File 2). The ‘runTest’ function from the topGO package (v.2.53.0)82 was used to perform GO enrichment analysis on DEGs (log2(fold-change) > 0.58). The ‘weight01’ algorithm and ‘fisher’ statistic were used when running topGO. The ‘GenTable’ function was used to generate a table with the top biological process GO terms. Plots with topGO terms were plotted using ggplot2 (v.3.4.2). We generated a heatmap for topGO terms showing the percentage of significant DEGs among all genes of a GO term expressed in a dataset using the pheatmap function from the pheatmap package (v.1.0.12, https://CRAN.R-project.org/package=pheatmap).
RT–qPCR
Total RNA from fly heads was extracted from 15 heads per replicate, as above. Total RNA from i3Neurons was extracted from one well of a six-well plate per technical replicate using the using the Promega ReliaPrep RNA Cell Miniprep System using the manufacturer’s protocol, including DNase I digestion.
For reverse transcription (RT) in fly head samples, approximately 1 μg of RNA per sample (10.6 µl) was incubated with 2 µl of TURBO DNase (Thermo Fisher Scientific) and 1.4 µl of TURBO DNase buffer (Thermo Fisher Scientific) at 37 °C for 15 min. After this, the reaction was inhibited with addition of 2 µl of EDTA to a final concentration of 3.4 mM, followed by incubation at 75 °C for 5 min. Then 2 µl of 0.5 µg µl−1 of oligo dT and 2 µl of dNTP mix (10 mM stock made from individual 100 mM dNTP stocks, Invitrogen) were added to each sample followed by a 5-min incubation at 65 °C. After this, samples were placed on ice. To each reaction, the following was added: 8 µl of 5× first-strand buffer, 8 µl of 25 mM MgCl2, 4 µl of 0.1 M dithiothreitol, 2 µl of RNaseOut RNase inhibitor (40 units µl−1) and 1 µl of SuperScript II reverse transcriptase (Invitrogen). Samples were incubated at 42 °C for 50 min, then heat inactivated at 70 °C for 15 min. Quantitative (q)PCR was performed using the QuantStudio 6 Flex Real-Time PCR System (Applied Biosystems) using SYBR Green master mix (Applied Biosystems). Relative messenger RNA levels were calculated relative to αTub84B expression by the comparative Ct method. Primer sequences used are described in Supplementary Table 3.
Reverse transcription from i3Neuron samples was carried out with SuperScript IV Vilo (Thermo Fisher Scientific), using the manufacturer’s protocol and 75 ng of total RNA per technical replicate. Then qPCR was performed with the LightCycler 480 and SYBR Green master mix. Relative mRNA levels were calculated relative to glyceraldehyde 3-phosphate dehydrogenase (GAPDH) expression using the comparative Ct method. All primer pairs were from the predesigned catalog from IDT and were confirmed to have 90–110% efficiency in our hands with i3Neuron complementary DNA: GAPDH (Hs.PT.39a.22214836), FASN (Hs.PT.58.38567473), SCD (Hs.PT.58.45714389), SCD5 (Hs.PT.58.40730206), FADS1 (Hs.PT.4716384) and FADS2 (Hs.58.15091651).
DPR MSD immunoassays
Drosophila head protein preparation
Adult female flies were induced on SYA medium containing 200 µM RU486 or ethanol vehicle control for 7 d and subsequently 10 heads per sample were homogenized in 100 μl of 2% sodium dodecylsulfate (SDS) buffer (Merck, cat. no. 428018) containing 1× radioimmunoprecipitation (RIPA) buffer (Sigma-Aldrich, cat. no. R0278) and complete mini EDTA-free protease inhibitor cocktail (Roche, cat. no. 11836170001) at room temperature for 30 s until the heads were no longer intact. Samples were then heated at 95 °C for 10 min. After centrifugation at 18,400g for 20 min at room temperature, the supernatants were collected in the new tubes. The protein concentration was determined using Pierce BCA Protein Assay Kit (Thermo Fisher Scientific, cat. no. 23325) according to the manufacturer’s manual.
Protein preparation of i3Neurons
The i3Neuron replicates for DPR Meso Scale Discovery (MSD) were collected alongside those used for lipidomic analyses from the same neuronal inductions. One well of a six-well plate was used per replicate for MSD. At DIV21, neurons were lifted with PBS, centrifuged and pelleted at 1,500g for 5–10 min, snap frozen on dry ice and stored at −80 °C until use. For protein preparation, cell pellets were resuspended in 200 μl of 2% SDS buffer (Thermo Fisher Scientific, cat. no. BP2436-200) containing 1× RIPA buffer and cOmplete mini EDTA-free protease inhibitor cocktail and sonicated 2× for 10 s at 30 A and 4 °C. Sonicated samples were centrifuged at 17,000g for 20 min at 16 °C, after which supernatants were collected and used in MSD assays.
Running MSD assays
Samples were diluted to the same concentration with homogenization buffer and 25 μl (fly samples) or 90 µl (cell samples) was loaded in duplicate on to the 96-well MSD immunoassay plate. Singleplex MSD immunoassays to measure poly(GA) or poly(GP) levels were previously validated83. The following antibodies were used: anti-poly(GP) (GP658, custom-made from Eurogentec, 2 µg ml−1) and anti-poly(GA) (Merck Millipore, clone 5E9, cat. no. MABN889, 1 µg ml−1) as capture antibodies, and biotinylated anti-poly(GP) (GP658*, 1 µg ml−1) and biotinylated anti-poly(GA) (GA5F2*, kindly provided by D. Edbauer (Ludwig-Maximilians-Universität, Munich), biotinylated in house, 1 µg ml−1) as detector antibodies. Plates were read with the MSD reading buffer (cat. no. R92TC) using the MSD Sector Imager 2400. A four-parameter logistic regression curve was fit to the values obtained from a standard curve using GraphPad Prism and concentrations were interpolated. Signals correspond to the intensity of emitted light on electrochemical stimulation of the assay plate. Before analysis, the average reading from a calibrator containing no peptide was subtracted from each reading.
Differentiation of i3Neurons
C9 patient and isogenic control iPS cell lines were kind gifts of the Chandran laboratory at the University of Edinburgh42 and C9 repeat knock-in lines on the KOLF2.1J background were a gift from the Skarnes laboratory at Jackson Labs as part of the iPS cell Neurodegenerative Disease Initiative84,85 (line details in Supplementary Table 4). From these, we generated i3-compatible iPS cell lines via piggyBac-integration of a BFP-containing, doxycycline-inducible Neurogenin2 (Ngn2) minigene (kind gift of M. Ward, NIH). After integration, iPS cells were subsequently doubly selected with puromycin and FACS, resulting in a pure population of stably expressing iPS cells. These i3iPS cells were then used for rapid differentiation into cortical neurons (i3Neurons) using a previously described method28,29. Briefly, i3iPS cells were grown to 70–80% confluency, washed with PBS, lifted with Accutase (Gibco) and plated at 375,000 cells per well in a 6-well plate on to Geltrex-coated plates (DIV0). Cells were maintained from DIV0–3 in an induction medium consisting of Dulbecco’s modified Eagle’s medium (DMEM-F12; Gibco), 1× N2 (Thermo Fisher Scientific), 1× Glutamax (Gibco), 1× Hepes (Gibco), 1× nonessential amino acids (Gibco), doxycycline (2 µg ml−1) and 10 µM Y-27632 (DIV0 only; Tocris), which was exchanged daily. On DIV3, cells were dissociated with accutase and replated on to poly(l-ornithine)- (Merck) or poly(ethylenimine)- (Sigma-Aldrich) and laminin- (Sigma-Aldrich) coated 6-well plates at 600,000 cells per well in neuronal maintenance medium consisting of Neurobasal medium (Gibco), supplemented with 1× B27 (Gibco), 10 ng ml−1 of brain-derived neurotrophic factor (PeproTech), 10 ng ml−1 of NT-3 (PeproTech) and 1 µg ml−1 of laminin. From DIV3 to DIV21, cells were maintained in neuronal maintenance medium, with one-third medium changes once weekly. Lentiviral transduction to overexpress (G4C2)92 or (G4C2)2 was done 1 h after DIV3 replating. Likewise, ASO treatments to target the C9orf72 sense strand or an NT control were also begun on DIV3 and supplemented in medium changes thereafter. In brief, 1 h after replating, ASOs were transiently transfected using Lipofectamine Stem (Invitrogen, cat. no. STEM00015) at 5 μM final concentration according to the manufacturer’s protocol. Then 1 d after ASO treatment, a full medium change was done to remove remaining Lipofectamine Stem and replaced with neuronal maintenance medium containing 5 μM ASO, which was then further re-supplemented in weekly medium changes at 5 μM. ASOs were published in ref. 7 and have fully modified phosphorothioate backbones. The sequences are as follows, with the five 2ʹ-O-methyl RNA base-pairs on either end (italicized):
C9 sense targeting: UACAGGCTGCGGTTGUUUCC
NT: CCUUCCCTGAAGGTTCCUCC
(G4C2)92 or (G4C2)2 lentiviral construct subcloning
The pCDH-EF1-MCS-IRES-copGFP lentiviral plasmid (System Biosciences) was used as the backbone to create (G4C2)92 and (G4C2)2 lentiviral constructs. Subcloning to insert the repeats was undertaken in a two-step process. First, we synthesized a DNA fragment consisting of a customized multiple cloning site (MCS) sandwiched in between 300 bp each of repeat-adjacent upstream and downstream sequences from C9orf72 intron 1 and then inserted into the internal MCS of pCDH-EF1-MCS-IRES-copGFP with InFusion cloning (Takara Bio) in between XbaI and NotI restriction sites. This interim construct, termed ‘pCDH-EF1-C9up-MCS-C9down-IRES-copGFP’ was verified with diagnostic restriction digests and Sanger sequencing across the insert. Then, to create the (G4C2)92 construct, a 92-repeat sequence was isolated from a previously verified in-house construct with NheI and NotI restriction digests and subcloned into the MCS of pCDH-EF1-C9up-MCS-C9down-IRES-copGFP with overnight ligation at 4 °C (T4 ligase, NEB). To maintain repeat stability, bacterial clones were grown at room temperature, in half the standard ampicillin concentration (0.5 mg ml−1), and in low-salt lysogeny broth (Sigma-Aldrich). A repeat-stable clone was selected and subsequently maxi-prepped (QIAGEN) for use in lentiviral production. Thus, the final construct consisted of 92 repeats immediately surrounded on either side by 300 bp of endogenous C9orf72 intronic sequence to facilitate RAN translation and upstream of an IRES-copGFP sequence for fluorescent visualization of transduction efficiency. To create the (G4C2)2 control lentiviral constructs, two complementary short oligos were synthesized containing two G4C2 repeats and NheI and NotI restriction site overhangs. Oligos were resuspended in annealing buffer (NEB buffer 2.1), heated to 95 °C and allowed to cool slowly to room temperature to anneal. Annealed oligos were used directly in ligation reactions into pCDH-EF1-C9up-MCS-C9down-IRES-copGFP with the same protocol as used for the 92-repeat construct.
Lentiviral production
HEK293T cells were grown at 37 °C and 5% CO2 in T175 flasks. At ~70% confluency, cells were transfected with either (G4C2)92 or (G4C2)2 lentiviral transfer plasmids along with PAX (Addgene, cat. no. 12260) and vesicular stomatitis virus G (Addgene, cat. no. 12259) lentiviral packaging plasmids with Lipofectamine 3000 Transfection Reagent (Invitrogen) according to the manufacturer’s protocol. After 48 h, medium was collected and centrifuged at 500g for 10 min at 4 °C to remove cell debris, after which Lenti-X Concentrator (Takara Bio) was added at a 1:3 ratio. After a minimum incubation of 24 h at 4 °C, the concentrator-medium mix was centrifuged at 1,500g and 4 °C for 45 min and the resulting concentrated lentiviral pellet was resuspended in sterile PBS, aliquoted and stored at −80 °C until use.
Targeted lipidomics of Drosophila brains, human i3Neurons and postmortem brain samples
Sample collection
Adult female flies were induced on SYA medium containing 200 µM RU486 or ethanol vehicle control for 7 d. 60 flies per condition were dissected in PBS on ice, with 20 brains per biological replicate. The brains were collected in 300 µl of PBS and centrifuged at 375g for 5 min at 4 °C. Then, 200 µl of supernatant was removed and samples were homogenized before fast-freezing on dry ice. Samples were stored at −80 °C until analysis. For i3Neurons, at DIV21 cells were pelleted and stored at −80 °C until analysis. Postmortem brain samples were from pathologically diagnosed cases of FTLD without C9orf72 expansion (n = 32), FTLD with C9orf72 expansion (n = 15) and neurologically normal controls (n = 13). One sample from a non-C9 FTLD patient was included twice as a technical replicate. Frontal cortex gray matter and cerebellum were dissected from each brain and stored at −80 °C until analysis.
Targeted lipidomic measurements
Comprehensive targeted lipidomics was accomplished using a flow-injection assay based on lipid class separation by differential mobility spectroscopy and selective multiple reaction monitoring (MRM) per lipid species (Lipidyzer platform, SCIEX). A very detailed description of lipid extraction, software and the quantitative nature of the approach can be found elsewhere86,87,88. In short, after the addition of >60 deuterated internal standards (ISs), lipids were extracted using methyl tert-butyl ether. Organic extracts were combined, dried under a gentle stream of nitrogen and reconstituted in running buffer. Lipids were then analyzed using flow injection in MRM mode employing a Shimadzu Nexera series HPLC and a Sciex QTrap 5500 mass spectrometer. For the internal calibration, deuterated IS lipids for each lipid class were used within the lipidomics workflow manager. Each lipid species was corrected by the closest deuterated IS within its lipid class and afterwards the obtained area ratio was multiplied by the concentration of the IS.
Analyses of targeted lipidomic datasets
Filtering and normalizations
Raw amounts of individual lipid species were obtained from the Lipidyzer platform as above and subsequently filtered and normalized. Datasets were first filtered for low-abundance and undetected lipid species. To pass filtering, a lipid species must be detected in at least 80% of all samples in the analysis or in 60% of samples in any one group, and must also be at least twofold above the average of the blanks. After filtering, missing sample values were imputed as the median of other samples in their group; this step was found to be necessary for subsequent normalizations, because missing values greatly skewed the proportional datasets. Next, filtered and imputed datasets were normalized either to total lipids (for analysis of class-level lipid alterations, as in Extended Data Figs. 5a and 6c,d) or by lipid class individually (as in Figs. 2b,c and 3b,c and Extended Data Fig. 3a–e). Thus, these processing steps result in proportional lipidomic measurements, relative to either the total lipidome or total amount of lipid within each class, respectively.
Fold-changes in Drosophila brains
Biological replicates for these analyses contained 20 fly brains per condition. Each replicate was filtered and normalized individually by lipid class and then fold-changes and significance were calculated as the average of either C9/RO/GR36 over the average of the control (w1118) or (G4C2)36 + Desat1 /(G4C2)36 + FAT-2 over the average of (G4C2)36, using lipid class-normalized data.
Fold-changes in i3Neurons
For comparisons of C9 lines to their isogenic controls, we defined biological replicates as individual iPS cell lines and employed three separate C9 lines for lipidomic analysis. Technical replicates were defined as individual wells that were grown, collected and analyzed separately. To ensure reproducibility, technical replicates were collected across multiple neuronal inductions, and each lipidomic dataset was normalized to the average of the control condition within induction. For our main analysis, we compared each line with its own isogenic control, using technical replicates across inductions for statistical analysis and displayed the results for each individual line separately (Fig. 2c and Extended Data Fig. 3b,c). To demonstrate reproducibility across inductions, we also show fold-change from each individual neuronal induction separately in Extended Data Fig. 3a. The same rationale and analysis were applied to the ASO experiments, but rather comparing C9 ASO-treated lines with their own NT ASO-treated conditions, again with normalizations within induction (Fig. 2c and Extended Data Fig. 3d,e). For the 92-repeat lentiviral experiments, because this is an exogenous overexpression paradigm, we instead defined biological replicate units as individual neuronal inductions and performed three separate inductions for lipidomic analyses. Two of these inductions were done with control line 1 and the other with control line 2. For our main analysis in Fig. 2c, we then combined and compared technical replicates across the three inductions between 92-repeat and 2-repeat treated conditions; however, to demonstrate reproducibility across inductions, we also show fold-changes from each neuronal induction separately in Extended Data Fig. 3a. All i3Neuron lipidomic datasets are publicly available in user-friendly format at https://neurolipidatlas.nl, where any user can view and analyze each experiment, with full statistical analysis, either by induction separately or by all technical replicates combined by line or treatment condition.
Fold-changes and unsaturation indices in postmortem brain samples
Fold-changes in FTLD versus control samples, as used in the heatmap in Fig. 3b, were calculated for each lipid species separately as the average of the FTLD condition over the average of the control condition, using lipid class-normalized data. To calculate the unsaturation index in Fig. 3c, a composite score was calculated for each sample individually, using the ratio of the sum of phospholipid species with four to six double bonds in their most highly unsaturated fatty acyl chain over the sum of species with zero to three double bonds, after lipid class normalization. Each individual was considered a separate biological replicate and two-way analysis of variance (ANOVA) was used to calculate statistical significance across the two brain regions and between the FTLD and control. Normality tests were performed for each group with D’Agostino and Pearson’s test which determined each group to be normally distributed (α = 0.05).
Glutamate-induced excitotoxicity assays in iPS cell-SNs
Subcloning for BFP, FAT-1 and FAT-2 overexpression constructs
The mTagBFP (Addgene, cat. no. 89685), FAT-1 (Genscript) and FAT-2 (Genscript) cDNAs were amplified with PCR and subcloned into the pHR-hSyn-eGFP vector (Addgene, cat. no. 114215), along with a T2A-NLS-mApple minigene for fluorescent visualization. In brief, enhanced green fluorescent protein (eGFP) was removed with BamHI and NotI (NEB) and BFP/FAT-1/FAT-2 and T2A-NLS-mApple fragments were inserted with InFusion cloning (Takara Bio), as per the manufacturer’s protocol. The resulting plasmids were verified with diagnostic restriction digest and Sanger sequencing before being maxi-prepped (QIAGEN) for subsequent use in excitotoxicity assays.
Excitotoxicity assays
Non-neurological control and C9orf72 iPS cells were obtained from the Answer ALS repository at Cedars Sinai (see Supplementary Table 5 for demographics) and maintained in mTeSR Plus medium at 37 °C with 5% CO2. The iPS cell-SNs were differentiated according to a modified diMNs protocol56,89,90,91 and maintained at 37 °C with 5% CO2. The iPS cells and iPS cell-SNs were routinely tested negative for Mycoplasma. On day 12 of differentiation, iPS cell-SNs were dissociated with trypsin; 5 × 10⁶ iPS cell-SNs were nucleofected with 4 µg of plasmid DNA in suspension. After nucleofection, 100 µl of cell suspension was plated in each well (total of 6 wells per cuvette) of a glass-bottomed or plastic 24-well plate for propidium iodide (PI) and Alamar Blue toxicity and viability experiments, respectively. Medium was exchanged daily for a total of 20 d to facilitate the removal of iPS cell-SNs that failed to recover post-nucleofection. On the day of the experiment (day 32 of differentiation), iPS cell-SN medium was replaced with artificial cerebrospinal fluid solution containing 10 µM glutamate. For those iPS cell-SNs undergoing Alamar Blue viability assays (plastic dishes), Alamar Blue reagent was additionally added to each well according to the manufacturer’s protocol at this time. After incubation, iPS cell-SNs for PI cell death assays were incubated with PI and NucBlue live ready probes for 30 min and subjected to confocal imaging. The number of PI spots and nuclei were automatically counted in Fiji. Alamar Blue cell viability plates were processed according to the manufacturer’s protocol. As a positive control, 10% Triton X-100 was added to respective wells 1 h before processing.
Statistics and reproducibility
The statistical test used for each experiment is indicated in the figure legends. The log-rank tests for fly survival were performed in Microsoft Excel (template described in ref. 92). ANOVA or Student’s t-test analyses were performed in GraphPad Prism v.10.0.2. For all statistical tests, P < 0.05 was considered significant. Data distribution was tested for normality only where specifically stated in Methods, otherwise data distribution was assumed to be normal, but this was not formally tested. No statistical methods were used to predetermine sample sizes but our sample sizes are similar to those reported in previous publications9,52,90 and are listed in the figure legends for each experiment. For fly survival assays, roughly n = 150 flies were used per condition. For iPS cell-neuron experiments, the number of lines used is listed in Supplementary Tables 4 and 5 and, for lipidomics, the individual inductions are shown separately in Extended Data Fig. 3a. For human postmortem brain lipidomic experiments, there were n = 13 control and n = 45 FTLD frontal cortex samples, and n = 13 control and n = 47 FTLD cerebellum samples. Experimental groups were determined by genetic status and not randomized. Data collection and analysis were not performed blind to the conditions of the experiments unless specifically stated in Methods. No datapoints were excluded from the analyses.
Reporting summary
Further information on research design is available in the Nature Portfolio Reporting Summary linked to this article.
Responses