A Chromosome-level genome assembly of the American bullfrog (Aquarana catesbeiana)
")
Background & summary
Aquarana catesbeiana, commonly known as bullfrog, belongs to the class Amphibia, order Anura and family Ranidae. Native to North America, this species has undergone significant evolutionary adaptations, allowing it to thrive across diverse landforms and climatic conditions1. It has become a highly successful invasive species, expanding to over, 40 countries across four continents and contributing to the decline of indigenous species across multiple taxonomic categories2. Furthermore, bullfrog meat is considered a delicacy in many regions, driving increased global consumption3,4,5,6,7.
As a representative species of the order Anuran, the American bullfrog plays important roles in various fields of study, from developmental biology and physiology to ecology and evolution8,9. Previous studies utilised anuran species (frogs) to exhibit a wide range of sex chromosome differentiation stages as they exhibit diverse sex-determination systems and varying stages of sex chromosome differentiation, both between and within species10,11,12,13. Therefore, they serve as suitable candidates for investigating sex chromosome evolution and diversity13. Moreover, frogs display significant variation in genome size14,15, with sequenced species ranging from Platyplectrum ornatum (1.06 Gb)16 to Bombina bombina (9.8GB)17, making them ideal models for studying genome size evolution15.
To facilitate ecological, evolutionary and functional genomic studies, high-quality genome assemblies are essential. In 2017, a draft genome of A. catesbeiana was published, featuring a scaffold N50 of 51.6 Kb and 45.3% complete BUSCOs8. While these data provided valuable insights, the poor quality of the assembly limited its broader applicability. In the present study, we generate a chromosome-level genome assembly for the American bullfrog using integrated datasets from Pacific Biosciences (PacBio) HiFi reads, MGI short reads and Hi-C reads. This high-quality assembly will significantly advance research on the unique characteristics of frogs.
Methods
Sample collection
Tissue samples were collected from a female American bullfrog (Fig. 1) bred at the Qingyuan Yangshan breeding base, Zhongyang Group, Guangdong Province. Approximately 10 g of muscle tissue was extracted from this individual for whole-genome sequencing, including short-read, long-read and Hi-C sequencing. Additionally, multiple tissues were collected for transcriptome sequencing. Samples included intestines, lungs, vas deferens, liver, muscles, stomach and eyes, with approximately 1 g of each tissue collected. All tissue samples were fragmented, rapidly cooled with liquid nitrogen and stored at −80 °C for future use. The sample collection protocol was approved by the Animal Ethics Committee of Zhongkai University of Agriculture and Engineering (Guangzhou, China).
")
The full-body appearance of the American bullfrog. (A–C) Female. (D–F) Male. (A,D) Lateral anterior view. (B,E) Dorsal view. (C,F) Ventral supine view.
DNA extraction and genome sequencing
Genomic DNA (gDNA) was extracted from muscle tissue using the Qiagen Blood & Cell Culture DNA Kit (Qiagen, USA). The gDNA was randomly fragmented, and 1.5 µg was used to construct a 350-bp insert-size library with the MGIEasy Universal DNA Library Prep Set (MGI, China). Sequencing was performed on the MGISEQ2000 platform (MGI, China), generating 322.27 Gb of paired-end raw reads (150 bp). After filtering the raw reads using SOAPnuke (v2.1.0)18 to remove adaptors and low-quality sequences, 324.64 Gb of clean reads were obtained and used for genome size estimation and assembly.
For long-read sequencing, 2 µg of gDNA was used to create libraries following PacBio’s HiFi sequencing protocol (Pacific Biosciences, USA) with the SMRTbell Express Template Prep Kit 2.0. Sequencing was carried out on the PacBio Sequel II System, generating approximately 10.32 million consensus reads (156.21 Gb) with an average read length of 15.128 kb, processed using CCS software (SMRT Link v9.0)19 (-min-passes 1–min-rq 0.99–min-length 100).
Hi-C sequencing was performed on muscle tissue (~1 g) from the same female individual. Libraries were constructed using the GrandOmics Hi-C Kit (GrandOmics, China) with DpnII as the restriction enzyme. Sequencing was carried out on the Illumina NovaSeq platform (paired-end reads, 150 bp), yielding 711.68 Gb of raw reads. After quality filtration using fastp20, eliminating low-quality reads (quality scores <20) and those shorter than 30 bp, 697.99 Gb of high-quality reads (98.76% of the initial reads) were obtained for constructing pseudo-chromosomes.
RNA extraction and transcriptome sequencing
RNA was extracted from tissue samples using the standard Trizol protocol, followed by purification with the Qiagen RNeasy Mini Kit (Qiagen, USA). cDNA libraries were constructed following Illumina’s guidelines, and sequencing on the HiSeq X Ten platform (Illumina, USA). Finally, approximately 52 Gb of transcriptome data were generated. These data were used to support genome assembly and annotation.
Genome size estimation
To genome size of the American bullfrog was estimated using a K-mer-based21 analysis method. The frequency of 17-mers was calculated using the GCE software22 (v1.0.2). The genome size (G) was determined by the formula G = K_num/K_depth, where K_depth represents K-mer depth and K_num is the total number of 17-mers. A BLASTN (v2.7.1)23 alignment against the NT database confirmed the absence of significant exogenous contamination in the library data. The estimated genome size was approximately 5.81 Gb, with an estimated genome heterozygosity of 0.51% (Fig. 2a).
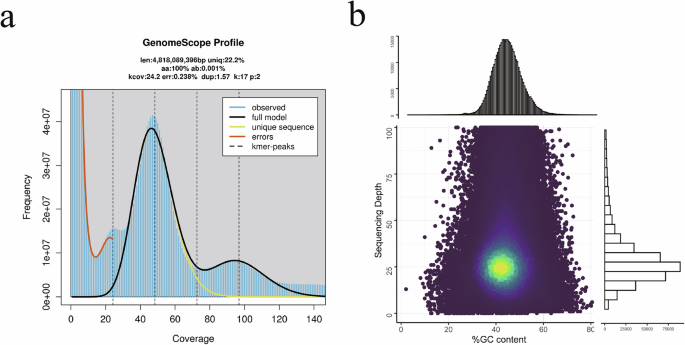
Genome assessment of the American bullfrog. (a) A GenomeScope K-mer plot. (b) GC-depth plot. The x- and y-axis represent GC content and sequencing depth, respectively, and the corresponding histograms are displayed along the top and right axes.
De novo genome assembly
After obtaining subreads, we used the assembly software hifiasm (v0.16.1)24 to perform reference-free de novo assembly of long reads from the pacbio platform’s SMRT sequencing, using default parameters. Error correction was performed using racon (v1.4.3)25, gcpp (v2.0.2) (https://github.com/PacificBiosciences/gcpp) and pilon (v1.22)26, which utilised MGI short reads. The initial genome assembly size was 6.37 Gb, aligning with the previously estimated genome size. Various evaluation methods were applied to assess the quality of the assembly.
Pseudo-chromosome construction
Hi-C technology was used to construct pseudo-chromosomes based on high-quality genome assembly. Trimmomatic software (LEADING:3 TRAILING:3 SLIDINGWINDOW:4:15 MINLEN:15)27 was employed to remove sequencing low-quality fragments and adapters. We aligned the retained data to the draft assembly using Juicer (baw: -SP5M)28, filtering out low-quality and redundant reads. Interaction maps were created using 3D-DNA software (Fig. 3a), and error correction was performed using JuiceBox software (v1.11.08)29. The final genome assembly reached 6.32 Gb, consisting of 13 pseudo-chromosomes (See details in Table 1), which covered 99.21% of the original genome. The overall assembly metrics included a scaffold N50 of 691.8 Mb.
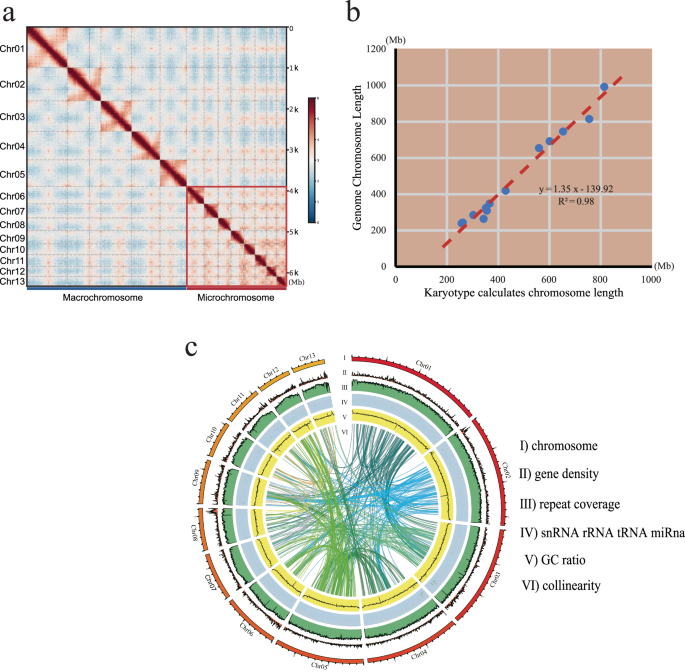
(a) A total of 13 distinct blocks were visualised in the Hi-C contact matrixes. Chromosomes 1–6 are designated as macrochromosomes, while chromosomes 7–13 are classified as microchromosomes. (b) Pseudo-chromosome and Karyotype Correlation Analysis. The x-axis represents chromosome length measured based on existing karyotype data, assuming that each μm of chromosome contains 37.0 Mb. The y-axis represents the pseudo-chromosome cumulative length. (c) A Circos plot summarising the genome features. From outside to inside: (I) the lengths of 13 pseudo-chromosomes, (II) gene density, (III) repeat coverage, (IV) non-coding RNA content, (V) GC content and (VI) internal syntenic blocks.
Based on the existing karyotype data on American bullfrog30,31, we conducted a correlation analysis between the relative lengths obtained from the karyotype data and the cumulative length of pseudo-chromosomes. The analysis yielded an R-squared value above 0.99, confirming consistency with prior research. Using the karyotype image, we calculated physical chromosome lengths and determined a compression ratio of 37.0 Mb per μm (Table 1). The correlation analysis between the pseudo-chromosome lengths and karyotype measurements produced an R-squared value greater than 0.98 (Fig. 3b), demonstrating the accuracy of the pseudo-chromosome construction.
Gene annotation and functional assignment
Repetitive sequences were predicted using a Homolog-based approach, employing RepeatMasker and RepeatProteinMask software (v4.1.2)32 with the RepBase database. Additionally, an ab initio approach was employed, utilising RepeatModeler (v2.0.2a)32 and LTR-FINDER (v1.0.5)33 software to construct an ab initio repetitive sequence library, followed by prediction using RepeatMasker. Simultaneously, the TRF software (v4.09)34 was employed to identify Tandem Repeats within the genome. Finally, a total of 5.07 Gb of repetitive sequences were detected, accounting for 79.51% of the assembled genome (See details in Table 2).
Gene structure prediction involved three approaches: transcriptome-based, homology-based and de novo prediction. Exonerate (v2.4)35 was used to predict gene structures in homologous species, including Engystomops pustulosus, Bufo bufo, Rana temporaria and Xenopus laevis. De novo assembly of transcriptome reads was performed using Trinity (v2.13.2)36, followed by de novo prediction using PASA37 and Augustus (v3.3)38. A total of 32,382 genes were annotated, with an average gene length of 58,248.47 bp, an average CDS length of 1,264.88 bp and an average of 6.55 exons per gene (See details in Table 3).
Functional gene annotation was conducted through comparisons across various databases such as SwissProt39, NCBI NR, PFAM40, GO41, KEGG42, InterPro43 and TrEMBL44. Among these predicted genes, 98.96% were annotated in protein databases (See details in Table 3). Syntenic blocks were constructed using MCscan45, and a Circos46 plot (Fig. 3c) illustrated key features, including: (I) the lengths of 13 pseudo-chromosomes, (II) gene density, (III) repeat coverage, (IV) non-coding RNA content, (V) GC content and (VI) internal syntenic blocks.
Data Records
The genome assembly of the American bullfrog have been deposited in the GenBank database under the accession number GCA_042186555.147. The original genomic and transcriptomic data has been deposited in the China National GeneBank DataBase (CNGBdb) under project ID CNP0004806. Genome annotation files can be accessed publicly via the FigShare48.
Technical Validation
Quality assessment of the genome assembly
To evaluate the quality of the assembled genome, gDNA quality was assessed using both a Nanodrop spectrophotometer (Thermo Fisher Scientific, USA) and agarose gel electrophoresis. The OD260/280 values ranged between 1.8 and 2.0, while OD260/230 values were between 2.0 and 2.2, confirming sample quality. RNA extracted from the samples was analysed using a 2100 Bioanalyzer (Agilent Technologies, USA), yielding a 28S/18S ratio exceeding 1.0 and an RNA Integrity Number (RIN) greater than 7.0, further meeting quality requirements.
The minimap2 software (v2.12)49 was employed to map long reads to assembly data, using a 1000 bp sliding window, which confirmed that the genome assembly was free from contamination (Fig. 2b). Additionally, alignment of both long and short reads to the assembled genome indicated coverage of 99.13% and 99.96%, respectively, with average sequencing depth of 50.39x and 35.42x. The integrity of the genome assembly was further assessed using Benchmarking Universal Single Copy Orthologs (BUSCO, v5.2.2)50 with the vertebrata_odb10 database (Table 4). The results showed that the assembly and annotation contained 92.2% and 89.5% complete BUSCO genes, respectively, with single copy BUSCOs accounting for 90.1% and 86.9%, and duplicated BUSCOs representing 2.1% and 2.7%. Merqury (v1.3)51 analysis revealed a QV score and error rate of 38.924 and 1.28e-04, respectively. Gfastats (v1.3.1)52 was used to generate assembly summary statistics (Table 4).
Collinearity analysis
The JCVI package53 was used to perform whole-genome synteny analysis by aligning the chromosome-level genome data between the American bullfrog (this study) and its relative common frog (R. temporaria). Our results demonstrated strong one-to-one chromosomal correspondences between the two species (Fig. 4), highlighting the high-quality of the American Bullfrog genome assembly.
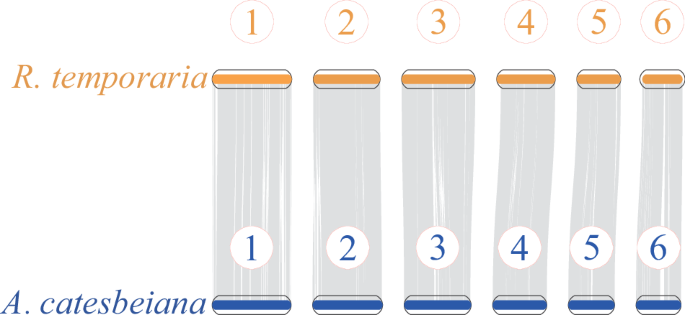
Chromosomal Synteny Analysis of Aquarana catesbeiana and its relative Rata temporaria.


Responses