A comparative genomic analysis at the chromosomal-level reveals evolutionary patterns of aphid chromosomes

Introduction
Genomic variation is a fundamental driving force in biological evolution, encompassing variations in single base pairs, small insertions, or deletions. In certain cases, however, more extensive genomic rearrangements become the primary driver of evolution1. These rearrangements involve structural variations such as segmental duplications, deletions, inversions, and others2, and can lead to the emergence of new genomic structures and functions3,4. Transposable elements (TEs) are increasingly recognized as contributors to genomic rearrangements, as they can insert themselves at various loci, promote recombination, and facilitate chromosomal rearrangements, thereby shaping genomic structure and function over evolutionary time5,6.
Genomic rearrangements are widely recognized as key factors driving biodiversity and differentiation7. Insects, being one of the most diverse groups of organisms on Earth, offer a unique opportunity to study the relationship between genomic variation and biodiversity8. For instance, the genomic structure of Lepidoptera has remained largely unchanged for at least 140 million years, while Pieris napi represents a notable exception with dramatic chromosomal rearrangements9. A recent study on Erebia butterflies reveals that repetitive elements within holocentric chromosomes correlate with population differentiation and chromosomal rearrangements, suggesting a role in adaptation and species diversification10. Additionally, recent research on aphids has shown significant TE enrichment at gene loci related to xenobiotic resistance, such as cytochrome P450 genes, highlighting the potential of TEs to drive adaptive changes in genomic structure and function11.
Aphids serve as an emerging model system for investigating the implications of substantial genomic rearrangements on evolutionary processes12,13,14. The species diversity is remarkable, with over 5000 described species and 23 subfamilies, including the most diverse subfamily Aphidinae, which encompasses more than half of the described aphid species15. Aphids exhibit exceptionally rapid chromosome evolution, characterized by a wide range of nuclear chromosome numbers (2n = 4 to 72)16 and a higher rate of chromosomal rearrangements in aphids than in other Hemiptera insects12,17. Chromosomal rearrangement events are observed in different subfamilies, even within the same genus18, which is an intriguing phenomenon that has attracted considerable attention.
Previous research has suggested that holocentric chromosomes and parthenogenesis may be primary factors driving extensive chromosomal rearrangements and persistent genetic diversity19,20,21, but these factors do not fully explain the rapid chromosome evolution in aphids. For example, Ruckman et al. conducted a thorough analysis of chromosome numbers in 22 insect orders and found no significant difference in chromosomal evolution rates between clades with monocentric and holocentric chromosomes22, and species like Pieris napi, with holocentric chromosomes but no parthenogenesis, also show significant rearrangements9. Mathers et al. have revealed extensive rearrangements in aphid autosomes, while their X chromosomes have shown a degree of conservatism12. However, Mathers et al.’s study was confined to only three aphid species, due to the limited availability of chromosomal-level genome assemblies at the time. Incorporating more chromosomal-level aphid genomes into genomic evolutionary analysis is necessary to explore the mechanisms and pattern behind chromosomal rearrangement in aphids, investigate whether different aphid lineages exhibit varying rates of chromosomal rearrangement and the reasons behind these differences, and determine whether a higher rearrangement rate might lead to an increased speciation rate.
The celery aphid, Semiaphis heraclei, is a widespread agricultural pest found in East Asia, South Asia, and Hawaii23. It primarily infests plants from the Lonicera genus (e.g., Lonicera japonica) and the Apiaceae family (e.g., celery, fennel, and Angelica spp.), many of which are important medicinal plants23. Understanding how this aphid adapts to its host plants, particularly by detoxifying secondary metabolites, is essential for pest management. Secondary metabolites are key components of plant defense, deterring herbivory and pathogen attacks24. In Lonicera species, such as Lonicera japonica, a variety of metabolites like phenolic acids, flavonoids, saponins, and iridoids have been identified, which help the plant resist environmental stressors25,26. Similarly, Apiaceae plants produce compounds such as terpenoids, triterpenoid saponins, flavonoids, and coumarins to defend against herbivores27,28,29,30. Aphids detoxify these compounds through enzyme families, including cytochrome P450 monooxygenases (P450s), carboxyl/cholinesterases (CCEs), UDP-glucosyltransferases (UGTs), and glutathione S-transferases (GSTs), allowing them to feed on their host plants31. Studying detoxification genes across aphid species can provide insights into the evolutionary adaptations of S. heraclei to its hosts, improving our understanding of host–plant interactions and aiding the development of pest control strategies.
Advances in sequencing technology have expanded the availability of aphid genome assemblies, presenting new opportunities for studying aphid genome evolution. In order to gain deeper insights into aphid chromosome evolution and the host adaptation evolution of Semiaphis heraclei, we assembled and annotated a chromosomal-level reference genome of this aphid. Furthermore, we performed comparative analyses at the chromosome level for five species within Macrosiphini (Acyrthosiphon pisum12,32, Myzus persicae12,32, Sitobion miscanthi33,34, Neotoxoptera formosana35 and S. heraclei), two species from Aphidini (Aphis gossypii36 and Rhopalosiphum maidis37), and two species from Eriosomatinae (Eriosoma lanigerum38,39 and Schlechtendalia chinensis40). In this study, we reconstructed the chromosomal evolutionary history of the Macrosiphini tribe and applied comparative genomic analysis, including transposable element assessment and topologically associated domains (TADs) tests, gene adaptive evolution, and gene expression patterns, to explore the genomic characteristics and mechanisms of chromosome rearrangement in aphids. Additionally, we conducted a comparative analysis of detoxification gene families across these species to uncover the genomic basis of host adaptation in S. heraclei. This research aims to enrich our understanding of the genetic dynamics underlying karyotype evolution, variations in genomic structures, gene family evolution, and their contribution to speciation and biodiversity in aphids.
Results
Genome assembly and annotation
A chromosome-level reference genome of S. heraclei was assembled using a combined sequencing data of 46.4 Gb Illumina paired-end reads, 161.2 Gb PacBio long reads, and 50.3 Gb Hi-C data (Supplementary Table 1). After removing assembly contamination with Blobtools pipeline (Supplementary Fig. 1)41, the genome assembly was 404.35 Mb in size with scaffold N50 of 109.32 Mb, consistent with the 403.91 Mb genome size estimated by a K-mer analysis (Supplementary Fig. 2). A total of 401.92 Mb (99.4%) assembled sequences were clustered into four chromosomes (Fig. 1a), consistent with the previously reported karyotype 2n = 842. The completeness of the assembly was assessed by BUSCO v5.3.243,44, based on a Hemiptera conserved gene set (n = 2510), indicated 98.8% of the genes orthologs were captured (Supplementary Table 2). All these analyses proved the reliability and completeness of the S. heraclei genome assembly.

a The heatmap displays the Hi-C contact frequency of the S. heraclei genome assembly, with blue lines indicating chromosomes. The x-axis and y-axis represent cumulative lengths in millions of base pairs (Mb). b The circular diagram illustrates TE density, protein-coding gene density, GC content, and chromosome length of S. heraclei genome assembly from the inside out. c Time-calibrated phylogenetic tree based on the concatenation of 2358 conserved single-copy genes from all species. All nodes are supported with 100% bootstrap values, and different colors represent different taxa. The thicker dashed lines demarcate the beginning and end of the Cretaceous period, while the thinner dashed lines indicate the boundary between the Early and Late Cretaceous. K1 and K2 represent the Early and Late Cretaceous, respectively. The scale below represents time in millions of years ago (MYA). Numbers beside branches denote divergence times, and calibrated points marked with red dots were used for estimating divergence times.
Approximately 33.37% of the genome was consists of repetitive elements, including DNA transposons with a total length of 46,468,311 bp (11.49%). This was followed by SINE retrotransposons, LINE retrotransposons, and LTR retrotransposons with lengths of 16,471,179 bp (4.07%), 9,257,723 bp (2.29%), and 7,769,730 bp (1.92%), respectively (Fig. 1b). Protein-coding genes were predicted by combining ab initio prediction, homology-based prediction, and evidence from mapped RNA-seq data, producing 17,921 protein-coding genes, with a BUSCO completeness of 98.6% (2473 complete genes of the total 2510 Hemiptera conserved orthologus). Of these, 17,530 (97.82%) protein-coding genes have homologs in common public databases, which indicates that the annotated genes were reliable (Supplementary Table 3).
Phylogenomic tree and divergence time
To reconstruct the phylogenomic tree of selected species and estimate their divergence times, we identified orthogroups in the celery aphid, eight other aphid species with chromosome-level assemblies, and six other Hemiptera insects (Supplementary Table 4)45,46. After extracting single-copy orthologs from the orthogroups, we constructed a fully resolved phylogenomic tree based on the protein sequences of 2358 highly conserved single-copy genes using the maximum likelihood method (Fig. 1c), which was consistent with the study conducted by ref. 47. Our results indicate that the primary divergences within different aphid subfamilies occurred from the Late Cretaceous to the early Tertiary period. The subfamily Lachninae diverged ~78.5 million years ago (MYA), followed by Eriosomatinae at around 72.6 MYA. The subfamilies Aphidinae and Chaitophorinae also diverged in the Late Cretaceous, around 70.0 MYA, a period when the major host angiosperms of aphids were undergoing rapid radiation and becoming dominant species48. These results are consistent with the fossil records that Aphidinae existed in the Late Cretaceous, with most tribes appearing in the early Tertiary49, which were thought to be driven by the parallel evolution with the rapid radiation of angiosperms50.
Collinearity analysis and reconstruction of the chromosomal evolution history of aphids
To investigate the chromosomal evolution of aphids, we conducted the collinearity tests among the chromosome-level reference genomes of nine aphid species, including five Macrosiphini species, two Aphidini species, and two species from Eriosomatinae (Fig. 2a and Supplementary Table 4). Firstly, the results of this analysis revealed the extensive intra- and inter-chromosomal rearrangements in autosomes, while the X chromosomes of Aphidinae and Eriosomatinae have maintained a conserved intra-chromosomal rearrangements pattern for at least 72.6 million years (Figs. 2a, 1c). As well, after we calculated the chromosomal rearrangement rates of autosomes and X chromosomes of aphids, we found the rate of autosomal rearrangements in aphids was significantly higher than those of X chromosome (Supplementary Table 5, Mann–Whitney U-test, p value = 0.048). It is noteworthy that no obvious inter-autosomal rearrangements were detected between A. gossypii and R. maidis, with their autosomal rearrangement rates closely resembling those of their X chromosomes (Supplementary Table 5). We speculated that the increased rate of autosomal rearrangements in aphids was mainly due to frequent inter-autosomal rearrangements. To investigate this, we expanded the inclusion of species (Aphis fabae and Rhopalosiphum padi)34 to compare rearrangement rates between the X chromosome and autosomes in species without such inter-autosomal rearrangements. Our findings consistently demonstrated that the rearrangement rates of the X chromosome were generally higher than those of autosomes in aphids without inter-autosomal rearrangements (Supplementary Table 6 and Supplementary Fig. 3).

a On the left, the phylogenetic tree illustrates the relationships between the nine aphid species. Branches in the phylogeny are color-coded based on their respective average chromosomal rearrangement rates (supplementary Table 5). Rectangles on nodes represent the ancestral karyotype reconstruction, inferring a common ancestral karyotype (2n = 12) for five aphid species (S. heraclei, M. persicae, S. miscanthi, A. pisum, and N. formosana). Conservative blocks are coded according to the chromosomes from their common ancestor. Different colored numbers indicate the detected occurrences of chromosomal fissions (in red) and fusions (in blue). On the right, the genome syntenic plot is generated based on the gene order. Lines indicate the boundaries of syntenic gene blocks identified by MCScanX, with unconnected regions on the chromosomes possibly lacking syntenic gene blocks. Different chromosomes are color-coded with different links, and the X chromosome for each species is located on the far left and is depicted in gray. b The bar graph illustrates the number of species in each group within the Aphidomorpha15, with pentagrams indicating the average chromosome rearrangement rate for corresponding groups. Additionally, the boxplot depicts the chromosome counts in Macrosiphini, Aphidini, and other major subfamilies of aphids16 (median line, 25th–75th percentiles as boxes, Dots represent outliers). The dotted line indicates several major karyotypes of aphids15.
Secondly, to determine whether the high rearrangement rate of autosomes extends to other Hemiptera families, we compared the chromosomal rearrangement rates among each pair of Daktulosphaira vitifoliae vs Adelges cooleyi (Sternorrhyncha, Phylloxeroidea), Rhodnius prolixus vs Triatoma rubrofasciata (Heteroptera, Reduvioidea), as well as Nilaparvata lugens51 vs Laodelphax striatellus52 (Auchenorrhyncha, Fulgoroidea). Although D. vitifoliae and A. cooleyi show better autosomal collinearity than aphids (Supplementary Fig. 4), the higher autosomal rearrangement rate of autosome than that of the X chromosome was also observed, but this trend was not found in the latter two pairs’ comparisons (Supplementary Table 5, Mann–Whitney U-test, p value = 0.028).
Thirdly, after testing correlations between the rate of chromosomal rearrangements with species diversities of each respective aphid group, the results show the former are positively associated with the reported species numbers in each aphid group (Fig. 2b and Supplementary Table 5, Pearson correlation coefficient, R = 0.9995, p value = 0.020). Among aphids, the Macrosiphini tribe exhibits a significantly higher rate of chromosomal rearrangements compared to other aphid groups (Supplementary Table 5, Mann–Whitney U-test, p value = 0.048), particularly in species such as A. pisum and S. miscanthi, where the rearrangement rates are exceptionally high.
Reconstructing ancestral Macrosiphini chromosomes, we can clearly see the evolutionary history of aphid chromosomes, and further reveal the significant changes that have occurred in aphid autosomes during species differentiation. We reconstructed the ancestral karyotype of the Macrosiphini using chromosomal data from S. heraclei, M. persicae, S. miscanthi, A. pisum, and N. formosana. This analysis revealed the ancestral Macrosiphini (Macro) karyotype, consisting of six pairs of chromosomes (2n = 12) at a 50 kb resolution, covering ~73% of the S. heraclei genome and 45% of the A. pisum genome (M. persicae: 71%, N. formosana: 55%, S. miscanthi: 54%) (Fig. 2a and Supplementary Table 7). Among these species, N. formosana diverged earliest, maintaining the ancestral karyotype with only intra-chromosomal rearrangements and sequence expansion. In contrast, A. pisum and S. miscanthi experienced more chromosomal fusions and fissions, despite their shortest divergence time (Fig. 2a). Due to the limitation of available data, we cannot currently reconstruct the ancestral karyotype of Aphidinae. Nevertheless, based on the counted karyotype in aphid species (Fig. 2b), it is evident that Aphidini possesses a highly stable karyotype16,53, and its ancestral karyotype is more likely equal to 2n = 8.
The differences in transposable elements abundance and genome size in aphids
Transposable elements (TEs) play a significant role in shaping the dynamic landscape of genome evolution54,55. The results of the comparative analysis of TEs content showed R. maidis and A. gossypii from the Aphidini tribe displayed significantly lower TE content (<22%) compared to other aphid species (from 28 to 39%) (Fig. 3a and Supplementary Table 8, Mann–Whitney U-test, p value = 0.028). Additionally, the composition of different types of TEs varied significantly among different aphid species. In the genomes of Aphidinae species, the higher proportions of SINE retrotransposons were detected, as well as the Macrosiphini species were found significantly enriched of DNA (Mann–Whitney U-test, p value = 0.01587) and SINE retrotransposons (Mann–Whitney U-test, p value = 0.01587) than those of other involved aphid species (Fig. 3a and Supplementary Table 8), indicating the association between the events of TEs insertions and phylogenetic signals.
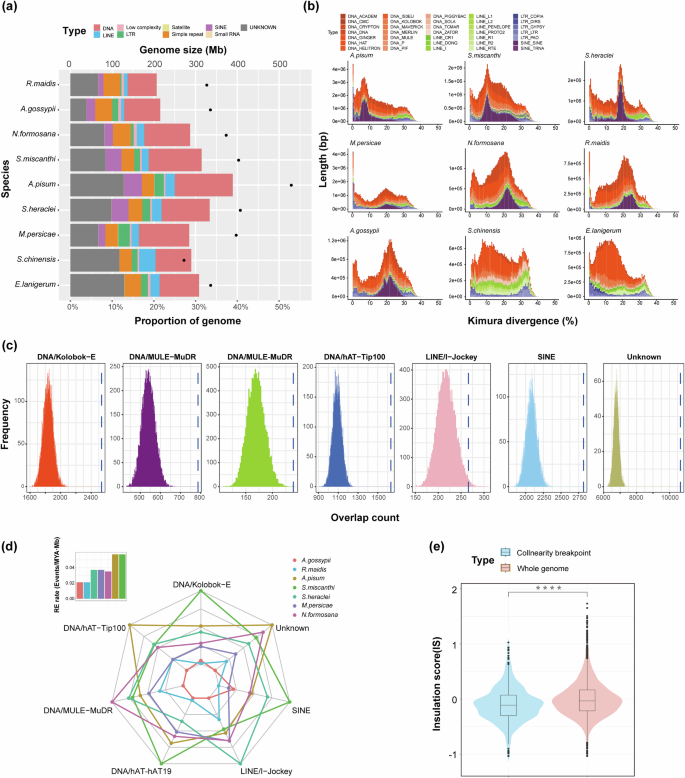
a Genome size and the proportion of repetitive sequences in the genomes of the nine aphid species. b Stacked histogram displaying the age distribution of transposable elements (TEs) in the nine aphid species, with different colors representing different TE families. c TE families enriched at all aphid chromosomal rearrangement breakpoints. The histogram displays the distribution of counts for a specific TE family within 10,000 randomly sampled chromosomal regions of equal size to the rearrangement breakpoint regions. The dashed line represents the observed count for the corresponding TE family in rearrangement breakpoint regions. The results shown are for S. miscanthi within the collinear species pairs with A. pisum. d Radar plot illustrating the relative density (/Mb) of TE families from Fig. 3c in the genomes of seven aphid species in Aphidinae. Different colors represent different species, and the intersection of the axes and network lines indicates the relative density of the corresponding TE family in the seven aphid genomes. The histogram in the top left corner shows the chromosomal rearrangement rates for these seven aphid species. e Violin plot comparing the IS (Insulation Score) between S. heraclei and M. persicae for the whole-genome alignment and synteny breakpoint regions (Mann–Whitney U-test, p value = 6.549 × 10⁻¹²) (median line, 25th–75th percentiles as boxes, Dots represent outliers).
The distribution of TEs in different chromosomes exhibited significant enrichment on the X chromosome of species in Aphidinae, particularly at the ends (Supplementary Fig. 5 and Supplementary Table 9, Mann–Whitney U-test, p value = 0.01099). In contrast, the distribution of TEs on autosomes is relatively uniform, with only a few individual chromosomes displaying differences (Supplementary Fig. 5). Notably, no significant TEs enrichment was observed on the X chromosomes of S. chinensis and E. lanigerum from the Eriosomatinae subfamily (Supplementary Fig. 6), nor in the outgroup species of Therioaphis trifolii from subfamily Calaphidinae56 (Supplementary Table 10). These findings suggest that ancient TEs expansions on X chromosomes in the early ancestor of Aphidinae.
Among different species of Aphidinae species, their genome size shows a significant positive correlation with the proportion of TEs within the genome, specifically, the DNA transposons and SINE retrotransposons (Supplementary Fig. 7 and Supplementary Table 11, Mann–Whitney U-test, p value = 0.02334). However, we found that this relationship between TEs and genome size is not consistent across subfamilies. We observed that the two species in Eriosomatinae have shorter single-copy sequence lengths and fewer protein-coding genes than species in Aphidinae (with the exception of R. maidis) (Supplementary Table 12, Mann–Whitney U-test, p value = 0.036), and despite their much smaller genome sizes, the TEs proportions of their genomes are not significantly different from that of M. persicae. Therefore, the difference in genome size between Eriosomatinae and Aphidinae may be influenced by factors beyond TEs, such as sequence expansion in Aphidinae or genome reduction and streamlining in Eriosomatinae.
TEs activity in the evolutionary process of aphids genome
Through analysis of DNA transposon insertion time distributions, we found that five aphid species within Macrosiphini exhibit significantly more recent expansion events compared to four other aphid species (Supplementary Fig. 8 and Supplementary Table 13, Mann–Whitney U-test, p value = 0.008). Additionally, despite a short divergence time between A. pisum and S. miscanthi (Fig. 1c), the former exhibits sustained and significant expansion of DNA transposon, a trend that contributes to its largest genome size (Fig. 3a and Supplementary Table 8).
In the Aphidinae subfamily, all species exhibit a significant peak in SINE retrotransposons age distribution (Fig. 3b and Supplementary Fig. 9). However, the two Eriosomatinae species, E. lanigerum and S. chinensis, have minimal annotations of SINE retrotransposons, as well as species of Chaitophorinae (S. flava) and Lachninae (C. cedri) (Supplementary Table 8), suggesting that the specific expansion of SINE retrotransposons in the common ancestor of Aphidinae after its’ they diverged with Eriosomatinae. Research on SINE retrotransposons suggests that SINE transposons can provide transcription factor binding sites for neighboring genes, potentially participating in the regulation of temporal gene expression57, and can cause DNA double-strand breaks through adjacent endonuclease target site duplications58. The expansion of SINE retrotransposons may have had a profound impact on aphid species in Aphidinae.
Enrichment of TEs at synteny breakpoints
TEs may trigger genomic rearrangement events through non-allelic homologous recombination59,60,61. To investigate if frequent chromosomal rearrangements in aphids are associated with TEs, we examined TE content at synteny breakpoints in seven Aphidinae species. The enrichment of TEs at these breakpoints varied slightly among species pairs, but DNA, SINE, and unknown elements were significantly enriched at synteny breakpoints in all pairs, indicating their substantial contribution to aphid chromosomal rearrangements (Supplementary Table 14). The most abundant DNA elements were Kolobok-E and hAT-Tip100, which also dominated the genomes. To pinpoint which TE families significantly contribute to genomic rearrangements in aphids, we further analyzed TE enrichment at synteny breakpoints. We found that DNA/Kolobok-E, DNA/MULE-MuDR, DNA/hAT-hAT19, DNA/hAT-Tip100, LINE/I-Jockey, and SINE were all significantly enriched at these breakpoints across all aphids (Fig. 3c and Supplementary Table 15). Compared with five aphid species from Macrosiphini, two species from the Aphidini lineage exhibited fewer rearrangements (Fig. 1c and Supplementary Table 5) and had lower densities of these TE families (only except for SINEs) (Fig. 3d), which may indicate the contributions of these TE families to the genomic rearrangements in aphids.
Chromosomal rearrangement breakpoints and TADs
As functional units of chromosome 3D structures, topologically associating domains (TADs) play a crucial role in gene regulation, expression stability, and other genomic functions62. Chromosomal rearrangements can impact the formation and maintenance of TADs, thereby influencing gene expression regulation by repositioning genes to new chromatin interaction regions, ultimately affecting species adaptation63. In this study, we examined the insulation scores (ISs) of rearrangement sites, and the results revealed enrichment of chromosomal rearrangement breakpoints at TAD boundaries in the seven Aphidinae species (Fig. 3e and Supplementary Fig. 10). This indicates that the locations of chromosomal rearrangement breakpoints are not random but tend to occur near TAD boundaries. Consequently, such breakpoints may have a limited impact on disrupting gene regulation, suggesting that purifying selection rather than positive selection may be driving these chromosomal rearrangements64. While chromosomal rearrangement breakpoints tended to occur at TAD boundaries, both chromosome fusions and rearrangements still led to changes in the TAD structure (Supplementary Fig. 11).
X chromosome evolution
A comparative analysis of X chromosome lengths across aphid species revealed significant variability (Supplementary Table 16). The X chromosome of A. pisum was 67,744,731 bp longer than that of S. heraclei, with 46,995,892 bp (69.34%) of its length comprising repetitive sequences dominated by TEs, which significantly contribute to the chromosome’s length (Supplementary Table 17). Furthermore, the A. pisum X chromosome contained more genes compared to other aphid species and showed a notable enrichment in genes associated with DNA transposons, heterochromatin, telomeres, and the Kelch-like gene family (Supplementary Fig. 12 and Tables 16, 18). This gene enrichment was linked to the expansion of repetitive sequences. Given the predominance of multicopy gene families on the X chromosome14, A. pisum has undergone extensive gene family amplifications. Overall, the considerable differences in X chromosome lengths among aphid species are primarily due to the cumulative effects of TEs expansion and unique sequence amplification.
The role of specific gene loss and duplication in the chromosomal evolution of aphids
To investigate the genetic factors underlying extensive autosomal rearrangements in aphids, we conducted a comprehensive gene loss analysis spanning multiple aphid species, along with representative insects from the Prosorrhyncha (R. prolixus (obtained from DNA Zoo46,65) and T. rubrofasciata66), Auchenorrhyncha (Homalodisca vitripennis67, Laodelphax striatellus52, and Nilaparvata lugens51), and Sternorrhyncha (D. vitifoliae68, A. cooleyi69, Bemisia tabaci70, and Diaphorina citri71) suborders. Our analysis identified the specific loss of 122 genes exclusive to the aphid lineage (Supplementary Table 25). Three genes of particular interest among the lost genes are RIF1 (Replication timing regulatory factor 1), BRD8 (Bromodomain containing 8), and DMC1 (DNA meiotic recombinase 1), were all associated with DNA double-strand break repair (DSB) and genome stability. To confirm their loss, we analyzed Illumina sequencing data for S. heraclei, further validating their absence in the aphid lineage. Our investigation dated the loss of RIF1, BRD8, and DMC1 genes to the common ancestor of the suborder Aphidomorpha (Fig. 4b). RIF1 encodes a protein regulating replication timing and interacting with PP172. Additionally, it is a key regulator of TP53BP1, which in turn plays a pivotal role in DSB repair by modulating non-homologous end joining (NHEJ) and counteracting homologous recombination (HR) repair mediated by BRCA173. Loss of RIF1 may reduce NHEJ efficiency and increase HR frequency, potentially promoting chromosomal rearrangements and compromising genome stability74,75. BRD8, part of the NuA4 histone acetyltransferase complex, plays a vital role in DNA DSB repair and genome stability. Studies have demonstrated that BRD8 depletion impairs genome stability76,77. DMC1, a conserved meiosis-specific double-strand repair gene, is essential for homologous recombination during meiosis78. Its loss has been reported in Drosophila, Anopheles, Caenorhabditis elegans78, and Daphnia pulex (a cyclical parthenogenesis79). However, the precise effects of DMC1 loss remain unclear. Investigating the loss of DMC1 in eukaryotes will contribute to understanding the evolution of homologous recombination mechanisms in meiosis and potentially in cyclical parthenogenesis, which warrants further investigation.
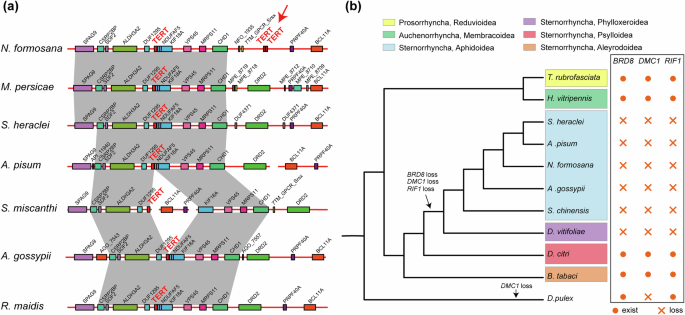
a Gene order in the genomic region near TERT. Gray links represent genomic regions conserved across all species, and TERT is highlighted in red. Red arrows point to the concatenated duplication location of the TERT gene. A more comprehensive gene order plot for various species is presented in Supplementary Fig. (Supplementary Fig. 19). b Timing of gene loss for BRD8, RIF1, and DMC1. Different colors indicate different taxonomic groups.
N. formosana is the earliest diverging species among the five studied Macrosiphini species, retained the ancestral karyotype (Fig. 2a). Gene family expansion analysis 51 gene families exhibited specific expansion in N. formosana (Supplementary Table 26). Among these genes, the TERT (Telomerase reverse transcriptase) gene displayed tandem duplication ~258 kbp downstream (Fig. 4a and Supplementary Fig. 19). Furthermore, the gene order around TERT observed in Aphidinae aphids differed from that in Chaitophorinae, Eriosomatinae, even in Phylloxeridae (Supplementary Fig. 20). By examining the assembly quality around TERT, transcriptome data of N. formosana and other aphid genomes (Supplementary Fig. 21), we confirmed that TERT duplication in N. formosana are not caused by genome assembly errors or annotation errors.
Natural selection on genes linked to chromosomal rearrangements in Macrosiphini
Macrosiphini is the most diverse group in terms of species richness among aphids15. To test whether natural selection was associated with the radiation of Macrosiphini, we conducted a positive selection analysis and identified 104 single-copy genes exhibiting evidence of positive selection (Supplementary Tables 27, 28). The DNA mismatch repair gene spel1, a homolog of the human gene MSH2, is under positive selection in Macrosiphini (Supplementary Table 28). This gene plays a crucial role in post-replication mismatch repair, reducing DNA mutations and maintaining genome stability80,81. The positive selection of spel1 may contribute to preventing the accumulation of genetic mutations, further maintaining genetic stability in organisms.
We further conducted gene family contraction and expansion analysis to investigate their evolutionary significance in Macrosiphini. The results revealed a significant expansion of DNA transposon-related genes in Aphidinae, especially within Macrosiphini (Supplementary Fig. 22 and Supplementary Table 29). This expansion correlated with the higher relative abundance of DNA transposons in their genomes compared to other aphids (Supplementary Table 8).
Detoxification genes and host adaptation evolution in Semiaphis heraclei
We used the BITACORA pipeline82 to reannotate the detoxification gene families (P450s, CCEs, UGTs, and GSTs) in S. heraclei and eight other chromosome-level aphid genomes. Functional domains and motifs were identified through visual comparison (Fig. 5a and Supplementary Figs. 23–25), revealing tandem repeat domain characteristics in certain genes, which IGV83 confirmed as errors in annotating adjacent repeat genes as a single gene. After correction, we enumerated the detoxification gene families across the nine aphid species (Supplementary Table 30).
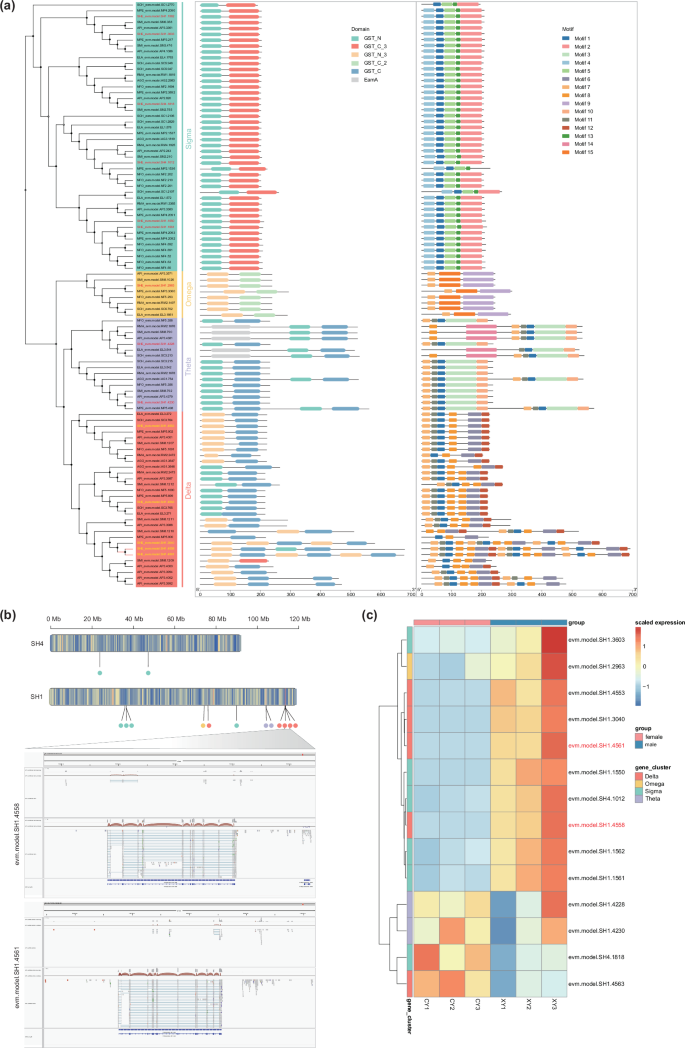
a Phylogenetic relationships, domain and motif between GSTs from different aphids. Highlight the gene names belonging to S. heraclei with distinct colors. The gene branches in S. heraclei that underwent species-specific expansion are highlighted in red. b GSTs gene distribution in the S. heraclei genome and IGV verification of SHE_evm.model.SH1.4558 and SHE_evm.model.SH1.4561 annotations and assembly errors. The upper track represents transcriptome reads from sexual female aphids, while the lower track represents transcriptome reads from male aphids. c Expression differences of GSTs genes between sexual females and males.
Notably, S. heraclei did not exhibit the highest numbers of P450s, CCEs, UGTs, and GSTs among aphids, which is expected, as species like M. persicae and A. gossypii—with broader host ranges—likely require larger detoxification gene repertoires to cope with diverse plant secondary metabolites31. Species-specific tandem repeats were identified in S. heraclei’s CCE Esterase, UGTs Cluster 2, and P450s CYP3/CYP4 families, primarily localized on autosomes (Supplementary Fig. 26). The CCE Esterase plays a key role in insecticide resistance, plant metabolite detoxification, and olfactory degradation84, while UGTs are involved in detoxifying plant allelochemicals, insecticide resistance, and other physiological functions85,86. Similarly, P450 CYP3 and CYP4 are associated with insecticide resistance87 and detoxification of plant allelochemicals in insects88,89. These expansions may enhance the detoxification capacity of S. heraclei. Additionally, we compared the expression levels of P450s, CCEs, and UGTs in male and sexual female S. heraclei aphids. The analysis showed that most of these genes were upregulated in males, especially those with species-specific expansions (Supplementary Fig. 27), suggesting that males face greater detoxification pressures due to flight and migration.
For GSTs, we classified them into Sigma, Omega, Theta, and Delta classes. Omega and Theta classes showed stable gene counts, while Sigma and Delta class varied significantly (Fig. 5a and Supplementary Table 30). Despite Sigma class expansion, sequences remained highly conserved (Fig. 5a), indicating purifying selection. We identified a GST Sigma gene in S. heraclei (SHE.evm.model.SH1.1550) with two insertion events (LP and V), the LP insertion occurring in the conserved N-terminal domain (Supplementary Fig. 28a). Transcriptomic analysis excluded annotation errors (Supplementary Fig. 28b), and SWISS-MODEL predicted that the LP insertion alters the protein structure, potentially affecting gene function (Supplementary Fig. 28c).
Additionally, a species-specific expansion of the GST Delta class was observed in S. heraclei, with genes SHE.evm.model.SH1.4558 and SHE.evm.model.SH1.4561 exhibiting unique tandem GST_N/GST_C domain repeats (Fig. 5a). IGV and transcriptomic sequencing confirmed no annotation errors (Fig. 5b), and the transcriptomic assembly validated the gene structure annotation (Supplementary Fig. 29). Both genes were classified into the Glutathione S-transferase family based on InterPro90 and eggNOG91 annotations, though no homologs with similar structures were found in NCBI or Uniprot databases. These genes may be novel genes in S. heraclei that contain GST_N and GST_C domains, potentially playing key roles in its adaptive evolution. Furthermore, GST genes were predominantly upregulated in males (Fig. 5c), consistent with the expression patterns of other detoxification genes.
Discussion
Aphid genomes can acquire new genetic content through chromosomal rearrangements and transposon insertions, potentially impacting vital adaptive genes and facilitating adaptation to new ecological niches92. In parallel, Aphidinae have the widest host–plant range among aphids93. Our study supports that the rate of chromosomal evolution varies among different aphid lineages and correlates positively with species diversity, as the most species-rich group of Macrosiphini exhibits significantly higher rates of chromosomal rearrangement compared to other lineages, suggesting the contribution of chromosomal rearrangements in speciation and adaptive evolution of aphid evolution.
In addition to the absence of rearrangements with autosomes, the chromosomal rearrangement rate of aphids’ X chromosomes is significantly lower than that of their autosomes. This evolutionary pattern is also evident in aphids’ sister groups, D. vitifoliae and A. cooleyi. Recently, Li et al. compared the inter-chromosomal rearrangements of D. vitifoliae, A. cooleyi, and A. pisum, and they suggested that the increased autosomal rearrangement rates are unique to aphids17. However, increasing the lineage sampling, our observations indicate that some aphid lineages also lack inter-autosomal rearrangements, such as M. persicae with N. formosana and A. gossypii with R. maidis. Our findings imply that when not distinguishing between intra- and inter-chromosomal rearrangements, the evolutionary pattern of increased autosomal rearrangement rates may not be unique to aphids but may be common across the Aphidomorpha.
We hypothesized that the observed discrepancies in rearrangement rates between the X chromosome and autosomes might be primarily attributed to inter-autosomal rearrangements. To test this, we calculated the rearrangement rates for aphid species that exclusively undergo intra-chromosomal rearrangements and discovered that the X chromosome exhibits a higher rearrangement rate than the autosomes. This finding aligns with our observations of TEs accumulation on the X chromosome, low-level gene expression, and previous studies indicating higher levels of recombination and relaxed purifying selection on the X chromosome12,14,94.
Mechanisms such as dosage compensation or complete elimination of the X chromosome may explain the lack of inter-chromosomal rearrangements between the X chromosome and autosomes12,14. Research indicates that the aphid X chromosome primarily carries sexually antagonistic genes that benefit males95. Consequently, during sexual reproduction, rearrangements might disturb the regulation of these genes or change the expression of linked autosomal genes, reducing male aphid fitness. This is supported by the observation that chromosomal translocations present in asexual populations of M. persicae are eliminated in the holocyclic population53. However, the reasons behind significant inter-chromosomal rearrangements in aphid autosomes are still unclear. Our collinearity analysis reveals that all A. cooleyi autosomes exhibit homology with only one D. vitifoliae autosome respectively, while in Eriosomatinae, several S. chinensis autosomes each match two E. lanigerum autosomes (Supplementary Fig. 4). This aligns with the finding of ref. 17, indicating that cyclical parthenogenesis does not fully explain the frequent inter-chromosomal rearrangements observed in aphids. To resolve this issue, future studies could collect more chromosomal-level data from various aphid subfamilies and Phylloxeroidea to reconstruct the chromosomal evolutionary history of their respective taxa, integrating molecular biology and ecological data for comparative analysis.
Our research results demonstrate that TEs have a significant influence on the evolution of aphid chromosomes. We identified a specific expansion of SINE elements within the Aphidinae lineage. This expansion may contribute to variations in genome structural stability and gene expression regulation57,58 between Aphidinae and other aphid lineages. Furthermore, our observations indicate that Aphidini with stable karyotypes possess a notably reduced proportion of TEs, especially LINE elements, in their genomes compared to other aphids. This finding is supported by the analysis of TE content cross multiple different aphid groups by ref. 11. We speculate that the extensive or recent expansion of TEs may lead to more frequent chromosomal fission or other structural rearrangements that alter chromosome number96,97, which could be one of the reasons for the differences in karyotype stability among aphids.
This study observed enrichment of certain SINE and DNA elements near the breakpoints of chromosomal rearrangements in aphids, and their density is notably lower in the genomes of Aphidini species with lower chromosomal rearrangement rates, suggesting an association with these rearrangements. Additionally, we noted a significant expansion of gene families related to DNA transposons within the Macrosiphini group, which may lead to an increase in DNA elements in their genomes. Furthermore, we observed that the content of SINE elements in the genomes of Macrosiphini aphids is significantly higher than that in other aphids studied. We hypothesize that the elevated rate of chromosomal rearrangements in Macrosiphini aphids may be related to the expansion of DNA and SINE elements, which may drive chromosomal rearrangements through non-allelic homologous recombination58,59. Previous research has also revealed similar trends of chromosomal rearrangement within Erebia subclades and specific genera of Lepidoptera10.
We observed that the Macrosiphini aphids, compared to other aphid species, have experienced more recent expansion events of DNA elements (Supplementary Table 13), particularly in A. pisum, which possesses a greater abundance of young DNA and SINE elements that are currently undergoing accelerated expansion (Supplementary Figs. 8, 9). Given that young repetitive elements are more likely to participate in ectopic recombination98,99, this elucidates why A. pisum and S. miscanthi display significantly higher rates of chromosomal rearrangements than other aphids. Additionally, the reconstructed chromosomal evolution history of Macrosiphini aphids indicated that the lineages of A. pisum and S. miscanthi experienced more chromosomal breakage and fusion compared to other Macrosiphini aphids. It is noteworthy that, compared to the over 2000 species within the Macrosiphini tribe, the number of published chromosome-level genomes remains limited. High-quality chromosome-level genomes with broad taxonomic representation are still lacking, hindering our ability to fully unravel the chromosomal evolution history of the Macrosiphini tribe. Furthermore, there is a significant gap in the availability of genome assemblies for the other subfamilies of aphids except Aphidinae, which obstructs aphidologists from gaining a comprehensive understanding of aphid chromosomal evolutionary history. Addressing this issue requires more available chromosome-level aphid genomes in the future.
Gene loss and duplication may play a crucial role in aphid chromosomal evolution. Specifically, the loss of genes related to DNA double-strand break repair, such as RIF1, BRD8, and DMC1100, could potentially impact the chromosomal stability of aphids, a similar mechanism observed in parrots64. Moreover, the duplication of the TERT gene, which encodes the enzyme responsible for elongating DNA telomeres and functionally essential for maintaining chromosome stability after successive rounds of DNA replication, plays a crucial role in chromosome end replication across eukaryotes101,102,103, may have a positive effect on the stability of the karyotype in N. formosana. Future experimental works are needed to test the influence of gene loss or duplication on the rapid chromosomal evolution in aphids.
Insect detoxification pathways are divided into three stages: in the first stage, P450s and CCEs convert xenobiotics into more hydrophilic products; in the second stage, GSTs and UGTs further conjugate metabolites in preparation for excretion; and in the third stage, transporters expel the transformed products from cells84,104. These genes play crucial roles in detoxifying plant secondary metabolites and conferring resistance in insects105,106,107, and gene duplication or amplification often leads to changes in detoxification gene expression, one of the most common mechanisms of insect resistance108,109. For example, amplification of the CYP9A subfamily has been shown to contribute to host adaptation and diverse insecticide resistance in insects such as Spodoptera exigua and Spodoptera frugiperda110. Additionally, amplification of the CYP6CY subfamily is closely associated with nicotine adaptation in the tobacco-adapted subspecies M. p. nicotianae92. Our findings indicate that species-specific expansions of the P450s CYP3 and CYP4, CCEs Esterase, and UGTs gene families in S. heraclei may enhance their detoxification capacity against plant secondary metabolites. Further analysis shows that mutations and expansions in the GST gene family, particularly the Sigma and Delta classes, are also closely related to environmental adaptation111,112. Notably, the expansion of GST Delta class genes may help S. heraclei adapt to specific environmental toxins. Moreover, significant sex-specific differences in the expression of detoxification genes were observed, with detoxification genes generally upregulated in male aphids, suggesting they face greater detoxification pressures during flight and migration. Future studies could further explore the functional roles of these genes in adaptive evolution through techniques such as gene knockout and RNA interference.
In conclusion, the rapid karyotype evolution in aphids, which contributes to their rapid speciation and adaptation, is the result of a combination of various factors. The characteristic expansion of TEs, specific gene duplication and loss, and the alternating sexual and asexual generations in their life cycle may all accelerated the karyotype evolution in aphids. Additionally, the mutation and expansion of detoxification gene families in S. heraclei may be a key factor in adapting to host–plant chemical defenses.
Materials and methods
Sample collection and sequencing
The parthenogenetic wingless adult and nymphal aphids of Semiaphis heraclei were collected in May 2019 from a planting base of Lonicera japonica (variety: ‘Siji jinyinhua’) located in Zhengcheng Town, Pingyi County, Shandong Province, China (35°16′0″N, 117°38′56″E). In the laboratory, the aphids were reared on cuttings of Lonicera japonica for over ten generations under controlled conditions (temperature: 25 ± 1°C, relative humidity: 70 ± 5%, light cycle: 14 h light : 10 h dark)113. The specimens are stored at the Institute of Medicinal Plant Development, Chinese Academy of Medical Sciences.
We selected 100 aphids of various developmental stages from the population in a laboratory and placed them into cryovials, which were then rapidly frozen in liquid nitrogen. The frozen samples were sent to Biomarker Technologies (Beijing, China) for library preparation and sequencing. DNA was quantified through 0.75% agarose gel electrophoresis, Nanodrop spectrophotometry (Thermo Fisher), and Qubit 3.0 fluorometry (Invitrogen). PacBio long reads were generated from sequencing on the PacBio Sequel II platform, while Hi-C reads and Illumina short reads were produced from sequencing on the Illumina NovaSeq 6000 platform.
To assist in gene annotation and conduct differential gene expression analysis, we sequenced the transcriptomes of three biological replicates, each of wingless sexual females and winged males, following the method described by ref. 12.
Genome assembly and annotation
The genome size of S. heraclei was estimated using k-mer analysis, based on Illumina short paired-end reads (~42 Gb) filtered using the default parameters of fastp v0.23.2114 and GCE v1.0.0115 with 17-mer. For the initial assembly, PacBio subreads were assembled using the Canu v2.2116 with parameters “genomeSize = 400 m” and “-pacbio”. We checked the contig assembly for host contamination using the BlobTools pipeline v1.1.1 by generating taxon annotated GC content-coverage plot (Supplementary Fig. 1). Each contig was searched against the NCBI nucleotide database (nt, downloaded on September 10, 2023) using BLASTN v2.13.0. Following the removal of contamination, we used purge_dups v1.2.5117 to identify and remove redundant sequences. Subsequently, the contigs were polished by NextPolish v1.4.0118 with three rounds using pacbio long reads and Illumina short paired-end reads. To obtain a chromosome-level assembly, the assembled contigs were then anchored to super-scaffolds by Hi-C reads applying Juicer v1.6.0119 and 3D-DNA v18092265, followed by manual correction using Juicebox Assembly Tools v1.9.9120. Finally, the completeness of our genome assembly was evaluated by Benchmarking Universal SingleCopy Orthologs (BUSCO) v5.3.2 with parameters “-m genome -l hemiptera_odb10”.
In this study, we employed a comprehensive analysis pipeline to identify repeats. This pipeline involves de novo and homolog-based prediction. For the de novo prediction, we first constructed a de novo repeat custom library for each species with RepeatModeler v2.0.1 (https://github.com/Dfam-consortium/RepeatModeler) and then merged the repeats library with known repeats from the Repbase Insecta library121 using ReannTE_MergeFasta.pl (https://github.com/4ureliek/ReannTE). For the homology-based method, we used Repeatmasker v4.1.2-p1 (https://www.repeatmasker.org/) to identify repeats across each assembly based on the merged library generated by each species. Through this approach, we identified repeats in all aphid assemblies, including four from Macrosiphini, two from Aphidini, two from Eriosomatinae, one from Chaitophorinae, and one from Lachninae (Supplementary Table 8).
Homology-based, de novo and transcriptome analysis was carried out to identify the protein-coding gene models of S. heraclei, following these steps. First, we used the GeMoMa pipeline v.1.8122 and the MMseq2 v13.45111123 search engine to identify the protein-coding genes. Our selection of closely related species included A. pisum, M. persicae, A. glycines, D. noxia, A. gossypii, S. flava, H. cornu, N. vitripennis, and D. melanogaster. Subsequently, the annotated gene sets were combined with the model GAF of GeMoMa using the filter parameters “iAA ≥ 0.8 and ce/rce = 1”. The protein sequences of these species were aligned to the S. heraclei genome using tblastn v2.12.0124 with an e-value parameter of 1e-5, and the candidate gene regions were further refined with genewise v2-4-1125 to obtain more accurate gene structures. Second, we mapped RNA-seq reads to the S. heraclei assembly using HISAT2 v2.2.1126 and constructed transcripts using stringTie v2.2.1127. Third, we performed de novo prediction of protein-coding genes within S. heraclei assembly using Augustus v3.4.0128, GlimmerHMM v3.0.4129, and SNAP v2017-03-01130. Finally, all of the gene set models generated in the above steps were combined using EvidenceModeler v1.1.1 (https://github.com/EVidenceModeler/EVidenceModeler).
To avoid biases from different annotation strategies and to ensure consistency and accuracy in gene annotation, the protein-coding genes of the other eight chromosome-level aphid genomes were re-annotated using the same de novo and homology-based methods as S. heraclei (Supplementary Tables 4, 12). Likewise, EvidenceModeler v1.1.1 was used to combine the gene set models.
Phylogenetic analysis and divergence time estimation
We used protein-coding genes for S. heraclei and eight other chromosome-level assembled aphids (A. pisum, M. persicae, S. miscanthi, N. formosana, A. gossypii, R. maidis, E. lanigerum, S. chinensis), along with the published protein-coding genes from six other insects (S. flava, C. cedri, D. vitifoliae, A. cooleyi, R. prolixus, T. rubrofasciata), to perform orthologue identification (Supplementary Table 4). The longest transcript of each gene was selected to identify orthologue groups among these 15 species using the Orthofinder pipeline v2.5.4131. This process resulted in a total of 2358 single-copy orthologues. These single-copy genes were aligned using PRANK v170427132, and subsequently, TrimAL v1.4.rev15133 was used to remove gaps and unaligned sites. All amino acid alignments were concatenated into a super-gene alignment, producing a concatenated sequence alignment of 982,857 sites. This protein sequence alignment was used to construct a maximum likelihood species tree using RAxML v8.2.12134 with the PROTGAMMAWAG model.
R8s v1.81135 was used to estimate the divergence times of these species, incorporating two fossil calibration points: Aphidomorpha (135 Ma136,137) and Aphidinae (70 Ma137), along with a previously used secondary calibration point at the root of Hemiptera (386 Ma138).
Synteny analysis
We identified syntenic blocks of genes among the nine aphid species and other Hemiptera insects using MCSCANX v1.1139. The pairwise comparison of the annotated protein sequences was performed using BLASTP v2.13.0124,140 with parameters “-outfmt 6 -evalue 1e-10 -max_target_seqs 5” and subsequently ran MCSCANX with parameters “-s 10 -b 2”. The results from MCSCANX were visualized using the SynVision website (https://synvisio.github.io/#/).
Due to the extremely rapid genome evolution in aphids12, we cannot calculate the rearrangement rate by aligning the genomes of all aphids to the genome of a reference species. So, as a compromise, we compared the genomic rearrangement rates between species pairs with close phylogenetic relationships to assess the genomic rearrangement rates in different subfamilies. We used in-house-made Perl scripts to convert syntenic blocks generated by MCSCANX into genomic coordinates. Genomic rearrangements, including inversions, translocations, and inverted translocations, were then detected using the previously described method141. The rearrangement rate for each species pair was calculated by dividing the number of rearrangements by the divergence time between the species pair and the average alignment length. To calculate the chromosomal rearrangement rate of L. striatellus and N. lugens, we added these two species to the aforementioned dataset and re-estimated the divergence time using r8s v1.81. The synteny dot plot was generated using WGDI v0.6.5142. Since the genome assembly of A. cooleyi is at the scaffold level, we used the 10 longest scaffold sequences to roughly estimate the chromosomal rearrangement rate of D. vitifoliae and A. cooleyi.
Ancestral karyotype reconstruction
Initially, we selected A. pisum, S. miscanthi, S. heraclei, and N. formosana genomes as input and performed alignment against the M. persicae genome using LAST v1420. Subsequently, we used UCSC tools (https://hgdownload.cse.ucsc.edu/admin/exe/linux.x86_64/) to convert the LAST alignment results into chain and net results. The conserved segments of the five Macrosiphini species were obtained using these chain and net results in conjunction with the DESCHRAMBLER algorithm (https://github.com/jkimlab/DESCHRAMBLER). Finally, the branch-and-bound algorithm in ANGES v1.01143 to infer ancestral nodes on the phylogenetic tree and construct ancestral genome structures.
Repetitive sequence analysis
To assess the enrichment of transposable elements (TEs) in chromosomal breakpoint regions, we used BEDtools v2.30.0144 and the TE annotation results described above to investigate the content of TEs in chromosomal breakpoint regions of all aphid species, as well as in randomly selected genome regions. We defined chromosomal breakpoint regions as regions located upstream or downstream of the endpoints of syntonic blocks obtained from MCSCANX analysis, with a length of 30,000 bp. To avoid potential interference from highly repetitive telomere sequences near chromosome ends, we excluded these regions from our analysis. BEDtools intersect was used to count the number of TEs within the breakpoint regions. To calculate the significance of TE enrichment (p value), we used the same approach to count the number of TEs in 10,000 sets of random regions within the genomes. Each random region was 30,000 bp in size, and the number of regions equaled the number of breakpoint regions. To prevent potential bias from highly abundant TEs on a particular chromosome, we limited the selection of random regions to each respective chromosome, ensuring that the number of randomly selected regions corresponded to the number of breakpoint regions on that chromosome. The p value for each TE class was calculated by dividing the number of random regions in which the TE count was greater than or equal to the observed count in the breakpoint regions by the number of simulations (10,000). We used parseRM.pl (https://github.com/4ureliek/Parsing-RepeatMasker-Outputs) to parse the output of RepeatMasker for generating the TE age distribution.
Hi-C contact analysis
Hi-C reads mapping was performed using BWA v0.7.17-r1188145. Following this, we filtered, corrected, binned, and normalized the mapping results using the default parameters of HiCExplorer v3.6146. Hi-C reads from S. heraclei were mapped to their respective genomes, while Hi-C reads from M. persicae were mapped to the S. heraclei genome, with uniquely mapped reads retained. Subsequently, the data was merged and binned to generate a genome-wide interaction map with a 100 kb resolution. We used hicFindTADs v3.7.2 to calculate insulation scores and identify TAD boundaries, with the parameters “–minDepth 400000 –maxDepth 800000 –numberOfProcessors 4 –step 100000 –thresholdComparisons 0.05 –correctForMultipleTesting fdr”.
Gene family analysis
To detect lineage-specific lost genes in aphids, we used the default parameters of the OrthoFinder v2.5.4 software to identify orthologues among nine aphid species, two Prosorrhyncha insects (R. prolixus and T. rubrofasciata), four Auchenorrhyncha insects (H. vitripennis, M. quadrilineatus, L. striatellus, and N. lugens), and four Sternorrhyncha insects (D. vitifoliae, A. cooleyi, B. tabaci, and D. citri). Subsequently, from the orthogroup results, we selected orthologues that were absent in all nine aphid species but present in other insects. These were initially designated as genes lost in aphids. We then used TBLASTN v2.12.0 to search for these potentially lost genes in the genomes of the nine aphid species. Additionally, we validated the presence of these lost genes by examining the transcriptome of S. heraclei, as they may be hidden genes resulting from assembly errors. Finally, we manually searched the NCBI147 and UniProt148 databases to determine if these genes exist in the aphids and whether other species possess them.
We used the same approach to search for species-specific duplication genes in N. formosana. Homologs among the nine chromosome-level aphid species were identified by the default parameters of OrthoFinder v2.5.4. Subsequently, we searched the orthogroup results to identify gene families in which all aphid species except N. formosana are single-copy genes. Subsequently, we used the tblastn software to identify the TERT genomic regions in the genomes of the other eight aphid species. We also used IGV v2.12.383 to examine the genomic assembly continuity of the TERT tandem duplication region in the N. formosana genome and the transcript support for the TERT copies.
Additionally, CAFÉ v4.2149 was used to detect contractions and expansions of gene families based on the divergence times of the species. Furthermore, we performed GO term and KEGG pathway enrichment analyses for candidate genes using clusterProfiler v4.0.5150 R package.
Natural selection analysis
The codeml program in PAML v4.5151 package was used to calculate nonsynonymous and synonymous substitution rates (dN/dS). We applied the branch site model and one- and two-ratio models to detect signatures of natural selection on coding genes in the Macrosiphini lineage. Statistical significance was determined using likelihood ratio tests.
Evolutionary analysis of detoxification gene families
We used the BITACORA pipeline82 to identify detoxification genes in S. heraclei and eight other aphid species with chromosome-level genomes (Supplementary Table 4). This approach integrates popular sequence similarity-based search algorithms and GeMoMa for the annotation of gene family copies within genomes. Subsequently, we manually filtered the gene family annotation results based on sequence length and domain integrity to generate high-confidence annotations of detoxification gene families. The maximum likelihood phylogenetic tree was constructed using MUSCLE v5.1152 and iqtree v2.3.6153 with the best-fit model. Additionally, we utilized meme v5.5.7154 (-nmotifs 15 -maxw 100 -minw 10) and pfam_scan.py v1.0155 to identify motifs and functional domains within the detoxification protein sequences, and TBtools-II v2.144156 was used for result visualization. Protein structure prediction and visualization were performed using the SWISS-MODEL web server157 and PyMOL v3.1.3158, respectively.
Statistics and reproducibility
For comparisons between two independent groups, we first assessed data normality using the Shapiro–Wilk test. When normality assumptions were violated (p < 0.05), non-parametric analysis was performed using the Mann–Whitney U-test. This approach was applied to comparisons including chromosome rearrangement rates, transposable element abundance, gene expression levels, and chromosome breakpoint IS versus whole-genome IS analyses. For correlation analyses between two variables, Pearson correlation coefficients were calculated when both datasets satisfied normality criteria. Non-normally distributed data were analyzed using Spearman’s rank correlation. These methods were employed to assess relationships between genome size and transposable element abundance, species diversity, and chromosome rearrangement rates, as well as transposable element abundance and gene expression levels. All experiments were conducted with a minimum sample size of n = 3 biological replicates, defined as independently prepared samples processed through identical experimental conditions. The critical significance value (α) was set at 0.05, with p values <0.05 considered statistically significant.
Reporting summary
Further information on research design is available in the Nature Portfolio Reporting Summary linked to this article.


Responses