A comparison of the meridional meandering of extratropical precipitation during boreal winter: eddy momentum flux versus Eulerian storm tracks

Introduction
During the cold season, extratropical cyclones and fronts are known to explain up to about 90% of midlatitude precipitation1,2. As climate models project a poleward shift of storm tracks in a warmer climate, the connection between the storm track shift and a corresponding precipitation change has recently received increased attention3,4,5,6. Because both storm activity and precipitation inherently operate on intraseasonal timescales, examining their relationship on this timescale is crucial for uncovering the mechanisms driving future changes in precipitation.
In this regard, it is interesting that the study by Besson et al.7 finds that the location of the ascending motion, induced by the upper tropospheric forcing, to be a strong predictor of the direction of (Lagrangian) storm propagation. In contrast, their Eady growth rate measure, which depends on the low-level temperature gradient, provides little information on the propagation direction. The commonly used Eulerian storm track measures (e.g., eddy kinetic energy8; geopotential variance9; meridional wind variance10) also depend on the low-level temperature gradient or baroclinicity, even though the measures can be calculated at either lower or upper levels of the troposphere. The upper-level forcing onto the ascending motion is typically dominated by the convergence of the meridional flux of zonal momentum by eddies, commonly known as the eddy momentum flux (EMF). Thus, from the result of Besson et al.7, one may infer that the poleward shift of individual storm systems, hence the accompanying precipitation, could be more closely linked to the EMF than to Eulerian measures of storm intensity. This is also consistent with the findings that nonlinear horizontal advection of potential vorticity, which includes the EMF, contributes to the poleward shift of storms11,12,13.
From a perspective stemming from the transformed Eulerian mean (TEM) theory14, Yoo and Lee15 hypothesised that the strength of the EMF has a substantial impact on TEM vertical motion, and hence on extratropical precipitation. Consistent with this hypothesis, they found that the precipitation peak shifts from about 40°N to 60°N due to a dipole precipitation anomaly when the EMF exceeds two standard deviations above its climatological value. No such dipole anomaly was observed when the eddy heat flux strength was varied. Yoo and Lee examined only the zonal mean precipitation field in accordance with TEM theory. However, because the EMF varies in the zonal direction, a natural question to ask is whether the meridional shift in precipitation occurs predominantly in the region downstream of the maximum storm track intensity, where the EMF has a local maximum.
The above studies raise the following questions: how do these EMF-induced dipole precipitation anomalies compare in intensity with the dipole precipitation anomalies that could result from a meridional meander of the storm track intensity maximum? Does the meridional shift in precipitation occur primarily downstream of the storm track, where the EMF exerts a strong influence? If the precipitation anomalies associated with the storm track position variability is weaker than that associated with the EMF, this would suggest that the dynamics of the EMF variability is as important as, or perhaps more important than, the variability of the storm track position in explaining the meridional meandering of precipitation. For a nuanced interpretation, we examine precipitation anomalies contributed by a range of different precipitation rates. By doing so, we can address if those precipitation anomalies are caused by heavy, moderate, or weak precipitation events. The analysis is carried out for the Northern Hemisphere (NH) winter, as the eddies and their impact on precipitation are the strongest in winter.
Results
Precipitation distribution associated with EMF
Figure 1a shows the regressed daily DJF precipitation rates against the EMF index (EMFI). Throughout this study, to exclude the impact of interannual variability, each year’s DJF mean is removed from the dependent variables before conducting the regression analysis. However, the results remain essentially the same when interannual variability is not removed (not shown). Here, the EMFI is defined to capture the strength of midlatitude EMF (35°N–55°N and 250–1000 hPa). The index is positive when the EMF is anomalously poleward with respect to its winter climatology, and negative when the EMF is anomalously equatorward (Methods). The precipitation anomalies associated with the EMFI show meridional shifts, with their nodes located near 45°N (shaded). The magnitude of change is large in the downstream region of the climatological storm track (Supplementary Fig. 1 for the pattern of the climatological storm track and precipitation), reaching up to 1 mm day-1 per standard deviation (STD) of EMFI. The dipole pattern is evident for both the Pacific and Atlantic jet exit regions, with enhanced precipitation over 45°N–70°N and reduced precipitation over 25°N–45°N in response to an increase in EMFI. The changes are statistically significant at the 95% confidence level (hatched).

Daily precipitation rate (mm day-1) in the boreal winter season is regressed against the (a) EMFI, b NH PC2, and (c) NH PC1, and the slopes of each grid cell per unit standard deviation (STD) of the indices are shown. Hatched areas indicate regression p-values less than 0.05. The mean explained variance by regression (R2) for the hatched area is shown above each panel. Black contours indicate the regression slopes of storm track activity ( = RMS of band-pass filtered z500 anomaly) against the (a) EMFI, b NH PC2, and (c) NH PC1, respectively. Contour intervals are –15, –5, 5, and 15 gpm per 1 STD of the EMFI. Solid contours represent positive values, while dashed contours denote negative values.
For precipitation, it can be useful to consider anomalies of varying intensities, as the variability of heavy precipitation may differ from that of light precipitation. To explore this, we categorise precipitation days based on precipitation rates and examine how the occurrence frequencies of these categories shift in response to EMFI (Fig. 2). Six precipitation categories are defined using logarithmically spaced bins, and regression analysis is conducted on the normalised frequencies for each category (Methods). Except for the heaviest (greater than 33 mm day-1; Fig. 2a) and marginal (0–1.0 mm day-1; Fig. 2e) precipitation categories, a meridional dipole anomaly is observed in the precipitation frequency changes (Fig. 2b–d), as shown in the precipitation amount (Fig. 1a). The magnitude of the frequency changes is up to 3% and is statistically significant at the 95% confidence level, particularly over the jet exit regions. In addition, an almost identical pattern with the opposite sign is found for the category of no precipitation (0 mm day-1; Fig. 2f). The opposite sign in the no precipitation category indicates a consistent overall change in precipitation with the other precipitation bins; the fraction with no precipitation decreases in regions where moderate precipitation occurs more frequently, and vice versa.
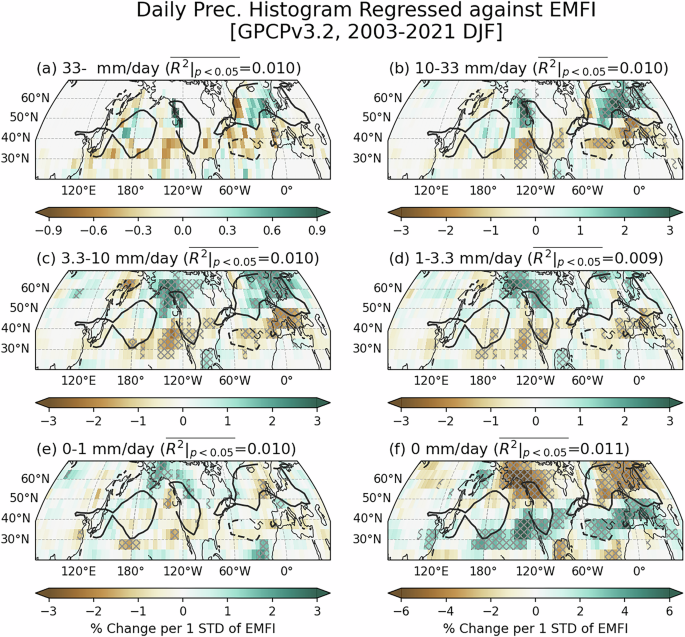
As in Fig. 1, but normalised daily precipitation frequencies in the boreal winter season are regressed against the EMFI. The slopes of each grid cell per unit standard deviation (STD) of the EMFI are shown for six categories of precipitation rate: a > 33 mm day-1, b 10–33 mm day-1, c 3.3–10 mm day-1, d 1–3.3 mm day-1, e 0–1 mm day-1, and (f) 0 mm day−1 (no precipitation). To enhance the legibility of the patterns, different colour scales are used in panels (a) and (f). Here the contours indicate anomaly patterns of reconstructed storm track activity, obtained from the RMS of band-pass filtered z500 anomalies regressed against EMFI.
For the heaviest (Fig. 2a) and the marginal (Fig. 2e) precipitation categories, the changes in the frequency of occurrence are relatively modest. In the former, a meridional dipole, consistent with the anomalies in the other non-zero precipitation categories, is present only over the North Atlantic. In the latter, a similar meridional dipole is discernible only over the North Pacific.
One might ask whether the meridional redistribution of precipitation shown in Figs. 1a and 2 can be attributed to the changes in storm track activity associated with the EMF. This is plausible because the EMF, especially that generated by synoptic eddies, is inherently related to storm track activity. To investigate this relationship, we perform a regression analysis of an Eulerian storm track activity measure (i.e., the root-mean-square (RMS) of the bandpass filtered z500 anomaly; defined in Methods) against the EMFI (contours in Figs. 1a and 2). In the North Atlantic, regions of increased or decreased precipitation coincide somewhat with regions of increased or decreased storm track activity. In the North Pacific, however, the storm track changes show a monopole structure. As a result, changes in precipitation occurrences generally do not overlap with changes in storm track intensity. Moreover, the intensity change in the storm track associated with the EMFI is about 5 gpm, which is about one-fifth of one standard deviation change in storm track intensity (Supplementary Fig. 2). The weak relationship between the EMFI and storm track activity indicates that the changes in precipitation distribution associated with the EMFI are not caused by changes in storm track intensity, particularly over the North Pacific. This discord between the EMF and the storm track intensity is somewhat expected, because the strength of the EMF depends not only on the eddy amplitude, but also on the horizontal tilt of the eddies16,17. In fact, without the tilt, the EMF is zero regardless of the magnitude of the eddy amplitude.
Precipitation distribution associated with storm tracks
The above results lead us to our question of whether meridional shifts in the storm track itself are associated with comparable meridional shifts in precipitation. To test this hypothesis, using geopotential variance, we first construct an index that measures the degree of north-south storm track shifts over the North Pacific and North Atlantic (Supplementary Fig. 2). Previously, Lau9 performed a similar Empirical Orthogonal Function (EOF) analysis of the storm track separately for the North Pacific (25°N–70°N, 100°E–110°W) and the North Atlantic (25°N–70°N, 110°W–40°E) regions. (These results are provided in the Supplementary Information.) In the present study, for a direct comparison with the EMFI, which is based on the zonal mean eddy momentum flux, the EOF analysis is carried out for the zonal mean of the entire NH (25°N–70°N, 180°W–180°E). It turns out that the first EOF expresses changes in storm track intensity (Supplementary Fig. 2e), with monopole anomalies collocated with the climatological maxima over each ocean basin (Supplementary Fig. 1a). The second EOF exhibits a dipole pattern that accounts for a meridional shift in the zonal-mean storm tracks (Supplementary Fig. 2f). The EOF results are consistent with those of Wettstein and Wallace18. Therefore, we use the second principal component (PC2) of the NH as our index for the meridional shift of the local storm track activity metric and the first PC (PC1) of the NH as a reference for changes in storm track intensity. The PCs show weak correlations with the EMFI, with simultaneous correlation coefficients of 0.171 for PC1 and 0.048 for PC2. They are 0.110 and 0.022, respectively, when the interannual signals are removed from the EMFI.
1) Meridional shifts of storm tracks
To identify horizontal patterns corresponding to the hemisphere-wide storm track shift, we perform a regression analysis of the storm track anomaly against NH PC2 (contours in Figs. 1b and 3). The pattern shows broad negative anomalies from 30°N to 55°N and positive anomalies poleward of 55°N, indicating a hemisphere-wide poleward shift of the storm track activity. In each basin, the pattern is comparable to that found in the regional EOFs (Supplementary Fig. 2b, d).
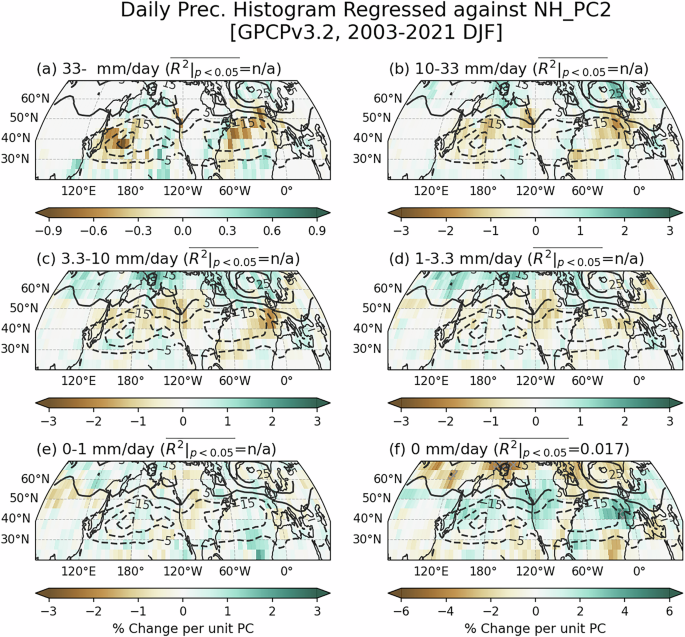
As in Fig. 2, but the binned daily precipitation occurrence frequencies are regressed against NH PC2 of the zonal mean storm track activity for six categories of precipitation rate: a > 33 mm day−1, b 10–33 mm day−1, c 3.3–10 mm day–1, d 1–3.3 mm day−1, e 0–1 mm day−1, and f 0 mm day−1 (no precipitation). When the number of significant grid cells is less than or equal to 5, the mean R2 value is marked as “not available (n/a).” Here the contours indicate anomaly patterns of re-constructed storm track activity, obtained from the RMS of band-pass filtered z500 anomalies regressed against NH PC2.
As expected, precipitation tends to decrease in the region of reduced storm track activity and increase in the region of enhanced storm track activity (Fig. 1b). However, the precipitation anomaly tends to be amplified in the downstream region, although this is not as pronounced as in the EMFI case. The minimum and maximum values are –0.64 and 0.43 mm day-1 in the North Pacific and are –0.74 and 0.42 mm day-1 in the North Atlantic for NH PC2 (Fig. 1b). The magnitudes of the slopes are smaller than those values for EMFI (i.e., –0.77 and 1.25 mm day-1 in the North Pacific and –0.97 and 1.11 mm day-1 in the North Atlantic; Fig. 1a). Also, the percentages of statistically significant grids in the entire NH are 20.14% and 3.33% for EMFI and NH PC2, respectively (hatched in Fig. 1a, b).
The precipitation anomaly associated with the NH PC2 (Fig. 1b) is largely explained by the changes in precipitation frequencies for the moderate-to-heaviest precipitation categories, as well as no precipitation category (Fig. 3). Reduced frequencies of occurrence are observed in the region of decreased storm track activity, while the opposite is true for no precipitation category. However, the precipitation regression slope against NH PC2 tends to be slightly smaller than that against EMFI (about 2% versus 3% in moderate-to-heavy (Fig. 3b–d) precipitation categories), further suggesting that the relationship between precipitation anomalies and the EMF is as strong as that with storm track variability (see also the comparison between Fig. 1a, b).
Figure 3b, c show an interesting characteristic that precipitation dipole anomalies tend to occur downstream of the peak storm track anomalies. For example, there are prominent dipole anomalies (for the categories 10–33 mm day-1 and 3.3–10 mm day-1; Fig. 3b–c) over the eastern end of the North Atlantic Ocean and part of western Europe, and this area is located downstream of the storm track peak. The pattern for the no-precipitation category also shows anomalies off-centred from the peak storm track anomaly (Fig. 3f). For the categories of 1.0–3.3 mm day-1 and 0–1.0 mm day-1, the precipitation anomalies are relatively weak and their patterns show little agreement with the storm track anomaly pattern (Fig. 3d–e). For the heaviest category (greater than 33 mm day-1), however, in both ocean basins, the centre of negative precipitation anomalies coincides with that of negative storm track anomalies (Fig. 3a). These results overall indicate a lower sensitivity of precipitation to the shift in the storm track than to EMFI.
2) Pulsation of storm tracks
Next, we examine how the precipitation distribution changes in association with NH PC1, a measure of hemisphere-wide storm track intensity (shaded in Supplementary Fig. 3). We find that the precipitation anomalies closely align with the storm track intensity, with precipitation increasing by approximately 1 mm day-1 in regions where storm track intensity is enhanced (Fig. 1c). Specifically, the minimum and maximum values are –0.45 and 0.90 mm day-1 in the North Pacific and are –0.46 and 0.99 mm day-1 in the North Atlantic, and the percentage of statistically significant grids in the entire NH is 8.33%. The magnitude of these values is overall larger than those associated with NH PC2, but smaller than those associated with EMFI. Notably, the precipitation anomaly here is located upstream of the climatological storm track, in contrast to the precipitation anomalies associated with either the EMFI or the NH PC2. Furthermore, the precipitation anomaly of NH PC1 is mainly due to changes in the frequency of the heaviest category (greater than 33 mm day-1; Supplementary Fig. 3a), rather than by changes in the moderate to heavy categories. The match between the frequency change of the heaviest category (shaded) and the changes in the storm tracks (contours) can also be seen in Figs. 2a and 3a. This leads to the speculation that the variability of the heaviest precipitation category is likely related to the pulsation of the storm tracks. For other categories, the agreement between the precipitation frequency and storm track intensity anomalies is weaker.
Moisture transport
Previous studies have shown that the poleward shift in precipitation is associated with an increase in the intensity and frequency of poleward moisture transport15,19,20,21. Consistently, we find that the integrated moisture transport (IVT) convergence helps interpret the precipitation changes associated with the EMFI and NH PCs (Fig. 4). The IVT convergence regressed onto the EMFI shows positive anomalies over the North Pacific near Alaska and the eastern North Atlantic, while negative anomalies are present along the western side of the North Pacific and the North Atlantic and in various subtropical regions (Fig. 4a). These IVT convergence anomalies closely resemble the precipitation anomalies associated with the EMFI (Fig. 1a). Figure 6 in Yoo and Lee15 shows that when EMFI is large (i.e., during an anomalously poleward EMF), eddies exhibit anomalously strong southwest-northeast tilts, as expected, and precipitation occurs to the northeast downstream of these tilted eddies. This indicates that anomalously strong poleward moisture transport is facilitated by the strong northeastward flow, which simultaneously results in a large EMFI.
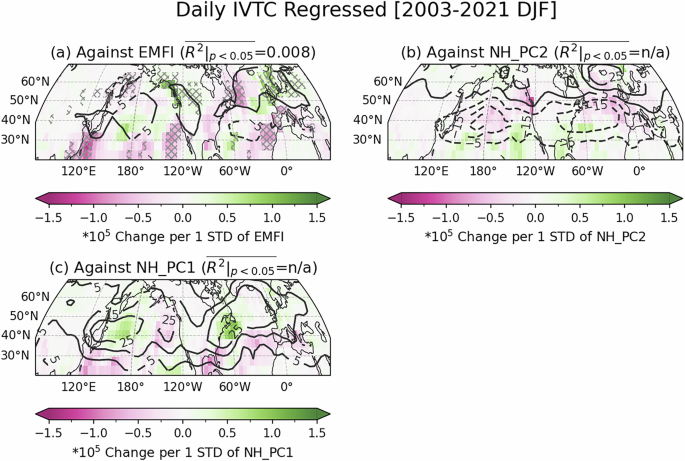
As in Fig. 1, the convergence of the IVT is regressed against (a) EMFI, b NH PC2, and (c) NH PC1. Changes in the storm track activity are overlaid with contours.
To examine whether the IVT pattern shown in Fig. 4a aligns with this physical picture, the covariance between the eddy components of the daily 700 hPa zonal wind (({u}^{* })) and the meridional wind (({v}^{* })) at each grid point is regressed against EMFI (Fig. 5). Here, the superscript (*) indicates the deviation from the zonal mean. We find that the region of high covariance indeed takes on a southwest-northeast tilt in upstream areas where the precipitation shifts are pronounced. For example, the enhanced ({u}^{* }{v}^{* }) of planetary-scale waves with zonal wave numbers (kle 3) is evident in the North Pacific (centred at 45°N, 180°) and the North Atlantic (centred at 50°N, 40°W) (Fig. 5a). These anomalies are generally located upstream of the positive precipitation anomaly in both the North Pacific and the North Atlantic (Fig. 1a), indicating that the enhanced ({u}^{* }{v}^{* }) coincides with areas of enhanced IVT. Also observed is a negative planetary ({u}^{* }{v}^{* }) anomaly in the subtropical North Atlantic towards the Mediterranean Sea (centred at 40°N, 0°) (Fig. 5a). Consistently, this negative anomaly is located downstream of the negative precipitation anomaly in the subtropical North Atlantic (Fig. 1a).
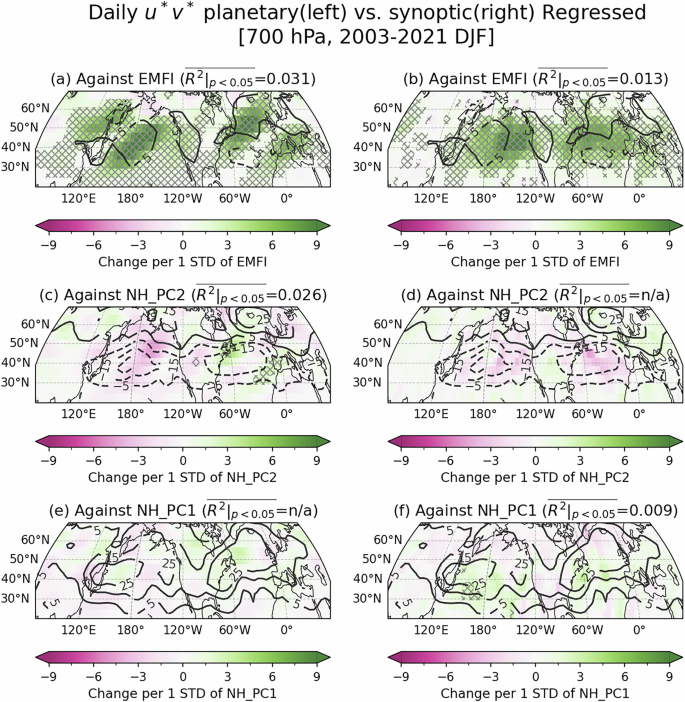
As in Fig. 1, except that the momentum flux (({u}^{* }{v}^{* })) at 700 hPa is regressed against (a, b) EMFI, c, d NH PC2, and (e, f) NH PC1. The left panels show calculations based on the planetary momentum flux, which is derived from the interaction between the zonal and meridional winds of zonal wave numbers (kle 3). The right panels show calculations based on the synoptic momentum flux, the interaction between the zonal and meridional winds for zonal wave numbers (kge 4). Changes in storm track activity are overlaid with contours.
This southwest-northeast tilt of the covariance is caused by planetary-scale waves with zonal wave numbers (kle 3) (Fig. 5a). This result is consistent with the findings of Baggett et al.22, who showed that poleward moisture transport is pronounced when planetary-scale waves are anomalously strong. They demonstrated that the planetary waves transport moisture northeastward while simultaneously diverting shorter ((kge 4)) waves northward. Figure 5b shows that the covariance structure for the shorter waves is mostly zonal; however, Baggett et al.22 also showed that these shorter waves, embedded within the planetary-scale waves, also transport moisture poleward. Therefore, our interpretation of these results is that the EMFI-precipitation relationship arises from southwest-northeast oriented tilts of planetary-scale waves, which directly transport moisture northeastward, but also steer short synoptic-scale waves in the same direction.
The IVT convergence associated with the NH PC2 also aligns with the precipitation pattern (Figs. 5b and 1b), though it generally exhibits smaller regression slopes and lower statistical significance, compared to those of the EMFI (Figs. 5a and 1a). Figure 5c shows that in the North Atlantic, where the poleward precipiation shift is evident, the ({u}^{* }{v}^{* }) covariance by the planetary scale waves once again exhibits a southwest-northeast tilt. Similar ({u}^{* }{v}^{* }) covariance structure is seen neither in the shorter waves (Fig. 5d) nor in those associated with the NH PC1 (Fig. 4c and Fig. 5e, f).
Discussion
This study investigated the meridional shift in the extratropical precipitation distribution to help answer two research questions related to eddy momentum flux (EMF): 1) whether the meridional precipitation shifts associated with the EMF15 occur mostly downstream of the peak storm track intensity; 2) how these precipitation changes compare in their magnitude and location with those associated with storm track variability. The analysis was performed for the Northern Hemisphere and boreal winter using precipitation observations and reanalysis data. Changes in precipitation were analysed by regressing precipitation against EMF and storm track indices. Changes in precipitation distribution were also measured using the frequency of occurrence of the precipitation rate for six categories ranging from no precipitation to heavy precipitation.
For the first question, we found that when poleward EMF is anomalously strong, precipitation increases between 45°N–70°N and decreases between 25°N–45°N. This pattern is attributed to the enhanced frequency of moderate to heavy precipitation (1–33 mm day-1) and to the reduced frequency of no precipitation in the regions. As was hypothesised, in both the North Pacific and the North Atlantic, these shifts occur downstream of their respective climatological storm track peaks. Changes in moisture transport associated with the EMF are responsible for the meridional precipitation shift, which appears to be driven primarily by planetary-scale waves tilted in a southwest-northeast direction.
To address our second question, we examined precipitation variability associated with the meridional displacement in storm track anomaly (NH PC2). The result showed that the precipitation changes associated with the NH PC2 were notable only downstream of the storm track shift, with minimal changes observed upstream. Additionally, these downstream anomalies are smaller in spatial extent and weaker in amplitude than the precipitation anomalies associated with the EMF. Therefore, we conclude that the meridional meander of the moderate-to-heavy precipitation events is more closely tied to the EMF than to the meridional meander of the storm track itself, at least for the measure used in this study.
The above results remain robust when regionally defined storm track indices (Supplementary Fig. 2a–d) are used to examine their influence on precipitation distribution changes (Supplementary Figs. 4–7). Larger precipitation anomalies are found when regional storm track indices are used over the corresponding ocean basins. This is expected, since regionally sampled storm track changes are more than twice as strong as those sampled globally (see contour intervals). Nevertheless, qualitatively the pattern of precipitation changes remains almost unchanged for all categories.
These findings support the conclusion of Yoo and Lee15 that variability of EMF strength plays a critical role in driving sizable meridional shifts in precipitation. Vertically integrated moisture transport was responsible for the precipitation changes, indicating that variations in moist and dry air transport play a crucial role in driving these precipitation meanders. This again supports the idea expressed in Yoo and Lee15 that EMF-driven precipitation variability is intimately linked to dry intrusions and warm moisture conveyor belts, which frequently occur in extratropical storm systems.
The main results of this study indicate that for moderate to heavy precipitation, the EMF-precipitation relationship does not arise due to its association with variability in storm track intensity. Instead, the relationship arises because the EMFI reflects southwest-northeast wave tilts of planetary-scale waves. The planetary scale eddy flux is not independent of the storm track eddies, however, because the tilts are most pronounced in the jet exit regions where northward migration of storm track eddies is most frequent23. Consistent with this picture, Baggett et al.22 showed that synoptic-scale eddies are steered northward by the planetary-scale waves. Since this steering would be captured by Lagrangian storm-track measures, it may be that Lagrangian storm-track measure are likely to better align with precipitation and EMF. It would be interesting to explore this possibility in a future study.
The sign and magnitude of the EMF are primarily governed by large-scale dynamical factors, including horizontal shear, the potential vorticity gradient, and the Rossby wave refractive index. While these large-scale fields are influenced by the latent heating associated with precipitation, precipitation itself is a higher-order component of the general circulation in the extratropics compared to these large-scale dynamical factors. For example, dry model simulations successfully capture the mean structure of the extratropical precipitation as a result of passive tracer transports by large-scale flow24. From this perspective, our findings indicate that not only the storm location and amplitude, but also the dynamics of the horizontal eddy tilt need to be considered to improve weather prediction and climate projection of the location and intensity of extratropical precipitation in a warmer climate.
Methods
a) Precipitation and reanalysis data
We use daily precipitation rate from the Global Precipitation Climatology Project version 3.2 (GPCPv3.2)25, which can be downloaded from NASA’s Goddard Earth Sciences Data and Information Services Center (https://www.earthdata.nasa.gov/eosdis/daacs/gesdisc). The dataset is constructed by integrating data from multiple sources, including satellite and in-situ observations. It spans from 2000 to 2021 and has a spatial resolution of 0.5° latitude by 0.5° longitude. Here, we focus on 19 boreal winter seasons (December–February, DJF) from December 2002 to February 2021 in the Northern Hemisphere (20°N to 70°N).
To define the eddy momentum flux and storm track indices, we utilize daily data of the fifth generation of the atmospheric reanalysis product from the European Centre for Medium-Range Weather Forecasts (ERA5)26 for the same 19 boreal winter seasons from December 2002 to February 2021. The data, obtained at six-hour intervals from 00 UTC to 18 UTC from the Copernicus Climate Change Service website (https://cds.climate.copernicus.eu/), is averaged to daily means.
b) Precipitation histogram
The GPCPv3.2 data is degraded to 5°×5° by converting the precipitation rates into a histogram form. Specifically, each 5° grid cell is constructed with 100 original precipitation rates at 0.5° resolution. Precipitation categories are defined by the following six logarithmically spaced bins, normalised to the frequency distribution, similar to the approach of Jin et al.27: 0 mm day-1 (i.e., no precipitation), 0–1.0 mm day-1, 1.0–3.3 mm day-1, 3.3–10 mm day-1, 10–33 mm day-1, and greater than 33 mm day-1. The occurrence frequency of the precipitation categories are used as independent variables in regression analyses with other time series, such as EMF and storm track indices. We note that GPCPv3.2 has an intrinsic discontinuity in the data due to the launch of the Global Precipitation Measurement mission (May 2014), particularly over the ocean (Supplementary Fig. 8). To address this issue, the anomalous frequency distributions are obtained separately, i.e., 12 DJFs (2003 to 2014) and 7 DJFs (2015 to 2021) when performing the regression analysis.
c) Eddy momentum flux index, storm track, and moisture transport
To quantify the strength of the daily eddy momentum flux (EMF;(left[{u}^{* }{v}^{* }right])) in the midlatitude, we follow Yoo and Lee15 and construct an EMF index (EMFI) by comparing the daily EMF with the climatological wintertime EMF in the midlatitude. Here, (u) is the zonal wind, (v) is the meridional wind, the superscript (*) denotes the deviation from the zonal mean, and the bracket represents the zonal mean. The alignment between the two is assessed by projecting the daily EMF onto the climatological EMF, adjusted by a cosine latitude factor, and averaged over all DJF seasons (Eq. 12 in Yoo and Lee15). The projection focuses on the region spanning 35°N–55°N and 250–1000 hPa, chosen to capture the peak of DJF EMF convergence between 40°N and 50°N. The resulting index is then standardized using its mean and standard deviation. We note that, by definition, the EMFI includes contributions from both stationary and transient eddies.
The storm track is defined using the daily 500 hPa geopotential height (z500)9. Originally, Lau9 calculated the storm track activity using the monthly root mean square (RMS) z500 anomalies from the respective monthly means after applying a 2.5–6-day bandpass filter to bidiurnal data. In this study, we modify the approach as follows: First, the daily 0.25° ERA5 data is coarsened to 5° resolution in the region from 25°N to 70°N (i.e., 9 by 72 grid cells), and 2–6-day bandpass filtered data is obtained by combining a 1-2-1 filter and a Lanczos high-pass filter of 6 days. Second, the monthly RMS is replaced by the daily RMS based on a rolling mean. Specifically, the daily RMS is computed from a 5-day rolling time window deviated from a 31-day rolling mean, with the centres of the 5-day and 31-day time windows are aligned on the day the RMS is recorded. These daily RMS values for 90 days, starting on December 1 of each year from 2002 to 2020, provide 1710 days of data over 19 years. Lastly, a data array of 1710×9×72 is used for the EOF analysis to obtain the leading mode of variability that corresponds to the storm track activity (Supplementary Fig. 2). The first and second EOF modes explain 16.8% and 10.9% of the storm track variability in the North Pacific, 17.5% and 10.6% in the North Atlantic, and 53.2% and 22.5% in the zonal mean NH, while the contribution of higher order EOFs is negligible (not shown).
We use the vertically integrated moisture transport (IVT)28,29,30,31 to quantify the changes in moisture transport resulting from either the EMFI or the storm track activity. The IVT is usually calculated by summing the product of specific humidity and wind vector from the surface to the top of the atmosphere (e.g., see Eq. 2 in de Vries32). In this study, the divergence of IVT is computed in similar way:
where (g) is the gravitational acceleration, (q) is the specific humidity, and (p) is the pressure. The pressure at the top of the atmosphere (({p}_{{top}})) is set to the 300 hPa pressure level.
d) Calculation of regression slopes and their Significance test
In this study, regression slopes are calcualated using daily data for 19 DJF seasons (19 years × 90 days per each DJF = 1710 days). The anomalies of each dependent variable are calculated separately for each DJF season by subtracting the DJF mean, and these anomalies are combined to build an anomaly time series of 1710 days. This approach helps exclude the effect of interannual variability.
Under the assumptions of simple linear regression, the test static for the regression slope is known to follow a t-distribution, which is sensitive to the degrees of freedom. In this study, we employed an estimated effective degrees of freedom derived from the autocorrelation and cross-correlation of the two timeseries33. In addition, repeated regression analysis for hundreds grid cells can increase the chance of “false positive” error. To minimize this error, we employed modified false discovery rate (mFDR) approach34.
For all figures, the mean explained variance (R2) is calculated only for the grid cells identified as significant at 95% confidence level (p-value < 0.05; after screened by mFDR method). We note that the absolute R2 values are inherently low due to the characteristics of daily precipitation frequency data which often contain many zeros and ones while intermediate values are few. If the number of significant grid cells are less than or equal to 5, the mean R2 is marked as “not available (n/a).”


Responses