A computational unfolding-based design method for three-dimensional conformal electronic skin with adjustable mounting strain

Introduction
Human, robots, and most of intelligent machines have curved body surfaces generally used for mounting various sensing modules, which has led to the evaluation of sensing electronics from rigid to flexible, to stretchable, and now to three-dimensional (3D) conformal. 3D conformal electronic skin (E-skin) that can envelop the target surface conformally with low deformation and acquire contact information accurately at any site of surface, have great potentials in human–machine interaction1,2,3, healthcare monitoring4,5, etc. Recently, the methods, including directly curved-surface manufacturing (such as 3D printing6, transfer printing7, thermoforming8, or other in-situ fabrication methods) and dimensional converting9,10,11, to develop 3D conformal electronics have been further investigated and applied for curved circuits12,13, conformal antennas14,15, electronic eyes16,17, conformal E-skins18,19, and etc. However, compared to the other conformal electronics, the 3D conformal E-skins often require the complicated calibration process on curved surface after fabricating or mounting to acquire accurate sensing performance on curved surfaces. The calibration process would become more and more cumbersome and time/cost-consuming as the E-skins are mounted onto large and complex mounting surfaces, which considerably restricts the advancement of 3D conformal E-skins. The calibration on curved surfaces is inevitable for 3D conformal E-skins directly fabricated onto curved surfaces, such as E-skins fabricated by ink-jet printing or other in-situ fabrication methods. But for 3D conformal E-skins manufactured by dimensional converting methods, considering that lower mounting strain of E-skins could lead to more similar performance calibration results on curved and flat surfaces20, the calibration on curved surfaces can be substituted by traditional calibration on flat surfaces. Therefore, advancing dimensional converting methods for fabricating 3D conformal E-skins capable to mount curved surface conformally with low or adjustable mounting strain is bound to give a strong impetus to 3D conformal E-skins more vigorous development and broader application.
The dimensional converting method enables electronics to be 3D by using external stimuli, including light21, force22, magnetism23 and so on, on stretchable and flexible materials24,25,26 and/or structures27,28,29. Wherein, the Kirigami method, being a kind of dimensional converting approach30, is applicable to nearly all types of materials and is prone to controlling the mounting strain of fabricated electronics. This is because it usually makes electronics conformal by physically cutting them into stretchable structures31,32,33,34. But stretchable structures prevent conformal electronics from fully covering the target surface of objects35, thereby constraining the effective detection area for E-skins. Recently, a computational Kirigami method of unfolding polyhedrons to approximate curved surfaces36,37 has garnered attention in the fields of 3D conformal electronics because the mounting strain can be adjusted by the number of polyhedrons. These 3D conformal electronics designed by the polyhedral unfolding method can envelop the entire target surface38 and improve the matching performance between interfaces. Subsequently, another advanced design strategy of integrated 2D unfoldings was reported to connect all the polygons in 2D unfolding for ease of mounting39. However, when the morphological parameters of target surfaces vary widely, the methods40 require all mesh to adopt high hierarchy levels to achieve both unfolding and low-strain mounting, leading to excessive mesh counts. This results in a trade-off between mounting strain and the number of units40. Hence, research in adapting the number or size of units to the topography of target surface based on polyhedral unfolding method is of utmost significance in enhancing the controllability of sensing units of number and mounting strain. This will facilitate 3D conformal E-skins to avoid the complex calibration on curved surface as the mounting strain decreases to a sufficiently low level.
In this article, we present a novel design strategy that combines integrated electrodes and hierarchical tactile force sensors via polyhedral 2D unfolding for 3D conformal E-skins. The mounting strains of tactile force sensors are controlled by the size of mesh units. All the tactile sensors on curved surfaces can be adjusted to possess low mounting strain, enabling them to be characterized by the traditional calibration results on flat surfaces and thereby obviating the need for curved surface calibration, which represents a significant advantage compared to the E-skins fabricated directly onto curved-surface. The contour structure of integrated electrodes is designed by eliminating the boundaries between polygons in the target surface 2D unfolding, and the internal structure of the electrodes serves as the connected circuits. The contour structure of tactile force sensors is formed by splicing single or multiple polygons in the target surface 2D unfolding. The layout of sensors is associated with the curvature of surface, spatial resolution, and sensing accuracy requirements. Specifically, large-size sensors are arranged in the positions with large radius of curvature, low spatial resolution, and low detection accuracy. The strategy of strategically arranging multi-level sensing units based on the morphological parameters of the target surface effectively reduces the total number of cells while achieving a balance between sensing units’ density and mounting strain. Each tactile force sensor is designed as a module for low-cost and rapid repair of localized damage to E-skin. Additionally, a mechanical theoretical model of mounting state of tactile force sensors with different contour sizes on surfaces is investigated to provide an evaluation method for balancing mounting strain and unit number. Based on the proposed design strategy, an example of E-skin for rehabilitation ball is developed, which consists of three levels of tactile force units. The maximum principle strain is utilized for characterizing the mounting strain, and those of three levels of units are approximately 13.07%, 3.89%, and 1.04%. The relative changes in performance indexes, such as initial resistance, hysteresis, and detection deviation before and after mounting are about (5.13%, 13.46%, and 22.21%), (1.67%, 7.95%, and 4.17%), and (1.08%, 6.36%, and 1.53%) for level I, II, and III units, respectively. In the applications of rehabilitation ball or others with moderate detection accuracy, this demonstrates that the calibration results before mounting can be utilized for level II and III with low relative changes in performance indexes. Furthermore, research on the detection of human grip strength is carried out, which can provide the magnitude and distribution of contact force to judge the health status of muscles in the patient’s hands and forearms and provides a basis for accessing the patient’s further development of the rehabilitation treatment plan.
Results
Design strategy of 3D conformal skin
Applications of the polyhedral unfolding method to design 3D electronics can improve the conformality and array expansion capability of electronics. Figure 1A illustrates the large strain and interface mismatch phenomenon generated by stretchable and flexible E-skin when mounted onto the curved surface, while the E-skin designed by the polyhedral unfolding method have excellent conformal mounting characteristics with generally low mounting strain. Thus, setting the 2D unfolding of target surface as the E-skin contour structure and distributing sensing units on the mesh units of unfolding will reduce mounting strain remarkably and isolate sensing units. The design strategy of the E-skin includes hierarchical-size units and integrated unfolding, are displayed as in Fig. 1B. The units with small size help to reduce the mounting strain, the hierarchical-size units cater to the curvatures of target surface, which help to realize the accurate regulation of overall electronic array mounting strain. The integrated unfolding design enables the effective connection of all the units and solves the signal output circuit design problem of 3D electronic unit array. Arranged scanning circuit in the integrated unfolding would fulfill the high-speed acquisition of output signals. An E-skin mounted onto sphere surface is given as an example. Based on the contour shape of units and integrated unfolding, the design and mounting process of the integrated electrode and hierarchical tactile force sensing units are illustrated in Fig. 1C. It also displays an actual picture of the mounting performances of 3D conformal E-skin based on three-level tactile force sensing units and an integrated electrode. The way of combining hierarchical-size units and integrated electrode makes sensing units modularized and maintained easily.

A The mounting effect of E-skin is based on the stretchability and polyhedral unfolding method. B Two strategy for contour design of hierarchical tactile force sensing units and integrated electrode. C Schematic diagram of the mounting process of an example (An E-skin mounted on the sphere curved surface and the actual image after mounting).
To verify the conceive that proposed design strategy can facilitate the 3D conformal E-skins to avoid the complex calibration, the influence of the combined effects of various mechanical deformations on sensing units after mounting should be analyzed. The maximum/average principal strain is selected and calculated to quantitatively characterize the combined effects of various mechanical deformations, thereby constructing the relationship between the maximum/average principal strain and the performance changes of sensing units. If the performance changes of sensing units reduce to the level that is negligible for practical applications with the decrease of principle strain, the curved-surface calibration results can be replaced by the flat-surface calibration results for 3D conformal E-skins. To show the versatility of the strategy, a spherical surface (a typical non-developable surface) is selected as the target surface and the tactile force sensors that are easily affected by mounting strain form the 3D conformal E-skins.
Figure 2A depicts the design method of 3D conformal E-skin with target surface geometry. Firstly, the initial grid size for meshing geometry can be determined based on the requirement for spatial detection resolution, then the target surface is unfolded into a 2D mesh unfolding through meshing and polygonal edge unfolding methods (eg., the steepest edge tree and flat tree unfolding algorithms)41. It is worth noting that once the triangular unfolding of the target surface is obtained, the area of this unfolding will be calculated and compared with that of the target surface. Subsequently, a scale factor is utilized to approximate the area of the unfolding to that of the target surface, thereby ensuring that the sensing units can completely cover the target surface. Inevitably, overlap or gaps will arise between the adjacent sides of the sensing units due to deformation. Nevertheless, these have a negligible effect on the mounting strain, since the overlap is on a very small scale and the gaps are minute. Hence, the influence of overlap/gaps on the mounting strain is ignored. Secondly, the mesh unit sizes and their corresponding geometrical topography (eg., main curvatures) at the mounting positions are extracted. Based on the mechanical theoretical model of arbitrary-shaped units mounting onto general surfaces conformally as presented in Supplementary Fig. 142, the mounting status and strain of all the mesh units are solved in Supplementary Note I. From the solution to mounting strain, it is found that larger mesh unit sizes and greater curvature result in larger mounting strain for mesh units. Since the target surface is specified, the curvatures are constant. Thus, under the condition that the materials of the mesh units and the target surface remain unchanged, the mounting strain can only be adjusted by the sizes of the mesh units. Generally, the relationship between mounting strain and performance changes of 3D conformal E-skins is unknown. It is difficult to directly provide quantitative indicators to evaluate whether the mesh levels are appropriate. Therefore, we can preset a mesh according to Supplementary Fig. 2A and the curvatures of the target surface, then calculate the actual mounting strain and obtain the relative changes in performance through calibrations. If the relative changes in performance of 3D conformal E-skins can be negligible for applications, the mesh size is appropriate. If not, the mesh will be cut into smaller sizes by the midpoint subdivision algorithm. From this method, the critical mounting strain will be obtained. Here, the expected critical values are assumed to be known. By comparing the mounting strain of all the mesh units with expected critical values, the midpoint subdivision algorithm is used to deal with the mesh units that do not meet the requirements. The midpoint subdivision algorithm is that it divides a mesh unit into four small mesh units by cutting it from the lines connecting the midpoints. Then, the layout of hierarchical mesh units is obtained again while ensuring complete closure between different levels of units. Furthermore, the minimum size of mesh units is extracted as mesh seeds to re-grid the target surface and unfold the acquired 3D mesh model, improving the accuracy of reconstructing the 3D target surface. Then, eliminating the inter-mesh boundaries in 2D unfolding obtains the integrated unfolding, and re-layout the hierarchical mesh units to fully cover the integrated unfolding. At last, modular and hierarchical tactile force sensing units are designed based on the layout and contour structure of hierarchical mesh units. The modularized characteristic improves the maintainability and practicality of the E-skin. The integrated electrodes are designed according to the integrated unfolding and layout of mesh units, and the flexible printed circuit (FPC) ports are set on the integrated electrodes to facilitate the output of tactile force signal.
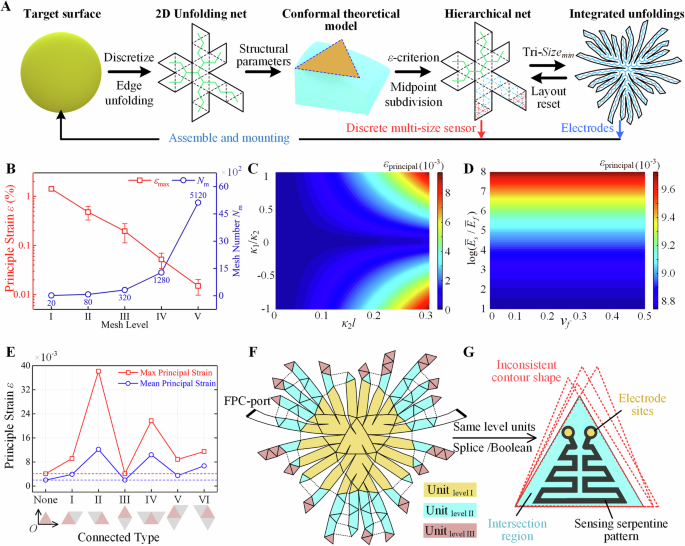
A The design method of hierarchical tactile force sensing units and integrated electrode based on 3D target surface. B The relationship between maximum mounting principal strain and mesh number with mesh levels. C The effect of surface topography and unit size on maximum principal strain. D The effect of material properties of E-skin and surface on maximum principal strain. E Comparison of non-modular design and modular design on the maximum and average principal strain. F Three-level unit layout for a rehabilitation ball. G Structural design of the tactile force sensing unit.
The spherical surface is a typical non-developable surface. Taking a spherical surface with a radius of 100 mm as an example, the surface and mesh materials are set as rubber and polydimethylsiloxane (common materials for E-skins) for calculation mounting strain, respectively. The mounting strain is defined for characterizing the deformation of sensing units after mounting. It encompasses all strains, including the maximum, average, and minimum principal strains, as well as three-directional strains. Herein, the principal strains are primarily used for characterizing the mounting strain. Then, the number of mesh and the maximum principal strains of mesh units vary with mesh level, as shown in Fig. 2B. That provides a basis for balancing the mesh number and mounting strains, and the level I mesh unit is a face of inner orthotic dodecahedron (the value of mesh edge lengths and the average mounting strains at different mesh levels are shown in Supplementary Fig. 2). As the number of mesh levels increases, the mesh number increases as an exponential function and the maximum mounting principal strain decreases rapidly. (As Mesh level = V, mesh number = 5120, maximum principal strain is about 1%). Figure 2C illustrates the relationship between the maximum principal strain of mesh units, the surface topography parameters (principal curvature κ1, κ2), and the edge length of mesh units. Keeping the maximum principal curvature κ2 constant, the closer the target mounting surface is to a sphere and the larger the mesh edge length is, the larger the maximum principal strain would be. This facilitate to mesh unit layout: arranging high-level mesh onto the position where the curvature is large or the main curvature ratio is close to 1, would effectively reduce the maximum mounting principal strain. Moreover, when the topography of target surface and mesh unit sizes are stationary, the maximum principal strain can be reduced by adjusting material properties (elasticity modulus, Poisson’s ratio) of the tactile force sensing units and target surface. The relationship between the material properties and maximum principal strain (κ1/κ2 = 1, mesh level II) is presented in Fig. 2D. With setting A (κ1/κ2 = 1, mesh level II, rubber for target surface, polydimethylsiloxane for tactile force sensing units), the distribution of maximum principal strain and each directional strain are solved by conformal mounting mechanics model, as displayed in Supplementary Fig. 3. This can assist in the design of unit-sensitive structure. Figure 2E displays the maximum principal strain and average strain of different non-modular unit layouts with setting A, and the corresponding contour plots of the strain distribution are shown in Supplementary Fig. 4. Compared with the adopted modular unit, the non-modular layouts increase the mounting strain dramatically, which is not conducive to the conformal adhesion of unit. Detailed calculation methods their strain are shown in the Supplementary Note I.
A 3D conformal E-skin designed for a rehabilitation sphere (r = 30 mm) to detect the magnitude of patient’s gripping force is performed as an application illustration. Generally, the process in Fig. 2A should be used for designing this 3D conformal E-skin but is simplified here. Low-level tactile force sensing units are directly arranged in the center area while high-level ones are arranged at the edge of the unfolding, to meet the different detection resolution and accuracy requirements of palm and fingertips. Moreover, three levels mesh are utilized in E-skin design, thereby verifying the relative changes in performance before and after mounting are associated with the mounting strain and the curved-surface calibration results can be replaced by the flat-surface calibration results due to sufficiently low changes.
Figure 2F demonstrates the layout design of the tactile force sensing units and signal output port FPC. Owing to the difficulty in realizing the absolute uniform mesh on the target surface, the unit sizes of same level in the 2D unfolding have deviations. All units of same level are overlapped and arranged together in Fig. 2G, and Boolean operation is utilized to obtain the common area as the sensitive structure arrangement area. This can help the same level of tactile force sensing units have consistency in structural performance. In addition, the mounting strains of all units are solved by conformal mounting mechanics model, and the effects of shape parameters (α, β, γ) on the mounting strains for same level of units are analyzed in Supplementary Fig. 5. This helps to obtain the actual mounting strains of all sensing units. The tactile force sensing unit consists of electrode sites, a sensing structure, and a substrate layer, as shown in Supplementary Fig. 6. Wherein, the electrode sites are employed for connecting to the integrated electrodes, the sensing structure is designed as a serpentine structure to cover the mesh unit as much as possible, and the substrate shape is consistent with the contour of the mesh units. A total of 38 × 2 units is arranged on the integrated electrode, where 12 or 13 units are arranged in one group to form two signal detection circuit with 3 rows and 13 columns. The integrated electrodes are, from top to bottom, top electrode layer, vertical electrode/flexible substrate layer, and bottom electrode layer (Supplementary Fig. 7 and Supplementary Fig. 8). The structural details of integrated electrode, sensor units, and signal output equivalent circuit (Supplementary Fig. 9) are illustrated in Supplementary Note II.
Performance calibration experiments on planer and curved surface
Considering that only the mounting strain was solved while the performance changes caused by mounting are not clear, performance calibration experiments on both planer and curved surface are conducted to validate that increasing the level of sensor unit (smaller size) can reduce the changes in sensing performance before and after mounting effectively. Taking the sensor unit II as an example, the fabrication process, and the methods and devices for plane and curved surface calibration of the sensor unit at all levels are shown in Supplementary Fig. 10 and Supplementary Fig. 11, respectively. And the details in fabrication and calibration are provided in “Experimental” Section. The static and dynamic performance test results of the sensor units before and after mounting are shown in Fig. 3.
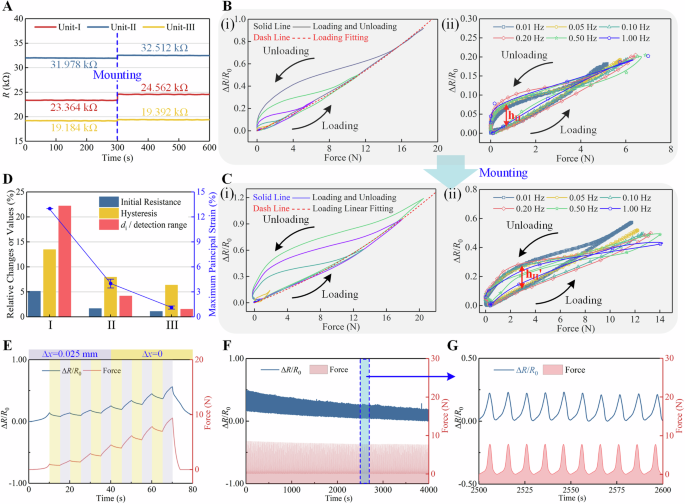
A Initial resistance. B Relative resistance changes of sensor unit II before mounting with various force or frequency: (i) force and (ii) frequency. C Relative resistance changes of sensor unit II after mounting with various force or frequency: (i) force and (ii) frequency. D Maximum principal strains of all sensing units and relative changes before and after mounting in initial resistance, hysteresis, and detect deviation. E Step-wave loading response of sensor unit II after mounting. F Cyclic loading of sensor unit II after mounting. G Local enlargement of cyclic loading of sensor unit II after mounting.
At first, the initial resistance tests before and after mounting for the level I–III sensor units were carried out, and the results are shown in Fig. 3A. The relative changes in static resistance before and after mounting of level I–III sensor units were 5.13%, 1.67%, and 1.08%, respectively, which shows a decreasing trend, indicating that small sensor unit size will have lower the mounting strain and changes in initial resistance before and after the mounting. Then, dynamic loading tests before and after curved surface mounting were conducted for the I–III level sensor units. Supplementary Fig. 12 shows the loading curves by fitting the collected data before and after mounting of the level I–III sensor units. The deviation d represents the maximum difference in the abscissa (contact force) between the planar and curved calibration curves under identical relative resistance change signals. Through comparing these curves, it is found that the maximum detection deviation value d is positively correlated with the level of units, and dIII is the smallest. When converting contact forces to pressure, level I units exhibit lower pressure than level II and III units under the same force. As shown in Supplementary Fig. 12G–I, level I units already demonstrate higher deviations d at low applied pressures compared to level II and III units. Furthermore, as the relative resistance change increases (corresponding to higher applied pressures), the deviations d of level I units escalate more significantly than those of level II and III units. These results collectively indicate that deviations d between pre- and post-curved-mounting decrease with increasing unit level. These results demonstrate that deviations between pre- and post-mounting decrease with increasing unit hierarchy level. This demonstrates that lower deformation of high-level units leads to lower detection deviation before and after mounting. To further compare the dynamic performance differences of level I–III sensor units before and after mounting, the loading/unloading amplitude and frequency were varied. The response curves of the levels I–III sensor units under different loading/unloading amplitudes and frequencies were obtained, as shown in Fig. 3B–C and Supplementary Fig. 13. The loading and unloading curves of level I–III sensor units with various amplitudes before mounting, show that the units I–III exhibits some hysteresis. This is caused by the combined effects of the slip and entanglement of molecular chains within the material, the viscoelastic properties inherent to the material, and the debonding and sliding between the conductive components and the substrate in composite sensing materials. After mounting onto curved surface, the curves with different amplitudes illustrate that shapes of the level I and II sensor units appear the hysteresis phenomena earlier during unloading process, while there is no significant difference in that of the level III sensor unit. For the loading and unloading tests of level I–III sensor units at different frequencies before mounting, the two processes are almost consistent at 0.5 Hz and below, and the two curves at 1.0 Hz are significantly shifted. It is worth mentioning that due to the molecular chain entanglement effect in flexible materials, the internal stress of the flexible materials increases. As a result, the response value of the sensing unit for high frequent loading will be higher than that when loaded at lower frequencies. This result demonstrates that the maximum effective working frequency of the sensors is less than 1 Hz. After the sensor units are mounted onto the target surface, the two curves of the sensor units have some changes. The loading and unloading curves after mounting have a slight upward bow. Wherein, the curve shape of the level I sensor unit changes significantly. And there is a slight decrease in the relative resistance change of the level I–II sensor units with increasing loading frequency. These may due to the not uniformly pressure loaded by the utilized loading methods on curved surface. Hysteresis is calculated as the h divided by the maximum relative resistance change under the corresponding loading force. Variations in loading force magnitudes do not affect the hysteresis quantification or frequency response characteristics from the results. The hysteresis h of the level I–III sensor units after the mounting are all reduced, and the relative changes are 13.46%, 7.95%, and 6.36%, respectively. This phenomenon may be attributed to the preloading force generated by the mounting strain that makes the spring-back recovery of sensor units more pronounced. As the sensor sizes become smaller, a lower preloading force will be generated resulting in less susceptibility to spring-back recovery. Furthermore, we provided the response results in time domain of different amplitude and frequency loading before and after sensor units I–III mounting, as shown in Supplementary Fig. 14. It demonstrates the characteristics or regularities of dynamic responsiveness in time domain remains almost unchanged before and after sensor units mounting.
In summary, the performance response characteristics or regularities have no significant change in before and after sensor units mounting. But there exist alterations in the initial resistance, hysteresis, and other performance indicators, and there are detection deviations in the dynamic loading curves. We plot the maximum principal strain of all sensing units as well as the relative changes in initial resistance, hysteresis, and detection–deviation values for sensor units at different levels in Fig. 3D. As the level of the sensor unit increases, the maximum principal strain, which is used to characterize the mounting strain of the sensing units, decreases from 13.07% (Level I) to 3.89% (Level II) and further to 1.04% (Level III). Concurrently, the relative changes in initial resistance, hysteresis, and detection–deviation values decline significantly. This indicates that decreasing the mounting strain can effectively reduce the impact of the mounting on the device’s performance. Thus, when the mounting strain decreases to a sufficiently low level, the curved-surface calibration results can be replaced by the flat-surface calibration results. For the scenarios where the relative changes between curved- and flat- surface calibration results can be neglected, they need to be evaluated based on the detection accuracy required by actual applications. In this study, ~2% initial resistance, 10% hysteresis, and 5% detection deviation for the contact force signals are considered to have a minor impact on the evaluation of muscle health status. Therefore, in the application of the rehabilitation ball, we selected the flat-surface calibration results to characterize the level II and III units on the curved surface, while still using the curved-surface calibration results to characterize the level I units. In addition, hysteresis and stress relaxation in sensing units remain critical challenges limiting their advancement. Future research will focus on synergistic strategies: exploring intrinsic material properties (high elasticity and self-healing capabilities) and time-series compensation algorithms (e.g., neural network-based approaches).
In addition, we applied step-wave loading and cyclic loading to evaluate their steady-state detection capability and stability. The sensor unit II is taken as the test subject, as shown in Fig. 3E–G. In step-wave loading test, when the loading bar is not moving, the force on the bar is slowly decreasing. This is caused by the material’s stress relaxation. But the relative change in resistance decreases as the force on the loading bar decreases, indicating that the sensor unit has good force following characteristics. In cyclic loading, the relative resistance change of the sensor unit decreases slightly but stabilizes gradually, which is due to stress relaxation in conjunction with material creep. Overall, the sensor unit exhibits good steady-state detection capability and stability after mounting.
Grasping application experiment of rehabilitation ball
Aiming to demonstrate that the 3D conformal E-skin can be mounted onto curved surface and used to detect the contact force, a rehabilitation ball was selected as the target application. Most of the workers perform hand motions at extremely high frequency, such as officers, esports player, and factory workers, suffer musculoskeletal disorders of their hands and fingers43. Grasping rehabilitation ball can drive the superficial and deep muscle groups of the patient’s forearm and hands to evaluate the healthy status44. Specifically, different grasp gestures can stimulate different muscle groups. Given that the size of each person’s hand is different, the expense of designing and fabricating special and various E-skin adapting to hands is considerable. Arranging the E-skin on rehabilitation ball can obtain the contact force magnitude and distribution, which helps to assess the recovery of forearm muscle groups and guide the design of subsequent rehabilitation program for patients.
Here, the designed E-skin was mounted onto rehabilitation ball as shown in Supplementary Fig. 15, where the level I–III sensing units were distributed on the positions in contact with palm, the junction between palm and finger bellies, and finger bellies for meeting the demand for detection resolution, respectively. Experiments for six grasp motions were conducted and the contact force distribution map was illustrated in Fig. 4. Considering the large number of units in contact with the hand under each grasp motion, the tactile force sensing units in full contact with the finger bellies, palm, and metacarpophalangeal joints were selected as the observation units to reflect the changes of contact force signals characteristics clearly. The contact force signals were transformed from voltage signals by detection principle in Supplementary Fig. 9 and dynamic loading curves in Supplementary Fig. 12. The calibration results before units mounting for level II and III units were selected due to low relative changes in performance while the calibration results after mounting are utilized for level I units. The labeling of the hierarchy tactile force sensing units and joints are shown in Supplementary Fig. 16 and Supplementary Fig. 17, respectively. The relationship between gestures, motions, and involved joints is illustrated in Supplementary Table 1, then the association between joints motion and muscles is supplied in Supplementary Table 2 for evaluating health status of muscles precisely45. The force values of all the contact units are plotted in the force distribution map. And the force distribution maps under multiple viewpoints are plotted in Supplementary Fig. 18 to observe the contact force magnitude and distribution of all the contact units in an all-round way. The health status of hands or fingers can be evaluated by the contact force in these distribution maps.
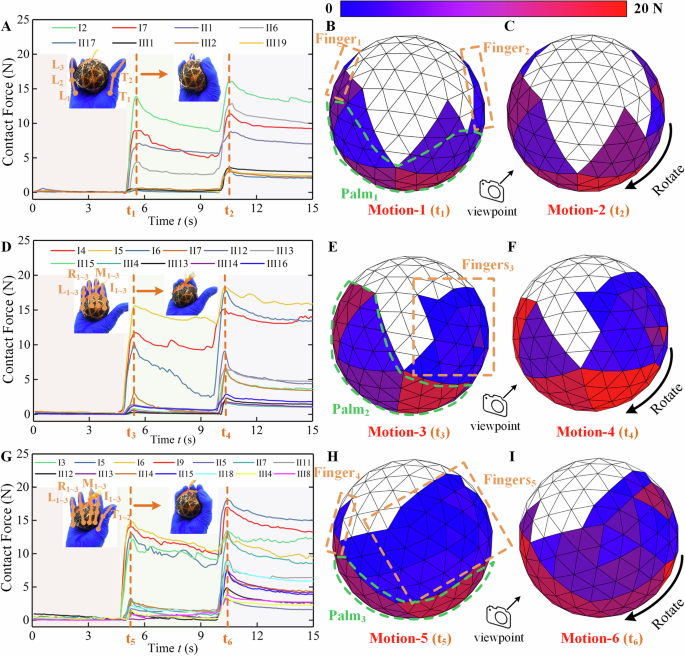
A The contact force signals of selected sensing units related to motions 1 and 2. B, C The contact force distribution map at time t1 and t2. D The contact force signals of selected sensing units related to motions 3 and 4. E, F The contact force distribution map at time t3 and t4 G The contact force signals of selected sensing units related to motions 5 and 6. H, I The contact force distribution map at time t5 and t6.
In Fig. 4A, the contact force signals of partial sensing units under Motion-1 increased at t1, indicating that these units were in contact with the palm or metacarpophalangeal joints and the rest of units were in contact with finger bellies. The contact force signal of all selected sensing units under Motion-2 increased at t2. Wherein, the contact force of units in contact with the palm or metacarpophalangeal joints increased significantly to more than 5N, and their contact force was always larger than that of the sensing units in contact with finger bellies. This suggests that even in the case of interphalangeal joint movement, the main force-generating area is still in the palm and the metacarpophalangeal joints. The value of contact force represents the health status of related muscles with the motion.
The force distribution maps under Motion-1 at t1 and under Motion-2 at t2 are plotted in Fig. 4B, C. Combining the results of force distribution maps of Motion-1 (t1) and Motion-2 (t2) from other viewpoints (shown in Supplementary Fig. 18A and B), it can be found that the contact force during the movement of metacarpophalangeal joints is mainly in Palm1. During interphalangeal joint movement, the contact force in Palm1 increased to more than 10N, and the contact force in Finger1 and Finger2 changed significantly. The combined force of all sensing units equals the grasping force of hand, which can evaluate the health or strength status of relevant muscles. Wherein, the distribution of the contact force in Finger2 was staggered, which indicated that the contact force acted on the finger bellies. The involvement of superficial and deep flexors causes that the contact force in Palm1 enlarges during the movement of interphalangeal joints. Therefore, the health status of superficial flexors, deep flexors, and earthworms can be assessed according to the contact force at t1 under Motion-1. The health status of part one (the short flexors of the little finger), part two (the thumb flexor, short flexors, and thumb retractor), and part three (superficial flexors and deep flexors) can be evaluated based on the contact force in Finger1, Finger2, and Palm1 at t2 under Motion-2, respectively.
The contact force signals of units in contact with palm increased first at t3 under Motion-3 and that of all selected units increased at t4 under Motion-4, as shown in Fig. 4D. The contact force of unit I6 decreased during the maintain stage between t3 and t4. This is caused by the unit I6 is at the edge of contact region and the contact position was gradually shifted during the holding phase. The muscles related with index, middle, ring, and little fingers can be assessed by the force distribution maps of Motion-3 at t3 and Motion-4 at t4, as shown in Fig. 4E, F, Supplementary Fig. 18C and D. In addition, the contact force difference between the units in Fingers3 could be utilized to diagnose the health of finger tendon connected with superficial flexors and deep flexors. Similarly, Motions 5 and 6 use all fingers for grasping but with all metacarpophalangeal or interphalangeal joints movement, as depicted in Fig. 4G. The rehabilitation ball was obviously squeezed with this grasp gesture. This caused contact force changes not only for the units in contact with palm, but also for the units at the edge of palm under Motion-5 at t5. There existed difference in the contact force between the units in contact with finger bellies under Motion-6 at t6, which indicated that the force values generated from fingers were various. Similar to the other gesture, the result of this gesture (Fig. 4H, I, Supplementary Fig. 18E, F) can demonstrate the health of muscles or tendons that motivate joints. Meanwhile, Motions 5 and 6 include the movement of all the finger joints and metacarpal joints, which is driven by all hand muscles and forearm muscles collaboratively.
Therefore, the contact force distribution and values enable to reveal the overall health of hand and forearm muscles. By comparing the distribution and magnitude of contact forces when normal individuals and patients grasp, the health status of forearm or hand muscles in patients can be evaluated. Physicians can design targeted rehabilitation plans based on the magnitude and distribution of muscle-driven forces to facilitate the rapid recovery of patients. From the viewpoint of contact force values, given that discrepancies between Young’s modulus of practical mounting surfaces and the rigid surfaces used in calibration may lead to inaccuracies in contact force quantification, we will establish application-specific contact mechanics models in future work, enabling the development of compensation algorithms to resolve accurate contact force values. Thus, the 3D conformal E-skins have the potential in rehabilitation balls.
Discussion
We have presented a universal cutting and distributing strategy for electrical skin by putting small/large size sensors onto target surface with low/high curvatures conformally. Dividing the electrical skin into two parts, an integrated electrode and isolated sensing units, enhances the maintenance of electrical skin and interchangeability of sensing units. The modular sensing units are designed to be hierarchy with various sizes to match the curvatures of target mounting surface conformally, reducing the mounting strain and effect on the performance of sensing units. As the mounting strain reaches small enough, the difference of sensing performance before and after units mounting can be negligible or meet the detection requirements. In this case, the performance calibration results on plane can be utilized for sensing units after mounting, avoiding the complex and cumbersome surface calibration process effectively. Through the comparison of sensing performance on plane and curved surface calibrations, we have demonstrated the validity of our approach on reducing the changes in sensing performance before and after mounting.
Our design strategy is universal in field of 3D conformal electronics, given that arbitrary surface can be discretized into polyhedral. The proposed device design methodology can be applied to living biological surfaces. However, fully adopting this methodology to such environments requires future research into a morphological reconstruction of biological surfaces, high-precision fabrication processes for biocompatible electrodes, and efficient positioning and assembly of modular units, such as combining the four-dimensional responsive structure with integrated electrodes and utilizing transfer printing technology for mounting modular sensing unit. Moreover, our method achieves the design of low-strain mounting structures by controlling the contour structures of sensing units, thereby being applicable to multimodal or multifunctional sensing units. In summary, the design method proposed in this work have great potentials in guiding the designs of 3D conformal electronics, where low mounting strain, simple calibration process, and convenient maintenance are desired. It opens a new paradigm for the design of next-generation, 3D conformal electronics whose shapes can envelope the whole target surface with adjustable mounting strain.
Methods
Computational methods
The unfoldings were generated by the computational algorithm in C++ implemented by existing research46, and the executable file can be found at https://github.com/jmlien/unfolder-assignment/wiki. The 3D target model was discretized and meshing with MeshLab software. The conformal mounting model was verified in our previous work31 and the mounting strain is solved with MATLAB 2019.
Materials configuration and fabrication methods
The sensing material was prepared by mixing silicone rubber (GD401, Zhonghao Chenguang Research Institute of Chemical Industry), Graphene (diameter <10 μm, The Sixth Element Materials Technology Co., Ltd), carbon nanotube (Nanjing XFNANO Materials Tech Co., Ltd), and tetrahydrofuran (THF) with mass ratio of 1:4%:2%:1 in the planetary mixer, where the THF was used as the solvent to volatilize during mixing. The mechanical, electrical, and thermal properties of these prepared composites have been characterized in our previous work47. The electrode material is commercial conductive silver adhesive. The (carved) substrate is polydimethylsiloxane. The sensing pattern is screen-printed with mask and the contour shape of sensing units is cut with a laser cutting machine. Uncured polydimethylsiloxane and conductive silver adhesive are utilized to bond the contour boundary and electrode sites, respectively. Thus, each layer is bonded together, which prevents sensing materials from air, water, and other substances in the environment.
Experimental methods on calibrations and applications
The performance calibrations were conducted using a test bench (TA Instrument, USA) equipped with a 200 N commercial force sensor for the contact force tests and resistance signals were detected with a digital multimeter (34,465A, Keysight Technologies Co., Ltd, Beijing, China). The calibration platform utilizes displacement-controlled loading. During planar and curved surface calibrations, identical displacements correspond to different loading forces. The loadings and unloadings with different amplitudes and frequencies are conducted by the test bench. The loading bars for planer and curved surface calibrations exhibit flat bottom and curved bottom, respectively. And the curvatures of loading bar’s curved bottom are same with target surface. The bottom surface area of all the loading bars exceeds the upper surface area of the sensing units, and the contact area during calibration is determined by the unit’s upper surface area. The loading pressure remains consistent between planar and curved surface calibrations for level II and III units. For level I units, slight stretching occurs when mounted onto curved surfaces, leading to marginally lower pressure during curved calibration compared to planar calibration. But this minor discrepancy does not significantly affect the results. In the loading experiments, we first conducted tests with varying displacement amplitudes (such as Supplementary Fig. 14B, H for level II units) to identify appropriate displacements for subsequent frequency loading tests. The integrated electrode used Polyimide and copper as substrate and wire, was cut as unfolding shape by a laser cutting machine, and was mounted onto target surface with double-sided tape. The E-skin is connected to two scanning circuits through FPC ports. As the rehabilitation ball is grasped, the resistance signals are transferred to voltage signals that are detected by the scanning circuits47. The collected voltage signals are converted to resistance signals based on the voltage-dividing principle and then to force signals based on the loading curves of various sensing units. Additionally, a model with the same curved surface as the target surface needs to be constructed in MATLAB and meshed with the smallest units in applications. After establishing the corresponding relationship between contact force and color cards, a one-to-one correspondence is established between the meshes in this model and the sensing units, enabling the transfer of the contact force values of the sensing units to the color of the meshes in the model. Finally, the moment of the maximum contact-force response during grasping is selected, and the force distribution at this moment is utilized as the results in the grasping gesture.


Responses