A convolutional neural network model and algorithm driven prototype for sustainable tilling and fertilizer optimization

Introduction
Tilling is a foundational agricultural process that prepares the soil. However, tilling practices today are mostly guided by conventional methods rather than scientifically optimized strategies leading to over-tilling and under-tilling. In particular, over-tilling is associated with soil erosion, nutrient runoff, carbon release and soil structure degradation1,2. For instance, each year about 2.4 billion tons of soil is eroded from US cropland because of over-tilling3. Despite this, research has shown that increased tilling intensity doesn’t increase crop yields, emphasizing the need for optimization in tillage practices4.
Both over- and under-tilling create special challenges. Over-tilling destabilizes soil structure and reduces fertility by exposing beneficial microbes and organic matter to rapid decomposition. This also makes the site much more vulnerable to wind and water erosion, which may result in nutrient loss and water pollution5,6. Conversely, inadequate tilling can cause soil compaction, poor seedbed conditions and increased weed pressures, limiting crop growth and increasing use of chemical inputs7,8. Further descriptions of challenges are detailed in Supplementary Table 15,6,9,10,11,12,13,14,15 and Supplementary Table 27,8,16,17,18,19,20,21.
Despite the progress in agricultural automation and soil management, there are still research gaps. First, although automated tilling systems have been introduced, they place productivity above environmental sustainability. Autonomous tractors by John Deere have advanced in driverless operations but remain focused on labor efficiency rather than considering the environmental impacts of tilling22. Existing solutions do not optimize tilling and fertilization to minimize environmental impact such as carbon emissions and nutrient leaching.
Second, although models such as the Revised Universal Soil Loss Eq. 2 (RUSLE2) are widely used to estimate soil erosion, they do not dynamically integrate with field-specific, real-time data to guide tilling practices23. Such models give erosion estimates but are seldom used directly to inform or adjust tilling intensity and timing based on current soil and weather conditions.
Third, there is a lack of integration between tilling practices and soil nutrient management. Studies of soil fertility and tillage intensity are often siloed and little research has addressed how machine learning and real-time data can balance these aspects for sustainable outcomes24.
Recent studies also highlighted the need for sustainable land management. Chlingaryan et al.25 review sensing technologies that inform tilling practices but state that such methods are often not coupled with machine learning models26. This gap in the literature reflects a broader trend where traditional precision farming techniques often fail to integrate real-time data into decision-making processes effectively. Combining CNN-based image classification with sensor-driven inputs, this work fills a gap in the literature where adaptive tilling could directly attenuate adverse environmental impacts. By providing a mechanism for adaptive response to changing conditions, this study represents a shift from reactive to proactive management, a hallmark of modern sustainable farming practices. Furthermore, Benos et al.27 explore AI applications in agriculture, highlighting the need for AI tools that focus on resource efficiency and environmental conservation which is achieved through quantifiable reductions in fertilizer and water use27.
Furthermore, machine learning models such as CNNs coupled with real-time sensing technologies represent a significant advance in precision agriculture. These models empower farmers with real-time insights, enabling them to make decisions that are tailored to the specific needs of each field. This study addresses critical gaps in recent research such as calls for the development of adaptive tilling systems to curb environmental degradation in long term applications28. Adaptive tilling models have the potential to reduce soil degradation over time, mitigating the long-term ecological impacts of traditional practices.
Additionally, research has shown that nutrient losses in traditional systems can exceed 60%, highlighting the need for novel approaches such as the one presented here29.
This study introduces a novel approach using Convolutional Neural Networks (CNNs) and a custom algorithm to optimize tilling and fertilizer application based on field images and sensor data. The CNN model measures tilling intensity based on soil images, and an algorithm combines this data with soil conditions and environmental factors to determine the optimal tilling and fertilization levels. By addressing both tilling and fertilizer application, this approach provides a comprehensive solution to reduce soil degradation and environmental impact in agricultural practice.
Prior to deciding on the CNN model, a few other models were evaluated for their accuracy and efficacy. The “You Only Look Once” or YOLO algorithm was initially evaluated due to its reputation for high-speed object detection30. However, prior studies have found that YOLO only achieves an accuracy of 70–80% for classification when optimized for high speed object detection31. Convolutional neural networks (CNNs) on the other had have demonstrated accuracies of over 90% for complex spatial image classification tasks, especially useful for agricultural studies31,32.
OpenCV, while suitable for real-time object detection applications, generally achieves accuracies in the range of 60–75% for more detailed classification tasks33. Benchmarks from related studies indicate that CNNs consistently outperform YOLO and OpenCV for complex image classification tasks relevant to soil and tilling analysis, with CNNs showing accuracy rates of 90–95%, YOLO around 75–85%, and OpenCV around 60–70% for similar applications30,31,32.
This study aims to answer the following questions:
-
1.
Can CNN-driven image analysis accurately detect and classify tilling levels in real-world conditions?
-
2.
How effective is an algorithm-driven approach in optimizing tilling intensity and fertilizer use to minimize soil erosion, carbon release, and nutrient runoff?
-
3.
Can this CNN and algorithm-based approach be combined into a field-deployable, automated prototype?
Methods
This study incorporates a Convolutional Neural Network (CNN) model to classify tilling levels based on soil images. The CNN provides critical tilling intensity data, which, along with real-time sensor inputs (such as soil moisture, nutrient levels, soil temperature, and field slope) and external environmental factors (including weather and crop type), feeds into a core algorithm. This algorithm then combines all inputs to determine the optimal tilling intensity and fertilizer application, aiming to reduce environmental impact while improving soil health.
The fully automated tilling and soil enrichment system has 3 key sets of inputs that are leveraged by the core algorithm:
Input Set 1: Tilling level (detection using a Machine learning model-based system)
Input Set 2: Soil parameter sensor module with IOT devices to measure soil moisture, soil nutrient levels, soil temperature, and field slope angle
Input Set 3: External data on rain, wind speed forecast, atmospheric temperature, soil type, and crop type
This solution is visually shown in Fig. 1.

The End-to-End Solution with Inputs, Outputs, and Core Algorithm.
Input Set 1: Tilling level detection
Tilling levels are determined by farmers today based on observation of the tilled field and experience. There are no automated methods that exist to determine tilling levels. Hence this system has been developed involving a camera picture input fed through a neural network-based machine learning model that has been trained to detect level of tilling at a high accuracy level.
Tilled soil usually has several distinctive features that can help detect the level; and intensity of tilling performed as below in Table 1:
The 5 features above are further illustrated in Supplementary Fig. 1.
Data collection process
One way of collecting data in the form of images of tilled areas is to directly capture images from actual fields. However, this was practically too difficult given that fields only had a certain intensity of tilling at any time, and capturing data from multiple fields across all 7 tilling levels was unfathomable. Hence it was necessary to set up a simulation of a tilled field on a smaller scale in planting beds. Given the broader scope of research with soil nutrient enrichment and the associated prototype, non-nutrient soil had to be used in the planting beds. The planting beds were filled with up to 18 inches of non-nutrient soil to simulate different tilling intensities (Supplementary Fig. 2).
Tilling intensities were determined based on standardized Soil Tilling Intensity Rating (STIR) guidance levels34. Seven different tilling levels were deduced from the guidance levels based on popular tilling practices as well as to allow for adequate distinguishing features across tilling levels. This ensured that the models recognized broader varieties of tilling across tilling depths.
The 7-point reference scale based on the above is detailed in Table 2 below35,36,37.
To replicate the different tilling types, depths, and displacement widths, a variety of tools were put to use, including shovels of different sizes and shapes, rotating discs, and rakers. Hay and straw of varying lengths and granularity were used as crop residue.
In order to adequately train the machine learning model to recognize these 7 tilling levels, over 1000 images were captured using a 12 Megapixel camera mounted at a standard height range of 12 inches to 14 inches above the planting beds. To standardize the images fed as input, the height and zoom levels of the images were kept constant throughout the image capture process of the tilled field. Illustrative images of various tilling levels are shown below in Supplementary Fig. 3.
The images were also validated for the tilling type and level by farmers, as a second level of assurance.
Machine Learning Models
To adequately evaluate the images for the 6 distinctive soil features described above, several machine learning (ML) model algorithms were evaluated.
In this study, YOLO achieved an accuracy of only 78%, while OpenCV reached 63%, both notably lower than the CNN model’s performance. These findings align with previous research, which similarly reported CNNs outperforming other models for complex agricultural image classification tasks.
Additionally, recent studies highlight CNNs’ effectiveness in agricultural image classification, noting their superior ability to handle complex spatial patterns in soil and crop analysis tasks38,39. This capability makes CNNs particularly suitable for precise, feature-rich applications like tilling level determination in this study.
Given these advantages, CNN was found to be the most appropriate machine learning algorithm to use for the tilling level determination, based on image processing. To build the CNN model, Tensorflow and Python were used along with NumPy and Keras for image processing.
A prerequisite to processing images through CNN is to standardize the image size. In this case, NumPy and Keras were used to standardize the images to 256 pixels x 256 pixels size with each pixel having its own RGB value. This was done to optimize the computational resources and reduce training time. In addition, prior to each epoch of training, a random transformation was applied using NumPy, CV2, and Keras to each image with respect to zoom level, image cropping, image rotation, and image mirroring to reduce model overfitting and to ensure the model detects the correct tilling related features in the image.
CNN models typically require several layers to be defined as follows:
Convolutional Layers
These layers apply a number of filters to the input. Each filter activates certain features from the input, like edges, textures, or more complex patterns in deeper layers. Convolution involves the element-wise multiplication of the filter matrix with the input matrix (a portion of the image) followed by a summation, as expressed in Eq. 1 below. In this model, three convolutional layers were defined, each with 32, 64, and 128 filters respectively, with each filter of size 3 pixels × 3 pixels.
The Convolution Operation
Pooling Layers
Pooling (usually max pooling) reduces the spatial dimensions (height and width) of the input volume for the next convolutional layer. It helps reduce computation and parameters and controls overfitting by providing an abstracted form of the representation.This model uses three max pooling layers in between the convolutional layers.
Fully Connected Layers
These layers are traditional feed-forward neural network layers where every input is connected to every output (dense layer). They are typically placed toward the end of CNN architectures to perform classification based on the features extracted and processed by convolutional and pooling layers. In this model, two fully connected layers with sizes 256 and 512 neurons were used.
Output Layer
The output layer typically uses a softmax function, as expressed in Eq. 2 below, for multi-class classification tasks, which provides a probability distribution among the various class labels. The final output layer for this model is of size 7 neurons and uses the softmax function40.
The Softmax Function40
The detailed layers are described below in Fig. 2.
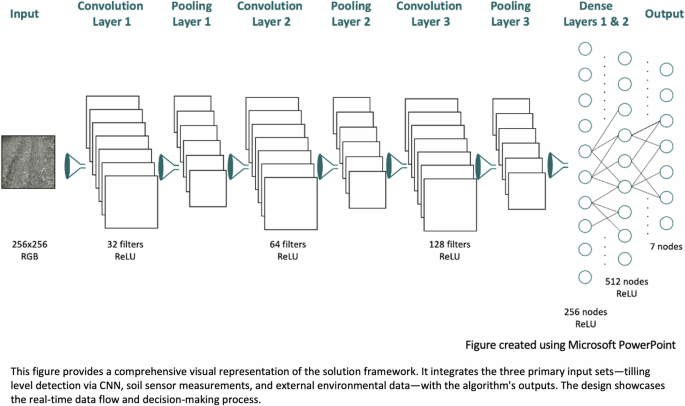
The Convolutional Neural Network Architecture Used for Image Analysis.
Activation Function
Each of this model’s convolutional layers and fully connected layers use the Rectified Linear Unit (ReLU) activation function, as expressed in Fig. 3, which helps introduce non-linearity, allowing the network to learn more complex patterns41.
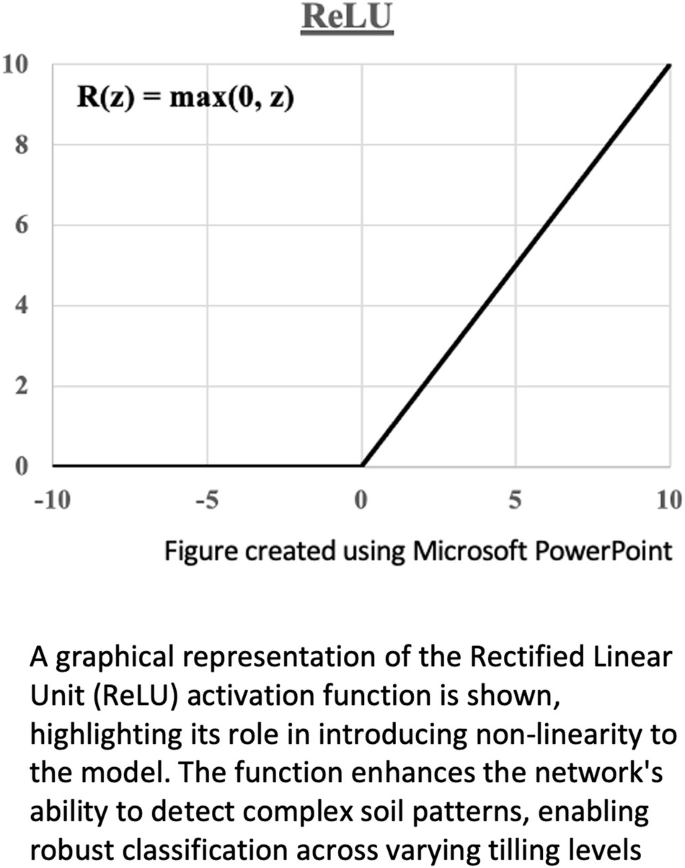
The Graph for ReLU Function.
Adam optimization algorithm, as expressed in Eq. 3, was used with a learning rate of 0.0001 and the sparse categorical cross entropy was used for the loss function42. The low learning rate was used to avoid overfitting of the model and to maximize accuracy. The model was run for 75 epochs as part of the training process aiding to a high level of accuracy.
The Adam Optimization Algorithm42
η: Initial Learning rategt: Gradient at time t along ωjvt: Exponential Average of gradients along ωjst: Exponential Average of squares of gradients along ωjβ1, β2: Hyperparameters
Input Set 2 – Soil Parameter Sensors
The second set of inputs involve a set of sensors and IOT devices to measure key soil and field parameters as described below.
Soil Moisture Sensor
Soil moisture is considered to be the single most important factor contributing to soil compaction43. Heavy clay content soils are particularly vulnerable to severe compaction under wet conditions. Hence it is important to measure soil moisture content prior to tilling to ensure the soil is not too wet. A Capacitive Soil Moisture Sensor has been used to measure soil moisture.
The capacitive moisture sensor works like a capacitor. The water in the earth changes the capacitor’s capacity. By measuring the charge and discharge time, it determines the soil moisture level.
NPK Sensor
Soil nutrient levels determine the need for tilling as well as the level of tilling needed. Similarly, the amount of fertilizer needed is determined by the existing nutrient levels in the soil. In this case, a JXCT soil NPK sensor has been used as it is suitable for detecting the content of nitrogen (N), phosphorus (P) and potassium (K) in the soil, and judges the fertility of the soil by detecting the conductivity transformation caused by different nitrogen, phosphorus and potassium concentrations in the soil44. This is being fed as a key input into the algorithm used.
Soil Temperature
Tilling the soil can have a significant impact on soil temperature, an important factor for seed germination and plant growth. Tilling generally tends to increase the soil temperature in spring and decrease it during fall45. Hence it is important to measure soil temperature prior to tilling. To measure the soil temperature, a Bojack DS18B20 soil temperature probe is used.
Gyroscope for Field Slope Measurement
Field slope is important to measure before tilling as it impacts soil erosion and runoff. The higher the slope of the field, the greater the runoff and erosion risk. Tilling on a sloped field further increases the amount of runoff and erosion and hence the slope of the field is a critical factor to consider while determining tilling intensity46. In this case, the MPU-6050 gyroscope is used in order to measure the slope of the field.
Input Set 3 – External factors
In addition to the inputs described above, a few other external factors that impact tilling and fertilizer levels need to be considered and fed as inputs to the algorithm. The key external inputs are described below:
Rain Forecast
While tilling just prior to rain can incorporate moisture into the soil and help distribute nutrients in the soil, the negative effects need to be considered. Tilling the soil just prior to rain can cause soil erosion, nutrient leaching, soil compaction, and waterlogging47. These negative effects need to be carefully considered, thus making rain forecast an important input parameter in tilling decisions.
Wind Forecast
Tilling loosens soil and breaks up soil aggregates and disrupts the soil structure, making fine soil particles more prone to being picked up and carried away by wind. Tilling often involves removing crop residues and other vegetative cover that protect the soil surface. Without this protective layer, the soil is more exposed to wind. Tilled soil tends to dry out faster, and dry soil is more susceptible to wind erosion than moist soil48. Hence heavy wind forecast prior to tilling needs to be considered as a decision factor.
Atmospheric Temperature
Similar to soil temperature that was discussed in the section above, atmospheric temperature needs to be considered prior to tilling as well. Higher atmospheric temperatures generally result in warmer soil conditions49. Tilling under warm conditions can be effective for soil aeration and breaking up compacted layers. However, tilling in excessively warm and dry conditions can lead to rapid soil moisture loss, which can be detrimental to soil health and microbial activity. In colder climates or during colder seasons, the soil tends to be harder and more compact, making tilling more challenging. Tilling frozen or very cold soil can be ineffective and may harm soil structure, leading to issues like clumping. Tilling too early in spring, when the soil is still cold and wet, can also compact the soil and create clods that are difficult to break down.
Soil Type
The tilling intensity will differ based on soil type and so will the key features of the soil50. This will also impact the ability to detect tilling intensity and level. For the purposes of this study, the soil type has been limited to loamy, given the experiment was performed with loamy soil in the planting beds and machine learning model has been trained based on the same.
Crop Type
Crops require varying intensities of tilling based on the type. For the purposes of this study, four different crop types have been taken into account – Row crops, Root Crops, Small Grains, and Vegetables51,52,53,54.
Algorithm
The three sets of inputs are put through a detailed algorithm programmed in Python code to determine the 2 key outputs – Tilling level and Fertilizer quantity to dispense. For each of the input parameters evaluated, upper and lower value limits were determined as described below to make it a fully functional logic.
Rain Forecast
Rain is a major factor and reason for soil erosion and nutrient wash off after tilling. The algorithm takes this as input and assesses rain over 25 mm h − 1 in the immediate 3 days following the day of evaluation55.
Field Slope
The runoff and erosion risks are much higher with tilling on a sloped field as opposed to a level field and erosion could be caused by wind as well as rain. It is difficult for equipment to operate on fields with slope higher than 5% grade. While slope <1% is considered relatively flat with least runoff risks, tilling intensity needs to be reduced for slope between 1% and 5% to reduce runoff risks. The recommendation is to not till the field if the slope is >5% given the soil erosion and loss is over 24%46,56.
Wind Speed Forecast
With the standard categorizations of wind speed based on the Beaufort wind scale, levels 1 (calm) through 4 (moderate breeze) were considered to be safe after tilling with minimal to no soil disturbance while level 5 and above could cause soil disturbance based on the definition of wind rating scales on the Beaufort scale57. However, for slopy fields, caution was taken to assess levels 0 to 3 as safe.
Soil Temperature
Soil temperature is an important factor to consider prior to tilling given that tilling when soil is very hot could drain soil moisture quickly rendering the soil dry. Similarly tilling when soil is very cold hinders root growth. Optimal range of soil temperature for tilling is between 6 °C to 24 °C58. The algorithm uses this range to determine the min and max temperatures.
Atmospheric Temperature Forecast
As discussed in sections above, given that atmospheric temperature has a direct impact on soil temperature49, tilling in hot weather (>24 °C) and in cold weather (<6 °C) are not recommended58. However, with adequate soil moisture, tilling might still be acceptable as the risk of soil dry out is lower.
Soil Moisture
Tilling while soil is very moist causes compaction, which is not desirable for cultivation. Moisture levels from 10% to 30% have been considered to be appropriate for tilling, with 20% being the optimal level of soil moisture for loamy soil59.
Crop Type
The needs around tilling intensities and types vary based on the crop type. A standardized chart as below in Table 3 was used to determine tilling needs.
Soil Nutrient Level (NPK value)
Soil nutrient requirements vary by crop type. By assessing the current NPK value of the soil and the required levels, the fertilizer quantities were determined through a calibration method that computes the difference between current NPK values and required NPK values and NPK levels per gram of fertilizer dispensed.
Using the above factors and tolerance limits, the algorithm has been defined along with the detailed logic used across the entire input set, as described in Fig. 4.
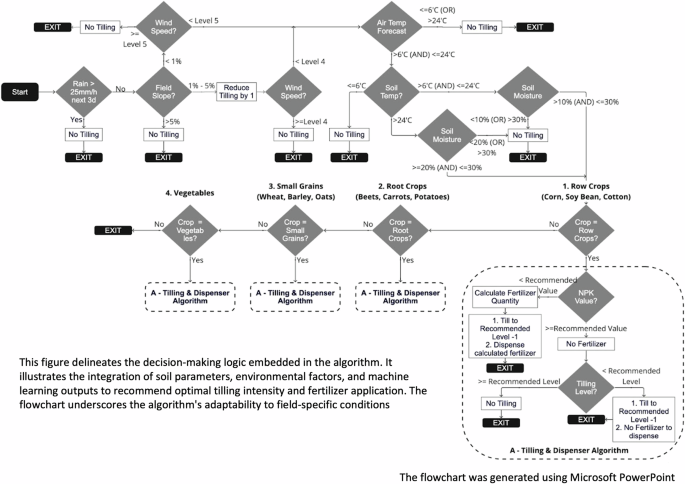
The Algorithm with the Detailed Logic Used in the Entire Input Set.
Prototype
To thoroughly test the concepts discussed along with all the input sets and desired outputs, a prototype was developed. The core modules of the prototype are as discussed below:
Self-driving Vehicle
A self-driving vehicle was designed and built from scratch to control the motion and speed as needed, depending on whether input measurements were taken or output actions such as tilling and/or fertilizer dispensing were carried out.
The vehicle was designed and 3D printed at home using a modularized design/build process, given the extreme customizations that were required to make all the functionality work. The primary drive system consisted of two 12 V DC motors 0.6 A with 30RPM speed attached to the two rear wheels. The DC motors were controlled by an Arduino IDE compatible ESP32 microcontroller. 12 mm tires were used for ease of navigation on the soil bed. All the input and output units were mounted on this main vehicle for ease of operation and control. An image of the vehicle is shown in Fig. 5 below.
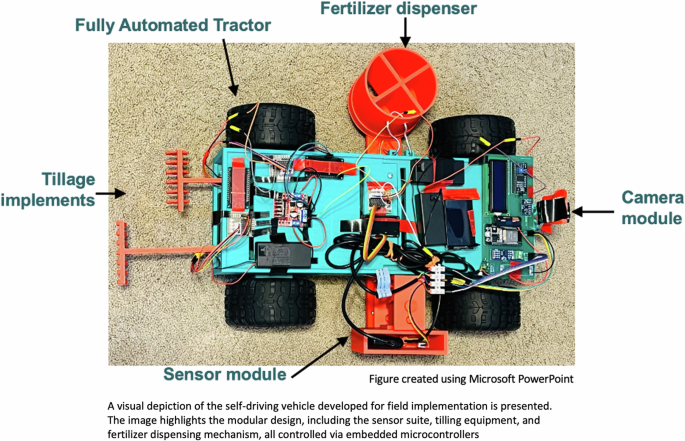
The Finished Tractor Prototype.
Camera Module (Input set 1)
A camera module was mounted on the vehicle at a height of 12 inches consistent with the height at which the images were captured for training the machine learning model. A OV2640 2MP camera with a built-in 520 KB SRAM and 8MB external PSRAM was used and was connected to an Arduino module to automate the camera control. The resolution requirement of the machine learning model is 256 × 256 pixels. Given this, the resolution provided by the 2MP camera meets the model’s input specifications. Increasing camera resolution would likely yield only marginal improvements in accuracy, if any, given that the model scales all inputs to 256 × 256. Therefore, the 2MP camera provides an optimal balance of performance and computational efficiency. An image of the camera module is shown in Fig. 6 below.
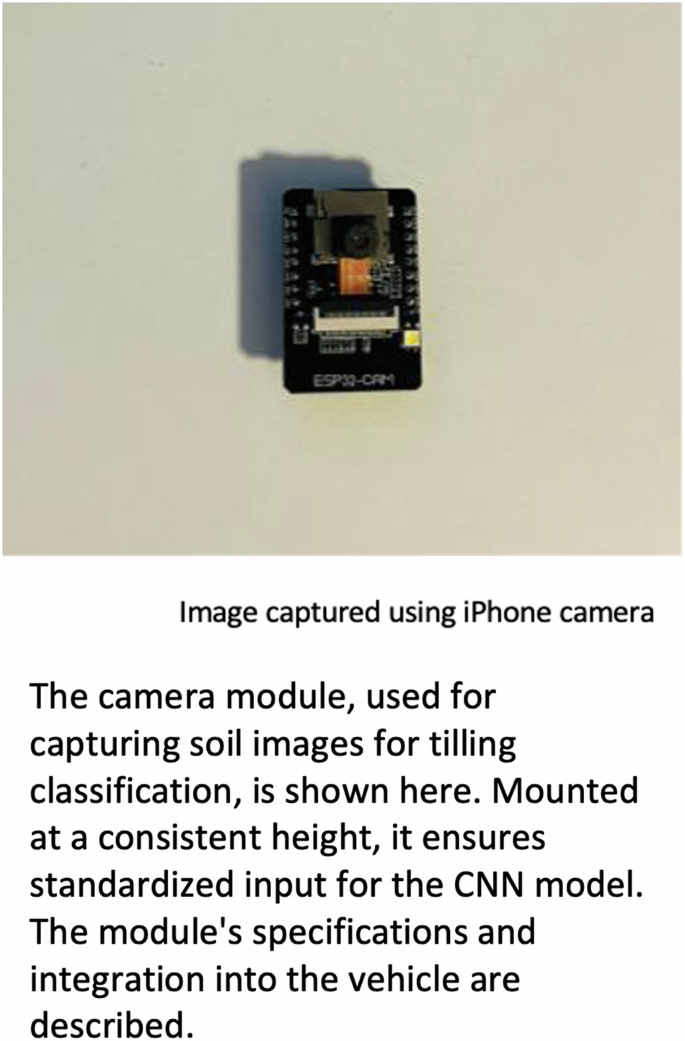
The Camera Module (OV2640 2MP) Used for Capturing Soil Images for Tilling Classification.
Sensor Module (Input Set 2)
An automated sensor module was mounted to the vehicle and with capability to plunge all the sensors up to 6 inches down automatically to take the necessary measurements. The sensors that were mounted to the module board included Soil Moisture Sensor, NPK Sensor, Soil Temperature sensor, and a Gyroscope for Field Slope Measurement. The module board was 3D printed to hold all the sensors in place. An ESP32 microcontroller was used to control the sensors and capture sensor inputs. Another ESP32 controlled the vertical movement of the sensor module allowing it to plunge down into the soil. To enable this vertical or linear movement, a Scotch Yoke mechanism (also called a slotted link mechanism) was used as it converts the rotational motion of a stepper motor (in this case, ULN2003 5 V Stepper Motor) into a linear motion through a reciprocating motion mechanism. An image of the sensor module is shown in Fig. 7 below.
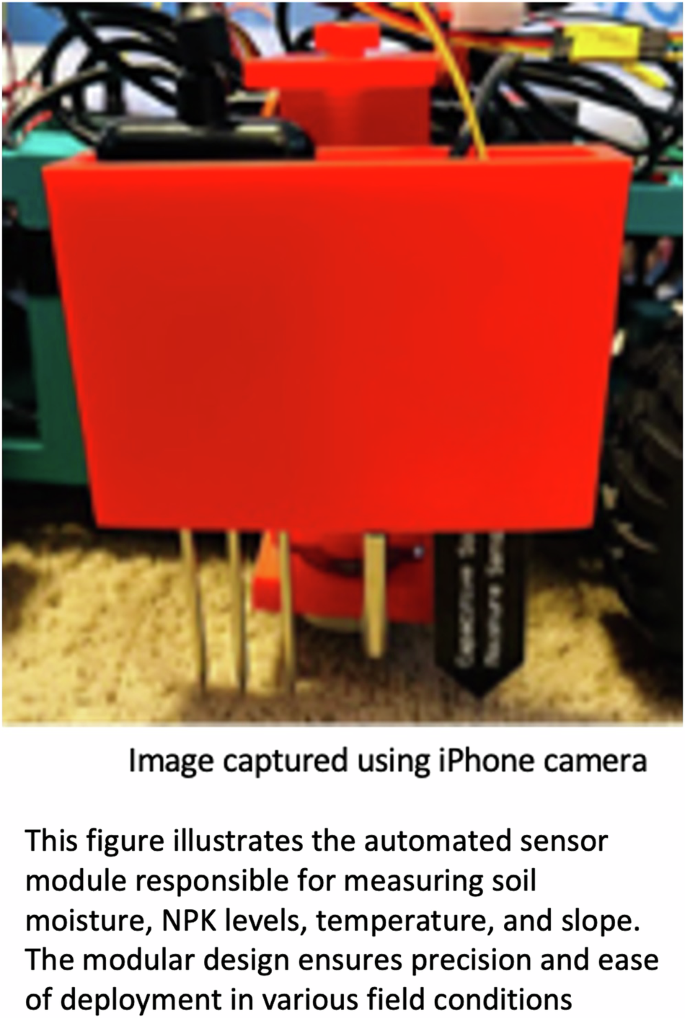
The Sensor Module with Soil Moisture, NPK, and Soil Temperature Sensors.
Tiller Module (Output 1)
An independently operating and automated tiller module with two types of tillers was 3D printed to suit the level of customization required. The first automated tiller was a 4 inch deep moldboard plough that could be lowered and raised automatically based on an ESP32 microcontroller. The second automated tiller was a 2 inch deep disk tiller which could also be lowered and raised automatically and controlled by the same ESP32 microcontroller. Both the tillers are controlled by independent ULN2003 5 V stepper motors.
An image of the tiller module is shown in Fig. 8 below.
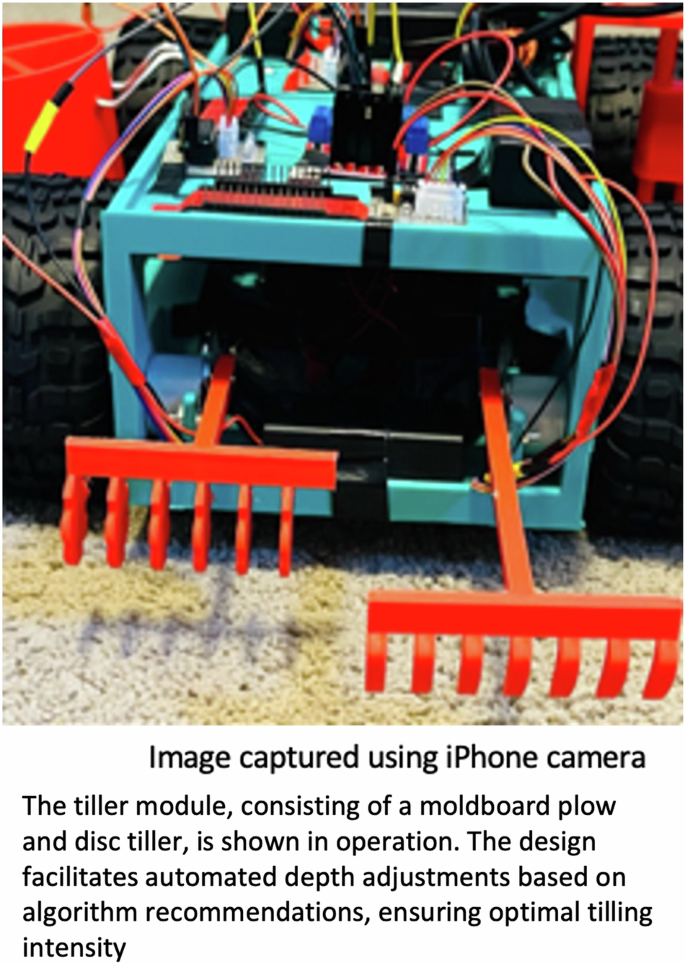
The Tillage Module with the Rotary Disc and Plow Tillage Implements.
Fertilizer Dispensing Module (Output 2)
As the second output module, the fertilizer dispenser could automatically and independently dispense desired quantities of fertilizer as determined by the core algorithm. The mechanism used for this module included a ULN2003 5 V stepper motor with its rotation counts determined by the core algorithm controlled by ESP32 and Arduino module. The motor connected to a circular disc with a small segment of opening enabled measured quantities of fertilizer in powder form to be dispensed depending on the number of rotations of the disc.
An image of the fertilizer dispensing module is shown in Fig. 9 below.
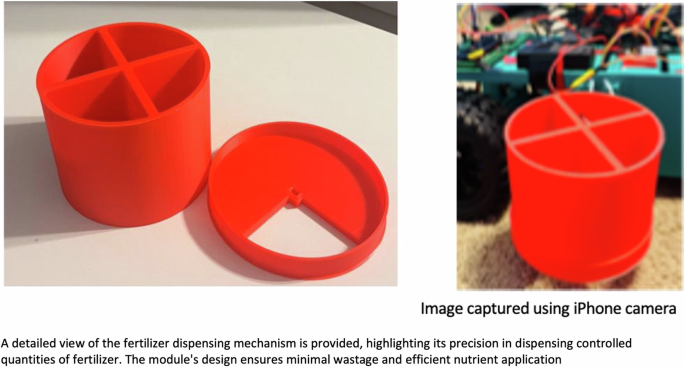
The Fertilizer Dispensing Module with the Spinning Cylindrical Drum.
Simulation Setup
In addition to the algorithm validation, a simulation method has been used to validate the effectiveness of optimal tilling and fertilizer quantity usage. This is accomplished by comparing a conventionally tilled farm against a farm that is tilled according to the algorithm’s output. This was setup in the Agricultural Production Systems sIMulator (APSIM)60. A 30 year weather dataset of Iowa was taken and used on both farms to ensure consistency. The crop type of the farm was corn, and tilling intensity was the only parameter that was changed between the farms. Default settings were used for the rest of the parameters, based on the actual conditions in Iowa during the 30 year period.
Results and Discussion
Three types of output metrics have been evaluated and compared in the study results.
-
1.
Accuracy and efficacy of the CNN based tilling intensity determination
-
2.
Output of the algorithm for combinations of input parameters
-
3.
Comparison of the effects of conventional tillage to the algorithm-determined optimal tillage based on 30-year simulation
Machine Learning Based Tilling Level Determination
The Convolutional Neural Network based ML model that was trained using the sample images was put to test using test data as a new set of images captured from the tilled plant bed. The model was able to classify the images with over 97% accuracy level. While the positive test scenarios included appropriately tilled samples conforming to specific tilling levels, negative and alternate test images were also captured that included non-calibrated levels that were in between levels 4 and 5 as well as in between levels 6 and 7. Even in these cases, the model was able to determine the tilling levels to either the prior or next level at 90% accuracy, with incorrect predictions falling within a margin of error of 1 level. This result further solidifies the model’s ability to identify specific soil properties in determining tilling intensity.
Additionally, 120 images were collected from real fields with varying tillage intensity to further test the validity of the CNN model, where the model achieved an accuracy of 91.67%. These results suggest that the CNN model can reliably classify tilling levels in diverse conditions, reinforcing its potential for real-world application in precision agriculture.
The accuracy measure of the output based on tests performed is as shown below in Table 4 and a graph of the model accuracy and loss are shown in Fig. 10.
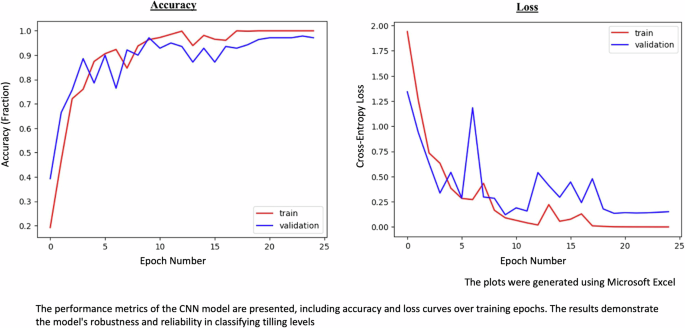
The Loss and Validation Accuracy Metrics Showing the Performance of the CNN Model During Training at Certain Number of Epochs.
These results highlight the CNN model’s ability to classify tilling levels in different conditions and demonstrate its potential for application in precision agriculture. This aligns with recent advances in agricultural technology where CNNs have been employed for various tasks. For instance, El Sakka et al.61 demonstrated how CNNs can be utilized in smart agriculture, providing image analysis for crop monitoring and disease detection61. Similarly, Iftikhar et al.26 developed an enhanced CNN approach coupled with mobile applications for early plant disease detection and classification, showcasing CNNs’ adaptability in real-time agricultural situations35. Both these studies achieved similar accuracies in using CNN models, reaching 97.86% and 98.17%, respectively.
Moreover, the detection of plant leaf diseases using CNNs has been extensively reviewed, with studies indicating their effectiveness in identifying various plant diseases from images. CNNs, combined with remote sensing data, have also been considered for crop yield prediction and monitoring at different scales, highlighting their capability to address complex agricultural challenges25.
In the context of tilling level determination, the application of CNNs to soil-specific features represents a novel contribution to the field. While previous studies have predominantly focused on above-ground plant metrics, such as leaf area estimation and plant height measurement62, this work extends the utility of CNNs to subsurface soil analysis, addressing a critical gap in precision agriculture. By providing accurate classifications of tilling levels, the model offers a data-driven approach to optimize tilling practices, which are often performed sub-optimally due to a lack of precise soil data. This advancement has the potential to enhance resource efficiency and promote sustainable farming practices63,64.
Tilling Level and Fertilizer Level Algorithm Output
The algorithm testing involved simulating several tilling levels as input and NPK values for soil as inputs along with a variety of combinations of input parameters to represent the different decision triggers for the algorithm to consider. Some of the external input parameters such as atmospheric temperature, rain forecast, wind speed forecast, Soil type and Crop type were simulated to feed the algorithm appropriately so as to cover the multitude of scenarios to test the algorithm. The algorithm successfully passed the testing for all the combinations of inputs, providing the desired output.
These results highlight the algorithm’s ability to dynamically adapt recommendations based on environmental and soil conditions, which is critical for precision agriculture. Unlike traditional empirical approaches, which often rely on fixed schedules or general guidelines, this algorithm adjusts tilling levels and fertilizer requirements in real-time to address field-specific variability. This dynamic capability can significantly reduce resource inefficiencies, a key concern in modern agriculture65.
A sample of testing with different sets of inputs and desired outputs is shown in Table 5 below.
The use of multiple input parameters (e.g., soil moisture, atmospheric conditions) aligns with recent advancements in decision support systems for sustainable agriculture. For instance, Gebbers and Adamchuk (2010) emphasized the importance of integrating environmental data into precision farming systems to enhance resource use efficiency and reduce environmental impact66. Similarly, adaptive algorithms like the one used in this study have been shown to optimize crop yields while minimizing environmental degradation67.
In addition, incorporating real-time weather and soil data reflects a growing trend in AI-driven solutions for agriculture. Research by Zhuang et al.68 highlighted the value of real-time parameter monitoring in reducing fertilizer use and mitigating runoff, particularly in regions prone to nutrient leaching68. These insights demonstrate that data-driven approaches can significantly improve sustainability in farming practices.
This algorithm’s ability to process complex environmental data to provide actionable recommendations for tilling and fertilization highlights its potential for large-scale applications in sustainable farming. By addressing variability across diverse field conditions, it offers a scalable solution to optimize agricultural practices, reduce input waste, and mitigate ecological impacts69,70,71,72.
Simulation Testing Output
The algorithm was further tested using a simulation that was run for 30 years. The results are outlined in Fig. 11 where conventional tillage is compared with the proposed optimal tillage based on four key impact areas—run-offs, carbon emission, nitrous oxide emission, and fertilizer usage reduction on standard line and area charts.
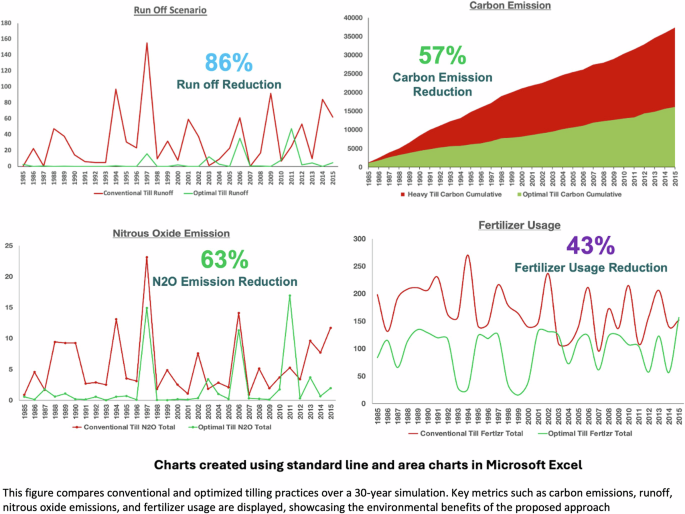
The Comparative Reductions for Key Metrics in the Simulation across Carbon Emission, Run Off, Nitrous Oxide Emission, and Fertilizer Usage.
The simulation results demonstrate the potential global impact of optimized tilling practices. The projected 86% runoff and 57% carbon emissions show how this solution could mitigate environmental impacts, especially in regions prone to soil degradation. These reductions are consistent with findings by Musanase et al.73, who demonstrated that data-driven optimization in agricultural practices can reduce soil erosion by up to 80% while maintaining crop productivity73. Furthermore, the 43% reduction in fertilizer use aligns with research by Nakachew et al.74, which highlights how optimized nutrient management can lower nitrogen runoff and reduce the reliance on chemical fertilizers74.
This study also demonstrates the role of AI-driven simulations in addressing inefficiencies in traditional agricultural practices. For instance, traditional fixed-schedule tilling methods often lead to overuse of fertilizers and increased emissions75. By dynamically adapting to field-specific conditions over a 30-year simulation, the proposed algorithm achieves substantial environmental and economic benefits.
The integration of long-term simulations to evaluate agricultural practices also represents a novel approach. Recent work has emphasized the importance of extended simulation periods to account for cumulative environmental impacts, such as carbon sequestration and nutrient cycling76. This study extends that perspective by providing actionable insights into optimizing tillage practices for sustained environmental and productivity gains.
Such models could be adopted as a standard, complementing international agricultural policies and promoting sustainable land use to help countries meet their environmental goals within frameworks such as the Paris Agreement77. By reducing ecological impacts while maintaining agricultural productivity, this approach offers a scalable and practical solution to align farming practices with global sustainability targets78. Furthermore, the 30-year simulation underscores the potential for long-term gains in soil health and ecosystem stability, critical for achieving sustainable land management79,80.
Comparative Performance of Algorithm vs. Traditional Methods
Traditional tilling and fertilizer practices are largely based on fixed schedules or empirical decision-making and are not adapted to real-time soil and environmental conditions. On the other hand, the algorithm-driven system developed in this study adjusts tilling and fertilization dynamically based on immediate, field-specific data to achieve 43% and 57% reductions in fertilizer use and carbon emissions compared to traditional methods. This adaptability is crucial as it allows field condition fine-tuning to maximize resource efficiency and minimize negative impacts which traditional methods cannot provide.
The ability to fine-tune recommendations based on field conditions highlights the system’s potential to address inefficiencies inherent in fixed-schedule approaches. Research underscores the environmental costs of such rigid systems, noting their failure to account for variability in soil and climate conditions24. In contrast, the dynamic adjustments made by this algorithm align with recent calls for site-specific management, reducing overuse of inputs and enhancing environmental outcomes.
In addition, the algorithm’s adjustments to parameters such as soil moisture and nutrient levels supports a broader shift toward environmentally responsive agriculture. By optimizing tilling depth and fertilizer quantity, the approach addresses economic and ecological inefficiencies in traditional tilling, in which standardized depths and fertilization often result in overuse of resources. For instance, Xiao et al.81 noted that fixed-depth tillage can increase energy consumption and soil erosion in heterogeneous fields81. This study avoids such problems by dynamically adapting to local conditions for both resource conservation and soil health.
Beyond resource efficiency, this work highlights the wider implications of AI-driven agricultural systems. Hoseinzadeh et al.82 showed that such systems can reduce environmental impacts with high yields and thus are useful for sustainability goals and economic viability82. Sharma et al.83 also noted that adaptive tillage systems achieve double digit efficiency gains and are essential for transitioning to sustainable farming83.
This algorithm-driven approach, which dynamically optimizes tilling and fertilization, is a significant step in precision agriculture. It addresses inefficiencies in traditional methods and is in line with wider trends in Sustainable farming and policy frameworks like the United Nations SDGs. Results provide a practical road map for scalability, environmental benefit and economic feasibility of AI-driven solutions in global agricultural practices84,85.
Implications of Findings in Existing Literature
These findings are in line with documented problems of traditional tilling, including soil erosion and nutrient leaching, caused by fixed tilling practices2,5. Traditional tillage practices, particularly those that do not account for soil variability, have long been recognized for exacerbating these issues, leading to increased water runoff and loss of topsoil, which in turn degrade soil fertility over time. Utilizing real-time, data-driven models has received more attention in recent precision agriculture research. For example, Kamilaris and Prenafeta-Bold (2018) highlight CNNs’ potential in agricultural applications, although their study focuses more on yield-focused applications than environmental sustainability38. While many studies emphasize yield optimization, the need to balance high agricultural output with environmental stewardship has become increasingly urgent in the context of climate change and resource depletion. On the other hand, this study demonstrates that intelligent algorithms enabled by CNNs can efficiently mitigate ecological impacts such as carbon emissions and runoff, reinforcing the value of machine learning in global efforts toward sustainable agriculture. This approach aligns with growing research advocating for precision agriculture as a key solution to optimize resource use while minimizing negative environmental impacts.
AI tools, when paired with real-time data, not only improve yield predictions but also contribute significantly to reducing the environmental footprint of farming by optimizing input usage. By achieving measurable reductions in runoff (86%) and fertilizer usage (43%), this work ties in with climate change mitigation efforts under the Paris Agreement and United Nations SDGs86. The demonstrated reductions in fertilizer use and water runoff help address global agricultural problems such as nutrient depletion and water quality degradation. Nutrient management has become one of the most pressing concerns in modern agriculture, and optimizing fertilizer use is critical for both reducing costs and minimizing environmental damage. These results underscore the viability of AI-driven farming solutions as scalable models for mitigating environmental degradation on a global scale.
This work also highlights the need for scalable AI-driven solutions to overcome the efficiency challenges of fixed-schedule farming practices. While fixed-schedule farming was once the standard, the advent of AI and machine learning in agriculture now offers the possibility to optimize farming practices continuously based on real-time data inputs. Papers have mentioned that the combination of advanced sensing technologies with machine learning can significantly improve both economic and environmental outcomes87. AI-driven solutions in agriculture are expected to not only improve profitability but also reduce input waste, enhance crop health, and contribute to sustainable farming practices. This study’s algorithm demonstrates these principles in practice by being able to cope with different soil conditions, which is an important property for a global deployment. The scalability of such systems presents a compelling opportunity for farmers worldwide to adopt cutting-edge technologies that are both economically viable and environmentally sustainable.
Prototype Testing Output
The prototype with the vehicle, sensor module, tiller module, and fertilizer dispensing module was tested for the combinations of input as specified in the section above to ensure that the output calibrations for tilling levels for the tilling system and the fertilizer dispensing system matched the configurations. The prototype successfully passed the testing and produced the desired results, thus acting as a fully functional and demonstrable model of the entire set of inputs and outputs discussed in this study.
Following the successful tractor prototype testing, a stationary version of the prototype was developed with the camera and sensor modules along with a display unit to show status. This prototype was then successfully replicated and deployed in 155 farms across Belgium, the Netherlands, France, USA, and India. Figure 12 shows the stationary version of the prototype.
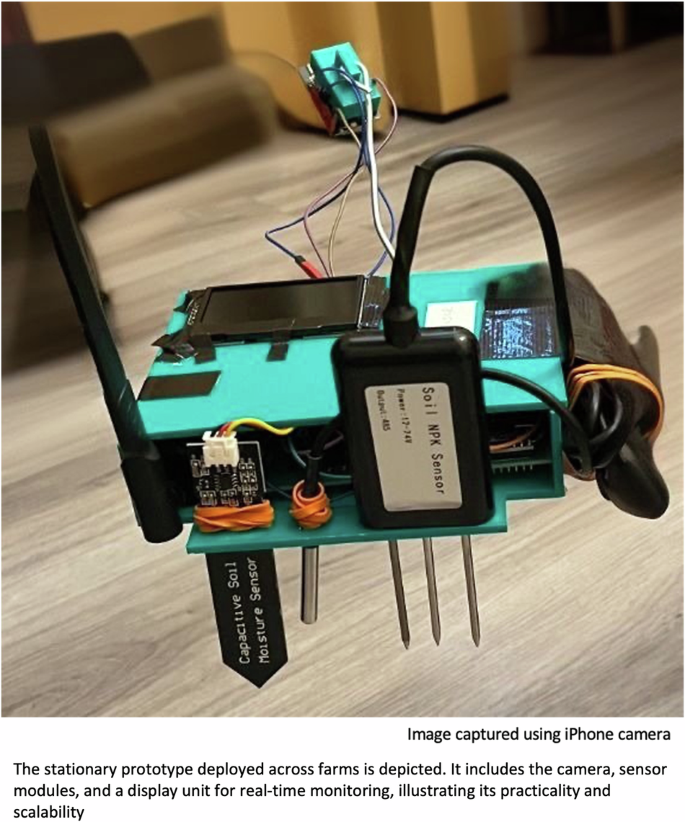
The Final Stationary Prototype that was Deployed Across Farms.
These prototypes do not currently have patented designs and data is gathered from ongoing usage across these farms for further improvements.
Limitations and Areas for Further Research
Although the proposed system shows high accuracy and significant environmental benefits, it has some limitations. The CNN model has been trained on loamy soil samples, so generalizability may be limited for other soil types, such as sandy or clay soils, due to differences in soil characteristics. Future research will improve model robustness by extending the training dataset to cover different soil types. Further refinement of input parameters such as soil microbial health and extended nutrient profiling could also broaden the applicability of the model to other crop systems.
Concluding Remarks
This study demonstrated that first and foremost, a fully automated scientific approach could be taken in measuring the existing tilling intensities of a field. Then, it illustrated that this data could be combined with soil sensor data and other external weather and crop type data using a robust algorithm to determine key outputs such as optimal tilling intensity and fertilizer level. The simulation compared the effects of applying the optimal tilling intensity to fields against the conventional tillage intensities and proved that significant reductions in soil erosion, runoff, carbon release and fertilizer usage could be accomplished. The working prototype brings it all together through a fully automated tilling solution that could be evaluated further for full-size prototyping in the field. Automated solutions enabling optimal tilling could result in far-reaching environmental benefits that are multi-fold as described in this study. Hence, it is highly recommended to develop this prototype into a full-scale automated solution that could transform the industry and the environment.

Responses