A deep learning based ultrasound diagnostic tool driven by 3D visualization of thyroid nodules

Introduction
Thyroid nodule is a common form of endocrine system disease manifested as abnormal growth of thyroid gland cells, with an incidence rate as high as 68%1. Since most thyroid nodules are benign and low-risk, avoiding excessive treatment is essential to prevent unnecessary interventions. The key to effective treatment lies in the ability to accurately diagnose the benign or malignant nature of thyroid nodules2. Ultrasound has been widely acknowledged as the optimal imaging method for diagnosing thyroid nodules3. Specific ultrasound features, such as the composition, shape, and margin, have been demonstrated to be effective criteria for discriminating between malignant and benign nodules3,4,5. Nonetheless, in clinical diagnosis, the evaluation of ultrasound features is time-consuming and subjective, relying heavily on the rich experience of radiologists and the available ultrasound equipment1. Therefore, precise thyroid nodule segmentation can effectively improve the diagnostic efficiency of radiologists6. In addition, accurate estimation of the size and morphology of thyroid nodules through segmentation plays a crucial role in clinical diagnosis and treatment7.
Previous studies have demonstrated the potential of artificial intelligence (AI) models in assisting clinicians with risk assessment and treatment recommendations for thyroid nodules8,9,10,11,12,13. Introducing deep learning (DL) into thyroid nodule segmentation tasks has also achieved satisfactory results, with accurate segmentation outcomes14,15. Notably, DL networks based on attention mechanisms have shown promising outcomes in image segmentation16,17. However, these DL-based studies primarily focus on comparing the segmentation results of DL algorithms with the manually annotated labels by ultrasound experts18, lacking validation for their effectiveness in clinical diagnosis assistance. Currently, a commonly used model of human-AI interaction in research involves radiologists providing static images to AI systems to receive assistance for determining benign and malignant nodules19,20. However, this mode requires radiologists to meticulously interpret nodule images, which not only consumes time and effort but also involves complex procedures. Moreover, the subjective determination of the regions of interest (i.e. nodule sections) by different doctors introduces variability.
In reality, radiologists are recommended to make judgments based on dynamic observations of nodules rather than static images. However, existing research on DL models only deals with small datasets of static ultrasound images21,22,23, which does not resemble the actual clinical environment accurately. Moreover, during the analysis of the ultrasound data, radiologists often need to develop spatial thinking abilities to make better judgments, and AI has proven effective in the three-dimensional (3D) reconstruction of medical images24,25,26. However, there are significant challenges in performing 3D ultrasound reconstruction based on dynamic ultrasound videos. One of the challenges is the unpredictable displacement of the region of interest between adjacent frames due to different scanning skills and paths27. Additionally, each dynamic ultrasound video consists of dozens to hundreds of frames, resulting in a massive annotation workload and high labor costs. Previous study has also demonstrated that unsupervised learning based on 3D dynamic imaging26 can be overly complex and may struggle with convergence and poor feature extraction due to limited labeled data.
In this study, we have developed a DL-based ultrasound diagnostic tool, namely Thyroid Nodules Visualization (TNVis), which utilizes a large dataset of labeled two-dimensional (2D) static ultrasound images to achieve precise segmentation of dynamic ultrasound videos and to enable 3D visualization of thyroid nodules through multi-view fusion. This approach allowed us to fully leverage an existing large dataset of high-quality annotated static images, making it easier to assess both static and dynamic imaging effectively. Our ultrasound diagnostic tool aims to address the limitations in the prevailing human-AI interaction mode and explore new modes of 3D-assisted diagnosis. With this objective, we also investigated whether radiologists could enhance their diagnostic performance using TNVis when interpreting both static ultrasound images and dynamic ultrasound videos.
Results
Patient Characteristics
A total of 5228 cases were included in this study, consisting of 2369 cases with benign nodules and 2859 cases with malignant nodules. The training dataset comprised 4569 cases (mean age, 49 years ± 13; age range, 11-87 years; 3468 women). There were a total of 2072 benign nodules and 2497 malignant nodules. The internal test dataset comprised 509 cases (mean age, 49 years ± 12; age range, 16-76 years; 411 women). There were 231 benign nodules and 278 malignant nodules. The external video test dataset included 150 cases (mean age, 47 years ± 11; age range, 22-77 years; 116 women). There were 66 benign nodules and 84 malignant nodules. Detailed demographic data are described in Table 1. Detailed demographic data of each center’s dataset in the external video test dataset are described in Supplementary Table 1.
Performance of the DL models
The segmentation performance of TNVis and four classic CNN models using static ultrasound images is presented in Table 2. TNVis demonstrates superior performance compared to the classic CNN models in nearly all segmentation metrics. Specifically, the DSC, which serves as the main evaluation metric, achieved a value of 0.90, significantly higher than the values of 0.88 (p = 0.007) for Attention Unet and 0.88 (p < 0.001) for Unet + + (Table 2, Fig. 1). Especially in terms of fine details and challenging images, TNVis demonstrates even more outstanding performance (Supplementary Figure 1).

a Segmentation performance of TNVis and different models on the static ultrasound image test set. The error bars in the bar chart elements represent the standard deviation of metric scores. b Segmentation performance of TNVis on the external video test set. A wider area on the violin indicates a higher data density, and fewer outliers, which suggests better segmentation quality. DSC, dice similarity coefficient; HD95, 95% Housdorff Distance; Acc, accuracy; Rec, recall; Spec, specificity; IoU, Intersection over Union; MEI, shape evaluation index.
TNVis also demonstrates satisfactory results on dynamic ultrasound videos, as shown in Table 3. TNVis achieved an average MEI lower than 0.1 on each external test dataset, with a relatively balanced score distribution. Overall, the mean MEI1 is 0.06 [0.01, 0.11], the mean MEI2 is 0.05 [0.00, 0.10], and the mean MEI3 is 0.05 [0.00, 0.10] (Table 3, Fig. 1). Compared to traditional CNN methods, the visualization results of thyroid nodules obtained with TNVis are more continuous and smooth, achieving a satisfactory outcome (Fig. 2).
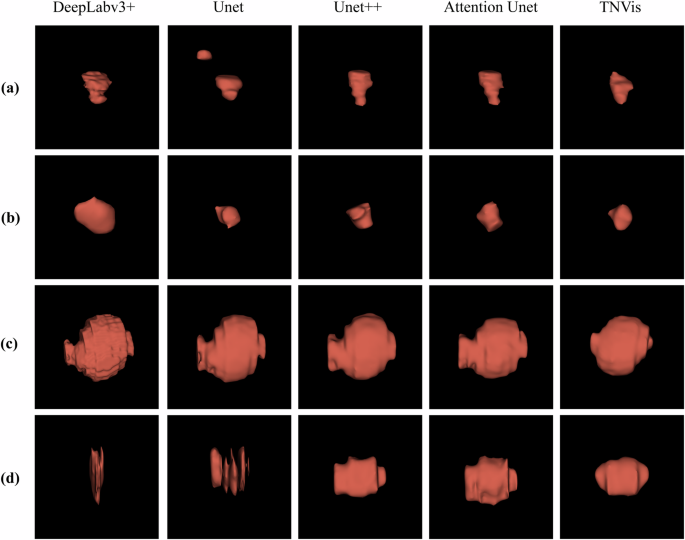
a, b Visualization results of malignant thyroid nodules. c, d Visualization results of benign thyroid nodules.
Diagnostic performance of the radiologists and DL models
In the experiment evaluating TNVis-assisted diagnosis, the AUC of radiologists in the first stage was 0.66 (95% CI: [0.63, 0.69]), and it increased to 0.72 (95% CI: [0.69, 0.75]; p < 0.001) in the second stage with partial performance of TNVis, and further improved to 0.79 (95% CI: [0.77, 0.82]; p < 0.001) in the third stage with full performance of TNVis. For senior radiologists, the AUC in the first stage was 0.73 (95% CI: [0.68, 0.77]), which increased to 0.76 (95% CI: [0.72, 0.80]; p = 0.009) in the second stage and further improved to 0.82 (95% CI: [0.78, 0.85]; p < 0.001) in the third stage. For junior radiologists, the AUC in the first stage was 0.59 (95% CI: [0.55, 0.64]), which increased to 0.68 (95% CI: [0.64, 0.73]; p < 0.001) in the second stage and further improved to 0.77 (95% CI: [0.73, 0.81]; p < 0.001) in the third stage (Table 4). With the help of TNVis, the accuracy of junior radiologists increased from 0.59 to 0.77, and the k-value increased from 0.18 to 0.54, with a greater improvement than that of senior radiologists (Table 4). In the radar chart, it is more evident that the improvement of three junior radiologists on each index is greater than that of three senior radiologists (Fig. 3). The detailed specific metric scores of each radiologist’s diagnostic performance at three stages on different center datasets in the TNVis-assisted diagnostic experiment can be found in Supplementary Table 2. In addition, according to the Delong test (Fig. 4), the AUC of each radiologist in the third stage was significantly different from that in the first and second stages (p < 0.05). For each junior radiologist, there was no significant difference in the AUC between the third stage and the AUC of senior radiologists (p > 0.05).
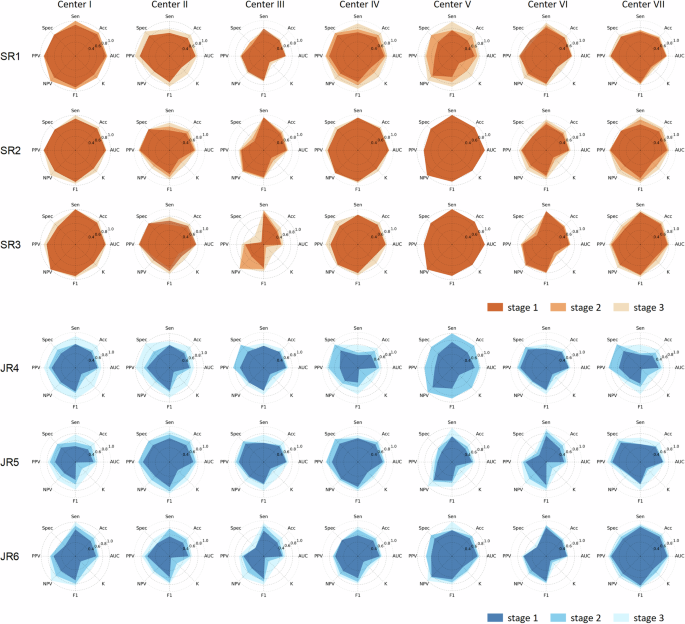
The study evaluates the diagnostic performance of senior and junior radiologists, with or without the assistance of TNVis, in distinguishing benign and malignant thyroid nodules. SR, senior radiologists; JR, junior radiologists; AUC, area under the receiver operating characteristic curve; Acc, accuracy; Sen, sensitivity; Spec, specificity; PPV, positive predictive value; NPV, negative predictive value; F1, F1 score; K, kappa.
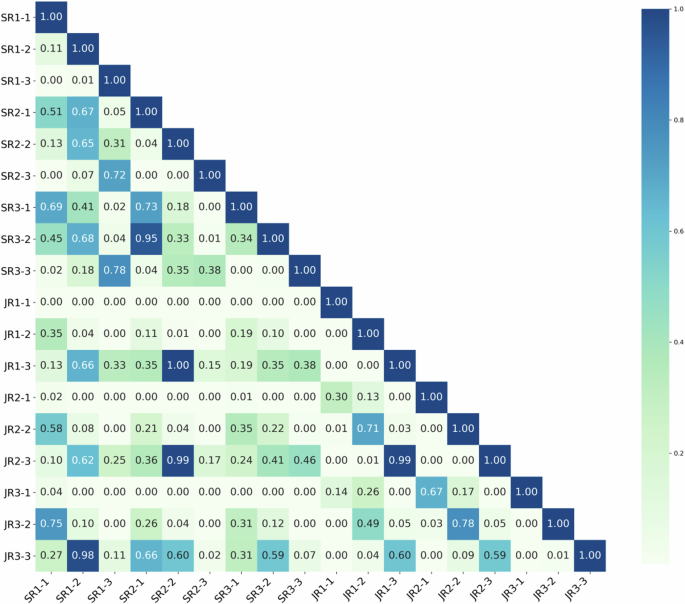
The p-values comparing the diagnostic performance of different radiologists at different stages in the TNVis-assisted diagnosis experiment. SR1-SR3 represent three senior radiologists with more than 8 years of ultrasound diagnostic experience, while JR1-JR3 represent three junior radiologists with 1–3 years of ultrasound diagnostic experience. SR, senior radiologists; JR, junior radiologists; -1, stage1; -2, stage2; -3, stage3.
Discussion
AI-assisted diagnosis has become a highly debatable topic and a fast developing field. Recognizing the weaknesses of existing CAD tools. The study developed a more practical DL-assisted diagnostic tool for the clinical diagnosis of thyroid nodules. Previous preliminary research has demonstrated the effectiveness of DL in assisting diagnosis10,12,28. However, these studies primarily rely on static ultrasound images as their assisted diagnostic strategy, which provides limited information and lacks practicality, considering that radiologists often rely on dynamic ultrasound videos for clinical diagnosis. In contrast, DL research based on dynamic ultrasound videos has shown superior performance, which aligns with the conclusions drawn from this study29,30. Therefore, a DL system based on dynamic ultrasound videos holds great potential to enhance the accuracy and practicality of AI-assisted diagnosis. To the best of our knowledge, this study is the first to utilize DL for 3D visualization of thyroid nodules as an aid in thyroid nodule diagnosis. TNVis was developed solely relying on a large number of labeled 2D static ultrasound images and successfully achieved accurate segmentation of dynamic ultrasound videos and 3D visualization of thyroid nodules. TNVis demonstrated high accuracy in nodule localization and segmentation on 2D static ultrasound images (average Dice score of 0.90 on the internal test set) and exhibited a high level of shape similarity in video segmentation and 3D visualization of nodules (average MEI less than 0.1 on the external video test set), providing a solid foundation for assisting radiologists in diagnosis. In this prospective study, the utilization of TNVis enabled radiologists to make more accurate diagnoses of thyroid nodules within a shorter period of time, resulting in a significant increase of 0.14 in AUC (p < 0.001), indicating its potential for efficient, non-invasive, and cost-effective diagnosis of thyroid nodules in clinical practice.
In comparative experiments, TNVis outperformed the improved UNet models, namely the Attention UNet model with attention mechanisms and the UNet + + model with multi-scale feature fusion, on 2D static ultrasound images31,32. This indicates that the group attention mechanism employed in the Swin-Unet architecture better captures features and contextual information at different scales in static ultrasound images. Classical semantic segmentation models such as UNet and DeepLabV3+ exhibited significantly poorer performance in thyroid nodule segmentation compared to our TNVis, suggesting that these models may struggle to capture fine details in challenging static ultrasound images33,34. In the experiments of dynamic ultrasound video segmentation, TNVis also demonstrated satisfactory results, even in the face of unpredictable inter-frame displacements. We incorporated multi-view feature information in the post-processing module to correct and alleviate this issue in the 3D results. In particular, we considered shape information, which has been shown to be correlated with malignant risk in thyroid nodules5,35,36. Therefore, in prospective experiments, we proposed shape evaluation metrics (MEI) to validate the credibility of deep learning visualization of thyroid nodules. Ultimately, the average MEI was less than 0.1, indicating a high level of credibility for TNVis. The research results on assisting radiologists in diagnosis also confirmed this, as each radiologist exhibited significant differences in AUC across the three stages (p < 0.05), demonstrating TNVis’s role in improving diagnostic accuracy. Notably, junior radiologists were able to achieve a comparable level to senior radiologists (p > 0.05) with the assistance of TNVis.
In future research, we will prioritize validating the effectiveness of the TNVis method by applying it to datasets from various diseases. This will help with further enhancing its generalizability. We also aim to integrate new features into the TNVis system, such as deep learning-based classification predictions, as well as risk stratification predictions, to provide more comprehensive diagnostic assistance. Moreover, we can adopt appropriate de-speckling algorithms to remove image noises/artefacts in order to retain the diagnostically important structural edge features37, enabling its application in more complex clinical scenarios. We believe there is significant potential for its use in guiding clinical procedures and will explore the feasibility of utilizing the TNVis system for intraoperative surgical guidance in the future.
Our study has several limitations. Firstly, the dataset used for training and testing TNVis is imbalanced with regard to the number of cases of benign and malignant nodules, with a higher prevalence of malignant nodules. This imbalance may impact the model’s accuracy in distinguishing between benign and malignant thyroid nodule segmentation. In future work, we plan to expand the dataset further to mitigate the impact of data imbalance. Additionally, the current TNVis system focuses on detection, segmentation, and 3D visualization of thyroid nodules, yet its functionality remains insufficiently robust. Furthermore, in more complex scenarios like surgery, the 3D reconstruction performed by the TNVis system may not adequately capture the edges of the nodules, limiting its current application to diagnostic support.
In conclusion, our study successfully demonstrated the advantage of 3D visualization-based diagnosis of thyroid nodule. The TNVis system, leveraging a two-stage deep-learning framework significantly improved the diagnostic accuracy of benign and malignant thyroid nodules by radiologists. We believe that the findings of this research will serve as a catalyst for future investigations concerning thyroid nodule 3D visualization, as well as their utilities in the clinical settings.
Materials and Methods
This study was approved by the Ethics Committee of Zhejiang Cancer Hospital. For retrospectively collected static ultrasound images, informed consent was waived for all cases (IRB-2020-287). Written informed consent was obtained from cases for prospectively collected dynamic ultrasound videos (IRB-2021-1033).
Study design and datasets
This is a multicenter diagnostic study in which data were collected from seven hospitals in China. The static ultrasound image dataset was obtained from the Thyroid Ultrasound Imaging Database at Zhejiang Cancer Hospital, which was used for developing TNVis. We retrospectively retrieved cases with thyroid nodules that had definitive benign or malignant pathological results (postoperative histopathology or preoperative FNA cytology results classified as Bethesda II or VI) between Jan 2008 and Dec 2020. The dynamic ultrasound video data were collected from seven independent centers (Zhejiang Cancer Hospital serving as the main center), and we included cases with thyroid nodules that had definitive benign or malignant pathological results (as mentioned earlier) between Jan 2021 and May 2023. All preoperative ultrasound imaging data were initially included, but low-quality or low-resolution images were excluded after screening.
For the development and evaluation of TNVis, a total of 9404 2D static ultrasound images with segmentation annotations from 5173 cases were included in this study, with 179 images excluded due to poor image quality. The 2D static ultrasound images were randomly divided into training and testing sets based on the case ID, with a ratio of 9:1, and the cases in these two sets were mutually independent. A total of 4569 cases (8302 images) were used for model training, and 509 cases (923 images) were used for model testing (Fig. 5). For the 3D visualization of thyroid nodules task, we collected 300 unannotated dynamic ultrasound videos from 150 cases across seven independent hospitals to serve as an external video testing set, which also included corresponding 300 maximum-diameter slice images. All data were anonymized to protect patient privacy.
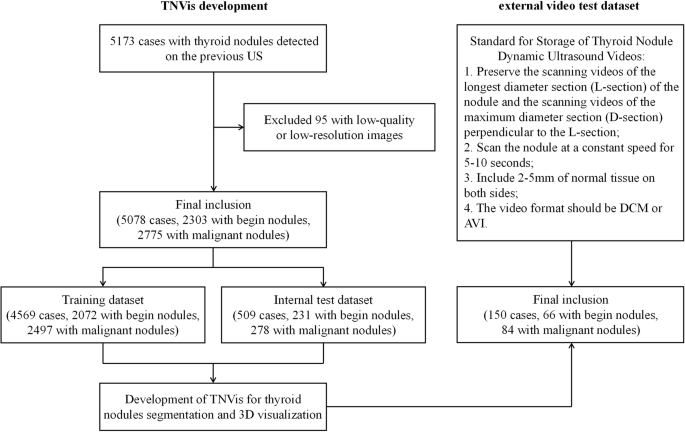
For the development and evaluation of TNVis, a total of 9225 2D static ultrasound images with segmentation annotations from 5078 cases were finally included in this study. For the external video testing, a total of 150 cases were included in accordance with the established standards for the storage of thyroid nodules dynamic ultrasound videos.
Construction of DL models
TNVis is a two-stage DL framework that enables automatic detection, segmentation, and visualization of both static ultrasound images and dynamic ultrasound videos (Fig. 6). The first stage of TNVis consists of an object detection model and a region of interest (ROI) extraction module, while the second stage of TNVis consists of a segmentation model and a post-processing module.
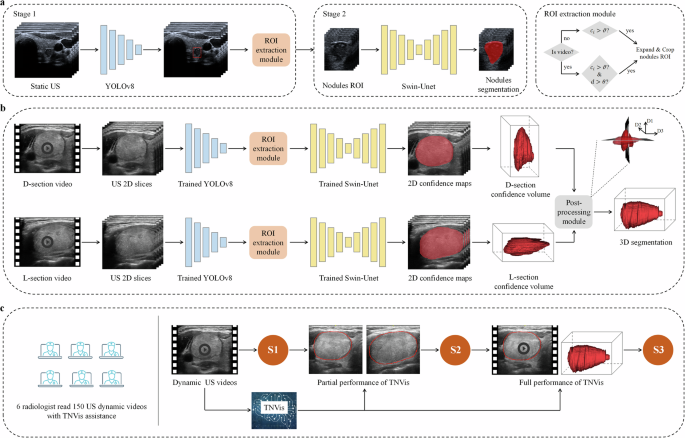
a The training and testing process of the TNVis backbone network. ({c}_{i}) represents the confidence score, (vartheta) is the confidence threshold, (d) is the Euclidean distance for sliding the centroid of adjacent frame bounding boxes, and (theta) is the sliding threshold. b The framework of TNVis for visualizing thyroid nodules. Please note that D1, D2 and D3 denote the diameters of the nodules along the long, vertical, and horizontal axes, respectively. c Assisting the radiologists in the diagnosis process with the TNVis. S1 represents the initial diagnostic results of radiologists based on dynamic ultrasound videos in Stage 1. S2 represents the second diagnostic results of radiologists in Stage 2 after incorporating the partial performance of TNVis. S3 represents the third diagnostic results of radiologists in Stage 3 after integrating the full performance of TNVis.
In the first stage, we employed the highly efficient and robust YOLOv8 object detection model to achieve end-to-end detection. The YOLOv8 model effectively utilizes multi-level feature maps for precise object detection and employs Focal loss to address the issue of class imbalance. This approach enables the model to adapt effectively to nodules of various sizes, including small-sized nodules, as well as the potential motion and deformation between frames in dynamic ultrasound videos. In the ROI extraction module, we proposed specific strategies for static and dynamic extraction to extract ROI from static ultrasound images and dynamic ultrasound videos, respectively. For static ultrasound images, we leveraged the confidence scores ({c}_{i}) of each predicted bounding box from the object detection model to filter out reliable detection boxes. When ({c}_{i}) exceeded the confidence threshold (vartheta), the corresponding bounding box was retained. To provide more contextual information related to the target nodules, we expanded the final boundary boxes of the detections by a factor of 1.3. If the expanded ROI boundary extends beyond the size of the original image, the boundary of the original image itself will be used as the ROI boundary. For dynamic ultrasound videos, in addition to filtering reliable detection boxes based on confidence scores, we also implemented continuity detection to ensure consistent tracking and accurate assessment over time. Due to the smooth motion exhibited by target nodules in standard dynamic ultrasound videos across consecutive frames, we set a reasonable sliding threshold (theta) to exclude cases where the detection boxes between adjacent frames experience abnormal movement. If the Euclidean distance (d) between the centroids of two bounding boxes was found to be less than the sliding threshold (theta), the corresponding bounding box was retained. Notably, considering that target nodules almost do not move across five adjacent frames, we defined five adjacent frames as a fixed block. Within each fixed block, the same bounding box was assigned to extract ROIs. The selection of values for the confidence threshold (vartheta), sliding threshold (theta), and the use of five adjacent frames as a fixed block were empirical choices in this study. Moreover, to ensure an overlap region between adjacent fixed blocks and improve the continuity of subsequent segmentation results, we employed an overlapping sliding window strategy.
Owing to challenges such as fuzzy echo features and noise in ultrasound images, the accurate segmentation of thyroid nodules in both static ultrasound images and dynamic ultrasound videos presents a significant problem. Therefore, we employed the Swin-Unet network as the backbone of the second-stage segmentation model. The Swin-Unet, which combines the Swin Transformer and U-Net, offers several advantages, including efficient perception, the ability to handle large images, cross-level feature fusion, and interpretability38. Leveraging these attributes, this model can effectively capture detailed features and contextual information within the images, thereby facilitating the precise segmentation of thyroid nodules. Additionally, we developed a post-processing module for the 3D reconstruction of thyroid nodules in dynamic ultrasound videos. Due to factors such as scanning speed, it is not feasible to achieve real and accurate reconstruction solely based on a single view from a dynamic ultrasound video. Therefore, we proposed a novel strategy that simulates the process that radiologists use when interpreting these videos. By applying a multi-view fusion algorithm to integrate spatial information from multiple viewing angles, we were able to address this challenge. Specifically, we conducted separate segmentation on both transverse and longitudinal videos to identify the largest diameter cross-section from the video segmentation results, capturing the true shape features of nodules in 3D space. Finally, by combining these real shape characteristics, we accurately reconstructed the true 3D shape of the nodules.
Validation of DL models
The static ultrasound images used for training and validation in this study were randomly selected from an individual thyroid ultrasound image database. To ensure a fair comparison, both TNVis and classic convolutional neural network (CNN) models (such as the UNet series and DeepLabV3 + ) were trained and validated on the same training and testing sets. All models were implemented on an Ubuntu 20.04 system using the ultralytics and PyTorch 2.0.1 frameworks, with the host machine equipped with an Intel(R) Core(TM) [email protected] G CPU and an NVIDIA GeForce RTX 3070 Ti 8GB GPU. During the training process, the batch size was set to 24 with 300 epochs. Our model comprised 27.17 M parameters and completed 3D reconstruction during testing with an average processing time of 13.17 s.
In this study, the criteria for selecting thyroid nodule dynamic ultrasound videos for prospective testing of TNVis-assisted diagnostic performance were as follows: videos of the longest diameter section (L-section) of the lesion and videos of the maximum diameter section (D-section) perpendicular to the L-section (scanning the nodules at a constant speed for 5–10 s, including 2–5 mm of normal tissue on both sides, in DCM or avi format). The inclusion of scanning videos was reviewed by a senior radiologist. Subsequently, six radiologists, including three junior radiologists (1–3 years of experience) and three senior radiologists (>8 years of experience), participated in the performance testing of TNVis-assisted diagnosis. The performance testing of TNVis-assisted diagnosis was divided into three stages. In the first stage, radiologists made independent diagnoses by viewing dynamic ultrasound videos. In the second stage, radiologists used partial performance of TNVis to aid the diagnostic process. Specifically, in addition to providing the dynamic videos, two segmented L-section and D-section images generated by TNVis were provided for the radiologists to assist in their diagnosis. In the third stage, radiologists utilized the full performance of TNVis to aid the diagnostic process. Specifically, in addition to providing the dynamic videos, TNVis-generated segmented dynamic ultrasound videos and 3D visualization results of thyroid nodules were also provided for the radiologists to assist in their diagnosis. The diagnostic results from all three stages were compared to validate the performance of TNVis-assisted diagnosis. Radiologists were blinded to the pathological examination results of the thyroid nodules prior to making their diagnoses.
Statistical analysis
All statistical analyses were performed using the Python language. For continuous values, we calculated means and standard deviations (SD). Comparisons with two-sided p-values less than 0.05 were considered statistically significant. The Dice Similarity Coefficient (DSC) was utilized as the primary metric to evaluate segmentation performance. The DSC is calculated using Eq. (1).
where (X) represents the set of predicted segmentation pixels, and (Y) represents the set of ground truth segmentation pixels. Additionally, we compared the 95% Hausdorff distance (HD95), accuracy (Acc), recall (Rec), specificity (Spec), and intersection over union (IoU).
The shape evaluation index (MEI) was defined to assess the morphology of thyroid nodules. Given the nodule is a 3D object, the MEIs are calculated using Eqs. (2) through (4).
Where ({{rm{D}}1}_{{rm{P}}}), ({{rm{D}}2}_{{rm{P}}}) and ({{rm{D}}3}_{{rm{P}}}) denote the diameters of the nodules along the long, vertical, and horizontal axes, and ({{rm{D}}1}_{mathrm{GT}}), ({{rm{D}}2}_{mathrm{GT}}) and ({{rm{D}}3}_{mathrm{GT}}) represent the actual diameters of the nodules along the long, vertical, and horizontal axes. These three indices represent the differences in the ratio between the long diameter and the vertical diameter, the ratio between the vertical diameter and the horizontal diameter, and the ratio between the horizontal diameter and the long diameter, respectively. Clearly, a closer MEI value to 0 indicates that the predicted results of the model are shapely closer to the ground truth.
The area under the receiver operating characteristic curve (AUC) with a 95% confidence interval was utilized as the primary metric to evaluate radiologists’ diagnostic performance. The AUC is calculated using Eq. (5).
where ({ROC}left(xright)) represents the true positive rate as a function of the false positive rate. Further details regarding the statistical analysis can be found in the Supplementary Material. Additionally, we compared the sensitivity (Sen), specificity (Spec), accuracy (Acc), positive predictive value (PPV), and negative predictive value (NPV).


Responses