A global assessment of preferential access areas for small-scale fisheries
Introduction
Ocean space has increasingly been enclosed in order to capture the benefits it offers for the development of national societies. Yet enclosure is unequal, often excluding the quietest voices in society1. For centuries, governments recognized the freedom of the seas doctrine, claiming only a narrow coastal belt of ocean space, typically the area from shoreline to three nautical miles that could be enforced with a “cannon shot”2,3. With agreement on the Law of the Sea Treaty in 1982 (UNCLOS), governments claimed the largest enclosure of ocean space in modern history, extending sovereign rights to exploit fish resources out to 200 nautical miles from the shoreline—in some cases erasing traditional or indigenous fishing claims existing for millennia4,5,6. Original coastal small-scale fishing communities have since struggled throughout the world to have their fishing right claims recognized by states7, particularly in the face of expanding industrial fishing8. While industrial or large-scale fishing pressure has slowed in temperate marine waters under the jurisdiction of wealthier countries9, this pressure continues to grow throughout the tropics where most indigenous and local small-scale fishers are found10,11,12. According to some accounts, growing fishing pressure is one of the largest threats small-scale fishers and fishworkers perceive1. Recent analysis comparing publicly available vessel tracking from satellite-based automated information systems (AIS) with synthetic aperture radar (SAR) imagery indicates that apparent large-scale fishing vessel activity, especially in waters offshore of lower-income countries, may be significantly underestimated13.
On top of competing claims for space and resources by large-scale fisheries throughout the tropics, other industrial uses of the ocean have accelerated rapidly in the last two decades, e.g., offshore wind, container shipping, aquaculture, etc.14. This ‘blue growth’ has occurred alongside growing claims on ocean space for conservation, e.g., to achieve global biodiversity targets to conserve 30% of national areas by 203015. Competing claims on coastal ocean space and resources place coastal small-scale fishing communities under multiple external pressures that threaten the livelihoods they support16. Given these pressures, policy-makers have committed to securing small-scale fisheries as part of the global framework for sustainable development, e.g., through the endorsement of the Voluntary Guidelines for Securing Sustainable Small-Scale Fisheries in the Context of Food Security and Poverty Eradication (herein SSF Guidelines)17.
The tension between policy commitments to small-scale fisheries and competing claims on ocean space makes this an important moment to take stock of the policy instruments that governments have put in place to secure access for small-scale fishers. At this time, there is also the opportunity to ensure coherence in global policy processes promoting a blue economy18 with agreed principles for inclusion and equity articulated in the SSF Guidelines17. Small-scale fishers are the largest group of ocean users (90% of the world’s fishers19), but smallest in visibility and voice. Yet, during the United Nations Oceans Conference (UNOC) in 2022, there was a unified call for action by the African Confederation of Small-Scale Fisheries Professional Organizations (CAOPA) and other fisher groups, which was picked up by some news outlets (e.g., The Guardian) but not by UNOC. The first action called for governments to “urgently secure preferential access and co-manage 100% of coastal areas”20.
The “coastal squeeze” small-scale fishing communities face from multiple pressures, particularly from large-scale fisheries13, reflects findings that, on average, the majority of marine small-scale fish catch is taken within 10 km from the shoreline (69%) and by vessels with relatively small engines (less than 100 hp) that cannot support long fishing trips (75%)21. This finding underscores the importance that access to near-shore ocean space has as the basis for maintaining livelihoods and adequate nutrition supply for hundreds of millions of people22,23. This importance has been recognized by the UN Sustainable Development Goals (SDGs) in Target 14 (specifically 14.b), which states the importance of providing access for small-scale artisanal fishers to marine resources and markets24. Access to near-shore ocean space constitutes a necessary condition for broader access to sustainable development for coastal inhabitants. Not surprisingly, access is one of the six dimensions of food security, includes both physical and economic dimensions25, and is deemed key for food system resilience26. In sum, in addition to Sustainable Development Goal 14, secure access to ocean space for coastal inhabitants is necessary for the attainment of Sustainable Development Goal 2 (SDG 2-zero hunger), good health and well-being (SDG 3), no poverty (SDG 1), reduced inequalities (SDG 10), gender equality (SDG 5), and decent work and economic growth (SDG 8).
Previous empirical studies have found that the most common policy tool to grant access to fishing resources are licenses24. Licenses govern most of the catch from small-scale fisheries, however, they do not provide secure access to marine resources in relation to competing claims from other (sub)sectors on space or resources24.
Preferential access areas (PAAs, also interchangeably termed: inshore exclusion zones or IEZs) constitute a spatial policy tool that has received limited attention in the scholarly literature compared to territorial use right fisheries (TURFs)27. We differentiate TURFs from preferential access areas in that the former are usually defined as small and locally bounded27 while preferential access areas are designated to the entire coastline at either national or sub-national levels. Here we focus on this gap in the literature to provide a global assessment of the status of preferential access areas and explore their potential for the sustainable development of small-scale fishing communities.
Previous studies have noted that preferential access areas constitute access rules to territorial waters that give preference to small-scale fishers over larger-scale fishing, based on operating characteristics such as vessel size or fishing method28,29. In coastal waters along the African continent, for instance, preferential access areas have been designed and introduced by governments with the goal of protecting small-scale fisheries from negative impacts or conflicts with large-scale fishing activity, such as bottom trawling29,30. Matching the size of the preferential access area to small-scale fishers’ traditional fishing areas seems key to mitigating conflict in these spaces4. Preferential access areas have also been proposed as a tool to address overcapacity, a recognized driver of overfishing in Southeast Asia31. In this paper, we provide a global assessment of the status of preferential access areas as a policy tool to secure access to near-shore ocean space for small-scale fisheries, based on initial identification of areas in the Illuminating Hidden Harvests study1 and subsequent review of the FAOLEX database. We ask several questions intended to characterize the prevalence of PAAs worldwide and start to consider the role of this policy tool in the sustainable development of coastal and island states: How common is this policy tool worldwide? How is it defined, and what are its main policy goals? Is it increasingly used by countries? What user rights does it confer to small-scale fishers? What is the amount of small-scale fisheries activity inside preferential access areas and its importance for sustainable development in coastal areas? Based on our findings, we propose an agenda for future research and policy action.
Results
The where, how, and what of preferential access areas as a policy tool in coastal waters
We found preferential access areas are mostly located in lower and lower-middle-income countries throughout the tropics (Fig. 1), where large-scale fishing capacity and effort have steadily grown in recent decades32 and where the world’s small-scale fisheries are concentrated22. Forty-four countries have established a total of 63 preferential access areas, and distance to shore is the most frequent defining criterion (Supplementary Fig. 1a). Preferential access areas can have a national (Supplementary Table 1) or sub-national jurisdiction (Supplementary Table 2), and explicitly mention small-scale fisheries and fisheries management as their most common goal (see Supplementary Fig. 1b, c, and the Supplementary Notes for narrative examples).
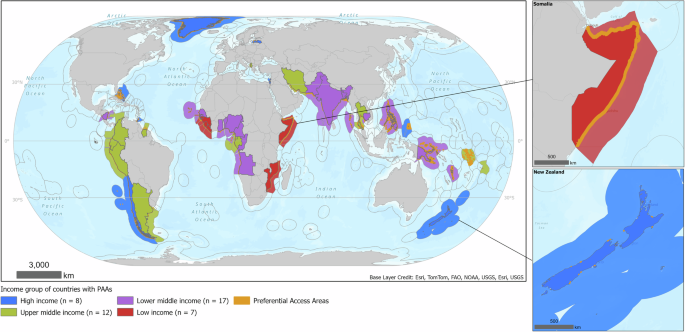
Exclusive economic zones (EEZs) are shown with gray lines.
User rights in preferential access areas
Most preferential access areas restrict ‘non-artisanal fishing’ or put restrictions on non-artisanal fishing gear and boat size (Fig. 2). Yet, preferential access areas alone do not confer additional user rights to small-scale fisheries beyond de jure or de facto access and withdrawal (Supplemental Fig. 2, Supplemental Table 3). However, countries with preferential access areas have a much larger fraction of their small-scale fisheries catch generated from co-managed fisheries (defined by their level of devolved rights) than countries without preferential access areas (as expressed in written regulations). See comparison in Supplementary Tables 4–6.
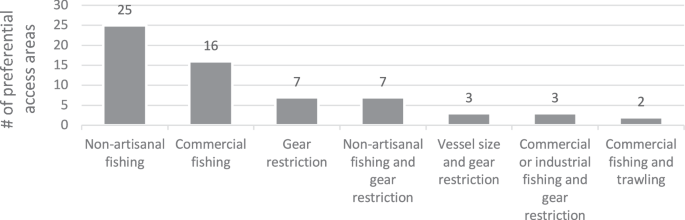
Preferential access areas exclude large-scale fishing vessels and/or their fishing gear. Figure lists the different definitions used to express what is excluded and the number of preferential access areas using each definition.
Have governments increasingly designated preferential access areas over time?
Yes, they have. The first preferential access area was designated in 1977 by the government of Cameroon (see Supplementary Notes) and became more widely used after the 1982 agreement on UNCLOS and the establishment of economic exclusive zones (EEZ). The portion of global EEZ areas designated as preferential access areas more than tripled from the mid-1990s to the end of 2022 (after the enactment of FAO’s code of conduct (1995) and the SSF Guidelines (2015)), currently covering a (very small) global area of the ocean equivalent to 1.3% of all EEZs (Figs. 3), and 3.2% of all continental shelf area, where much of small-scale fishing takes place (Fig. 3).
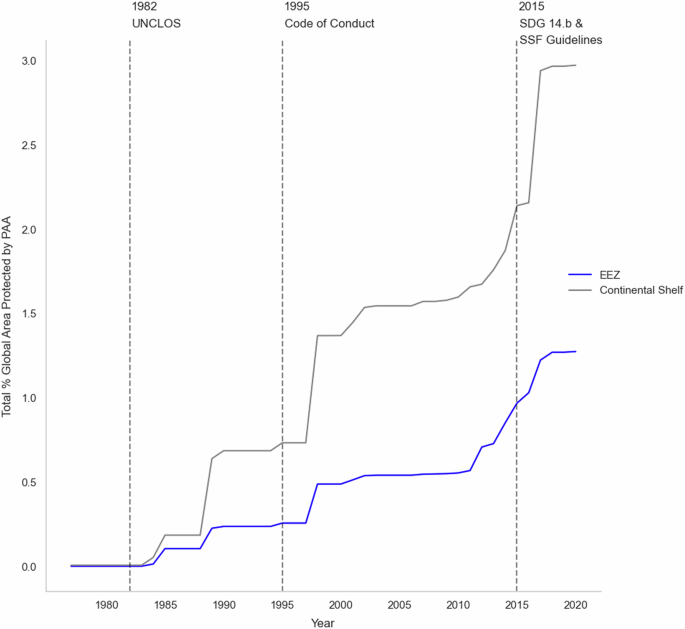
Gray and blue lines show percentage of global coverage for continental shelf area and Exclusive Economic Zone (EEZ) respectively. Largest one-step increases in coverage happened after the enactment of the 1995 FAO’s Code of Conduct, and the 2015 SSF Guidelines and SDG 14.b.
Lower-middle income countries in Oceania, the Americas and Asia have designated the largest share of ocean area as preferential access areas (Supplementary Fig. 3a, b). Moreover, all countries (n = 38) with national-level preferential access areas and for which there is employment data (all countries except Palau and Tuvalu), employ almost a quarter (24%) of the world’s commercial marine small-scale fishers. This figure only considers fishers employed in the harvesting segment. The amount would be higher if we had also included small-scale fishers working in sub-national-level preferential access areas and in the pre and post-harvesting segments19.
The potential importance of preferential access areas for sustainable development
Sustainable development in coastal fishing areas is not possible without knowing the volume of fish caught, its value, the amount of highly nutritional species in the catch, and the number of people fishing inside these areas for subsistence or self-consumption. Thus, we estimated the percentage of total marine catch volume, total landed value, total landings of highly nutritious species, and the amount of people fishing for subsistence inside preferential access areas, for all countries and years for which data was available. This resulted in a sample of 12 countries on three different continents for the year 2017, except for subsistence fishers. For subsistence fishers, data was available for a sample of 31 countries (out of the 38 that have national-level preferential access areas) for the year 2016. Estimations were based on available catch data22 linked to the distance from the coast fishers traveled to obtain their catch (Supplementary Table 7)1, making it possible to estimate small-scale fisheries catch sourced inside and outside preferential access areas (see Supplementary Notes for details). Large-scale fisheries catch was assumed to occur in its totality outside of the preferential access areas, an assumption that is not always met but kept for the purposes of this analysis.
We found for our sample of 12 countries that in aggregate most marine catch (62%) from small-scale fisheries in 2017 was caught inside of national-level preferential access areas (Supplementary Table 8). This represented 30% of their total catch when large-scale fisheries were also considered (Supplementary Table 8).
We also found wide variation among countries, while some countries in our illustrative sample (i.e., Bangladesh, Chile, the Gambia, Nigeria and the Philippines) sourced all or almost all of their marine small-scale fisheries catch from within preferential access areas. Some others like Congo, Ghana, Guinea, Peru and Senegal sourced none or almost none that year (Supplementary Table 8).
In terms of the total landed value of the catch for these 12 countries, in the aggregate, at least 59% was produced inside preferential access areas in 2017, representing 77% of the total small-scale fisheries catch (Supplementary Table 9). Again, wide variation was noticeable, with some countries like Bangladesh, Chile, Nigeria, and the Philippines obtaining all their marine fisheries landed value from inside preferential access areas and others like Congo, Ghana, Guinea, and Peru none or almost none at all.
In terms of the percentage of highly nutritious catch (defined as the fraction of total catch by volume that came from either herring, sardines, anchovies, shad, and scad or mackerel33), we found that six countries caught all their herring, sardine, and anchovy inside preferential areas in 2017 (Bangladesh, Chile, Gambia, Guinea-Bissau, Philippines, and Sierra Leone). Four countries caught almost none (0–1%) of these species inside preferential areas (Congo, Guinea, Liberia, and Senegal), and catch data by species was not available for Ghana and Nigeria (Supplementary Table 10).
Finally, for a larger sample of 31 countries, we found that more than half of the small-scale fishers (59%) in most of the countries (70.5%) fished solely for self-consumption (i.e., subsistence), which we assumed to take place entirely inside of the preferential access areas (Supplementary Table 11).
When the different dimensions of catch, landed value, highly nutritious species harvested, and number of people fishing for subsistence are taken together, at least one of the dimensions is very salient for all 12 countries in our sample (Fig. 4). Nigeria obtained almost all its small-scale fisheries catch and landed value in 2017 inside of its preferential access area but only about 25% of their fishers depended on their preferential area for subsistence fishing. In contrast, Congo and Guinea showed high numbers of people reliant on subsistence fishing but almost no catch and landed value, and as a consequence, almost any highly nutritional species, were sourced from inside their preferential access areas. This situation suggests a double-reinforcing vulnerability emerging in these countries: food insecurity and lack of fishing resources. It is likely fishers need to go farther out beyond their preferential access areas at an increased risk to their personal safety.
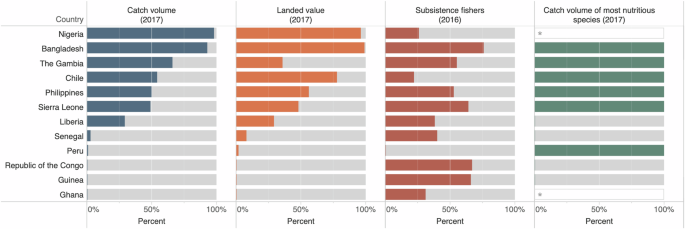
Figure shows a sample of 12 countries for which data was available and the percentage of volume of fish caught inside preferential access areas (blue bars), its landed value (orange bars), the number of people fishing for subsistence or self-consumption (red bars), and the amount of highly nutritional species harvested (green bars). For all countries preferential access areas are very salient for at least one of the dimensions of sustainable development mentioned above.
Of note are Bangladesh, Philippines and Sierra Leone, where preferential access areas are of high relevance for all of the four dimensions of sustainable development discussed above.
Discussion
Our findings show preferential access areas are a widespread spatial policy tool around the world with the potential, based on the twelve countries for which there is data for 2017, to influence the sustainable development of coastal populations. Our findings also illustrate that current knowledge and understanding of the design, implementation, and impacts of these areas is quite limited, highlighting the need for a research and policy agenda on this topic. Below, we offer some initial thoughts for such an agenda that could be of use to small-scale fishers, workers and their organizations, biodiversity conservation practitioners, marine policy researchers, local and national authorities, and all those tracking the success of SDG14b.
Future design of preferential access areas would benefit from at least the following four areas of research and policy work:
(1) Understanding what are (or have been) the motivations for governments to create preferential access areas. Our analysis of national income levels of the countries designating these areas suggests a concern for securing small-scale fisheries access to ocean space and the coastal or ocean economy, particularly among lower-middle income economies where they are most frequently found. More information on governments’ motivations would help to better understand how these align with policy goals, the policy process for their creation and implementation, and the stakeholders involved in the designation of preferential areas. Finally, it would help to design performance measures for this policy instrument.
(2) Research towards understanding what are the complementarities and overlaps with other area-based policy tools (e.g., other effective area-based conservation measures or OECMs) in coastal-marine environments would help develop better typologies. It would also facilitate an understanding of potential synergies, trade-offs, and redundancies among them and better guide ongoing policy processes for a variety of stakeholders (small-scale fishers themselves, biodiversity conservation practitioners including those working on the 30 × 30 framework, etc.,). Such an understanding could also support consideration of preferential access areas and small-scale fisheries explicitly in marine spatial planning and integrated ocean management processes and, more generally, help to better understand if policy tools allocating access to ocean space are favorable for the sustainable development of small-scale fisheries.
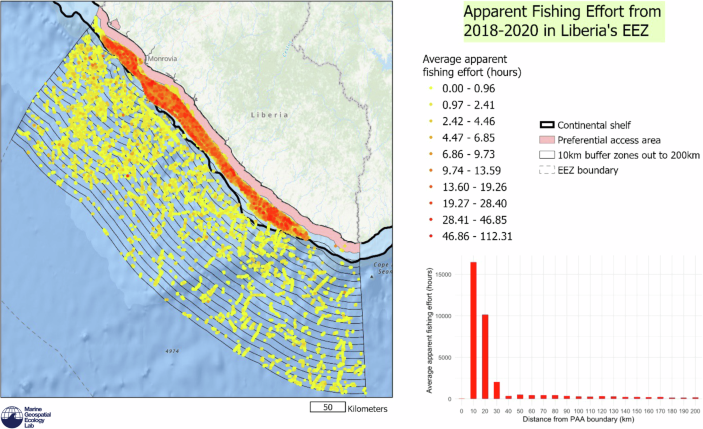
(3) The importance of matching institutional rules related to the governance of a common-pool resource with their ecological characteristics is well known34. Research on this area would allow better understanding for example, why 39% of the small-scale fisheries catch occurs outside of the 12 preferential access areas studied, as well as their potential role in relation to stock status/ecosystem health. At times the spatial scale of the preferential access area may not secure access for some small-scale fisheries to the ocean spaces where they operate and the resources they target. For example, in Liberia’s preferential access area the apparent fishing effort of large-scale fisheries indicates they are “fishing the line,” of the spatially-regulated ocean area35,36 (see Box 1), and potentially targeting the same resources as small-scale fishers operating inside the area.
Research on this topic would provide more clarity on the type of policy processes, stakeholder involvement, and the challenges as well as opportunities needed to align areas’ boundaries with dynamic ecological processes and the needs of small-scale fishers.
(4) We found preferential access areas do not confer rights beyond the rights to access and withdraw fishing resources37. Stronger rights, such as the right of fishers to manage the resources or to exclude users, are found in other policy instruments with jurisdiction in preferential access areas (e.g., catch shares or fishing concessions). Future research in some of the issues mentioned above will also help better understand the suite of user rights that preferential access areas might confer when acting in combination with other existing policy and fisheries management tools, or what new policy and management tools might be needed to complement what is already in place.
Beyond their design, future effective implementation of preferential access areas will need to consider at least two emerging issues: (1) the interactions with other users and (2) the use of geospatial technologies. In terms of interactions with other users, preferential access areas do not secure small-scale fisheries from non-fisheries competing uses of ocean space. Tourism, shipping, aquaculture, oil and gas, or mining activities, among others, will continue to increase in coastal areas13,14. Will they result in the displacement of current users, such as small-scale fishers? How will these interactions affect different stakeholders? How will the assignments of different types of user rights to different activities (e.g., leases of the sea bottom for mining or the water column for aquaculture) interact with user rights conferred by preferential access areas? And how will these issues be governed? Will governments innovate new types of conflict resolution mechanisms to handle these issues? For instance, in some countries like the United States, specialized institutions have been formed in some States to address water-related disputes38. Similarly, the Mekong River Commission’s goal is to address multiple types of uses for the shared space of the river basin, though it has faced challenges in fostering cooperation among all stakeholders39.
The use of geospatial technologies to understand enforcement capacity/effectiveness is likely to increase. Developing clear guidelines governing how data is to be used and shared would increase the legitimacy of this tool across all stakeholders. Publicly available data from Global Fishing Watch on satellite signals sent by vessels using automated information systems (AIS) indicates that enforcement has gaps30. AIS data has been used in the past to measure incursions by prohibited large-scale fishing vessels into African preferential access areas30,40. However, there are global gaps in AIS coverage on large-scale fishing vessels, so the data available is not comprehensive for the apparent fishing effort of large-scale fishing vessels41. Increased availability of synthetic aperture radar (SAR) data may help fill these gaps to some extent13 and provide a clearer picture of enforcement efforts. In addition to emerging applications of SAR image analysis to identify vessels that are not observed in AIS vessel tracking, applications of optical and light tracking (VIIRS) imagery may prove to be useful for detecting smaller vessels and night-time fishing activities. Also, models of potential fishing effort, based on bathymetric, environmental, and distance to port variables, may also prove to be useful for testing hypotheses about potential small-scale versus industrial fishing distributions42,43. More systematic and repeated applications of AIS, SAR, and other monitoring efforts over time could provide useful tools for monitoring the relative long-term effectiveness of preferential access areas in the context of sustainable fisheries management. However, increased legitimacy of this data, particularly within fishing communities, will depend on developing clear and publicly available protocols about how the data is analyzed, shared, and used, along with other related challenges such as the engagement by authorities with small-scale fishers and fishworkers to explain the planned use of the data and other transparency related issues.
Finally, to better understand the impacts of preferential access areas, two future areas of work stand out: the need to (1) better understand the dynamic determinants of biodiversity conservation outcomes in preferential access areas. Small-scale fisheries can have a direct negative impact on fragile ecosystems (e.g., coral reefs and estuaries) or fish stocks when using particular types of fishing gear. Fishers can also become stewards of the environment when incentivized to fish responsibly44. How the relationship between biodiversity conservation efforts and small-scale fishing plays out, and the outcomes it yields for people and coastal ecosystems depends on several factors, including the presence of appropriate fisheries management measures, and how protected areas are established and implemented16, vis-à-vis the establishment and implementation of preferential access areas, among other factors. We come back to this topic in the context of our discussion of preferential stewardship areas.
(2) The majority (57%) of the laws or regulations designating preferential access areas articulate broad goals to which the instrument is intended to contribute, rather than specific goals for preferential access areas that would support clear effectiveness measures. This raises the question of how to understand the effects of designating these ocean areas as preferential for small-scale fisheries. For other spatial policy tools used in the oceans, such as marine protected areas, scholars have measured the processes by which the areas are managed as an input towards outcomes45. Beyond narrow management processes, broader fishery outcomes to which preferential access areas are intended to contribute (e.g., nutrition supply, employment, gender equality, and shared governance), are more challenging to measure, though alternatives have been proposed for data-limited contexts22,46,47. Using causal inference methods to attribute the effects of preferential access areas remains a challenge48.
In closing we offer some thoughts regarding an imaginable future for preferential access areas. Our illustrative analysis of 12 countries suggests that preferential access areas can provide significant benefits to small-scale fisheries. For these countries in average preferential access areas supplied in 2017: 62% of small-scale fishers catch, 77% of their economic value, and 42% of the most nutritious species catch (e.g., herring, sardines, and anchovies). In 2016, for 31 countries, we found preferential access areas supported, on average, 47.8% of all small-scale fishers, all of them fishing for subsistence (Supplementary Table 11). In contrast, preferential access areas do not confer strong user rights to small-scale fishers and fishworkers (e.g., the right to co-manage, Supplemental Fig. 2), or, in and of themselves, ensure sustainable management. However, with well-designed and facilitated participatory processes, these areas could become the basis for the development of a multi-dimensional fisheries management toolbox22, and transition toward preferential stewardship areas (PSAs). These could be areas where small-scale fishers and fishworkers are conferred additional user rights to coastal resources and ocean spaces in exchange for achieving measurable multi-dimensional fisheries management and conservation goals. Preferential stewardship areas would be an allocation of rights at a larger spatial scale than traditionally recognized in territorial use rights fisheries or locally managed marine areas49,50,51. Preferential stewardship areas would become marine-managed areas consistent with definitions of “other effective area-based conservation measures” (OECMs). OECMs have been defined by the Conference of the Parties to the Convention on Biological Diversity as “a geographically defined area other than a Protected Area, which is governed and managed in ways that achieve positive and sustained long-term outcomes for the in-situ conservation of biodiversity, with associated ecosystem functions and services and where applicable, cultural, spiritual, socioeconomic, and other locally relevant values”52. In this context, preferential access areas could count towards meeting commitments to conserve 30% of national areas by 202350, made under the Kunming-Montreal global biodiversity framework under the Convention on Biological Diversity53,54. Such designations would likely require measures of the effectiveness of achieving conservation goals55,56, but the open-ended duration of the area designations would be consistent with OECM requirements to be long-term54. Preferential stewardship area designations could confer property rights to small-scale fishers and fishing communities, including management, exclusion, and/or transferability rights, in ways that could secure community-level benefits, prevent the broadening of inequality among community members, and offer protection or benefits from other encroaching or competing ocean uses such as energy or shipping16.
Shifting toward preferential stewardship areas would require addressing scale mismatches, strengthening shared governance for protection and enforcement, and creating mechanisms to fish responsibly for nutrition security and economic and social development. The end result could constitute more equitable access to wealth in the ocean economy for smallholders and coastal communities and improve stock and ecosystem status while preserving important socio-cultural livelihoods in coastal areas. As governments work to simultaneously meet global policy goals to secure access for small-scale fisheries (SDG 14b) and conserve 30% of the ocean area by 203015, preferential access areas deserve further exploration.
Methods
Development of the preferential access areas (PAAs) global database
The PAA global database was built with data for 44 countries identified by the Illuminating Hidden Harvests (IHH) initiative following Basurto et al.24 and the FAOLEX database (https://www.fao.org/faolex/en/). FAOLEX is a global online repository of national laws, regulations, and policies on fisheries, food, agriculture, and natural resources management. Search strings used to identify PAAs within fisheries and aquaculture FAOLEX documents (title, abstract and body of the document) were: “small scale”, “subsistence”, “artisanal”, or “traditional,” yielded 186 documents of which 65% were deemed non-relevant. Within each policy document, word search focused on keywords such as “mile”, “kilometer”, “fathom”, “meter”, “depth”, “shore”, or “baseline” to identify text describing the dimensions of the PAAs.
The total resulting PAAs identified in this study (n = 63) in 44 countries may be considered a lower bound and not comprehensive, as governments can also establish PAAs via laws or regulations either: (i) not relating to the fisheries sector and categorized elsewhere in the FAOLEX database and hence not searched, or (ii) not reported or captured in it.
Searches on the internet, Web of Science, Google Scholar, and Google News were performed to verify (ground truth) the existence of the PAA beyond our two main sources of data and gather additional information (e.g., date of formation or goals). We used the search strings [country name] + “PAA” or “preferential access area”, or “IEZ”, or “inshore exclusion zone”, or “artisanal fish* zone”, or “small scale fish zone.” Results were sorted for relevance, and for each PAA search, we screened the top 20 journal articles, pieces of gray literature, webpages, and news articles for an upper bound of 5280 hits (i.e., 4 search engines × 66 PAAs × 20 hits).
For each PAA, the following metadata was collected: (a) Specific types of fishing activity prohibited in the policy documents, such as industrial, large-scale commercial fishing, or fishing gear. (b) The stated and type of goals or aims of the policy documents (Supplementary Notes). (c) The type of right devolved to fishers (Supplementary Notes). Whether the rights were conferred by law (de jure), or conferred indirectly through the language used in the policy document (de facto). Rights conferred de jure excluded non-artisanal fishers from the areas reserved for small-scale vessels.
Estimation of fishers’ rights inside PAAs
To estimate the presence or absence of different types of user rights in PAAs, we followed the classification of three different levels of devolution of rights developed by Basurto et al.24 and relied on data from Basurto et al. (forthcoming)22. See Supplementary Table 3 for definitions and Supplementary Notes for the procedure to calculate the percentage of small-scale fisheries catch falling under different levels of devolution of user rights for each studied PAA where data were available.
Estimation of catch, landed value, subsistence, and nutritious species inside PAAs
Small and large-scale fisheries catch data was obtained from Basurto et al. (forthcoming)22. Data on the distance from shore at which small-scale fishers obtain their catches was obtained from FAO-Duke University-WorldFish (2023)1. Using both sources of data enabled estimation of the fraction at which catch, landed value, and nutritious species were sourced inside PAAs. The most important groups in terms of their contribution of six nutrients critical for health are (1) herrings, sardines, anchovies; (2) shad; and (3) scad or mackerel (Supplementary Table 10)33, acknowledging that their nutrient supply contribution within the same species varies according to several factors including geography, local productivity, and others. Estimations of self-consumption or subsistence per country were calculated by Virdin et al.19, and it was assumed that all subsistence fishing took place within preferential access areas. The procedure is fully described in the Supplementary Notes.
Estimation of apparent large-scale fishing effort inside PAAs
For mapping and spatial analysis of the PAAs, a geodatabase of PAA boundaries was created using definition parameters for each PAA (i.e., distance from shore or the baseline, depth, or a given set of coordinates or buffered distances around undersea features). The shoreline used was ESRI’s 2006 global shoreline. Baseline was extracted from Flanders Marine Institute’s (2019) version 11 global EEZ database, defined by ‘Straight Baseline’ features57. Depth data relied on GEBCO 2020. Grid (https://doi.org/10.5285/a29c5465-b138-234d-e053-6c86abc040b9).
Apparent large-scale fishing effort within each PAA country’s EEZ, continental shelf, for the years 2018–2020 and an annual average were calculated using Global Fishing Watch (GFW) gridded fishing effort data (0.01 degrees) from vessels equipped with Automatic Identification Systems (AIS)58. According to the Global Fishing Watch website, the organization “analyzes AIS data collected from vessels that our research has identified as known or possible commercial fishing vessels, and applies a fishing detection algorithm to determine “apparent fishing activity” based on changes in vessel speed and direction. The algorithm classifies each AIS broadcast data point for these vessels as either apparently fishing or not fishing and shows the fishing on the Global Fishing Watch apparent fishing effort heat map.” See: https://globalfishingwatch.org/faqs/difference-between-fishing-effort-and-fishing-events/, https://globalfishingwatch.org/datasets-and-code/fishing-effort/.
The continental shelf was extracted from Harris et al.59 global seafloor geomorphic feature database. The GFW apparent fishing effort data was summed to an annual effort for each data point, the points were filtered to remove any vessel activity within 2 km of anchorages and ports, and then the points for each EEZ containing a PAA were extracted and assigned to being present in the EEZ, PAA, and/or on the continental shelf. The effort for each point across the three years was averaged to get an estimate of fishing effort in each EEZ and apparent incursions in PAAs (Supplementary Fig. 5).
Additionally, the flags of the vessels observed fishing in West African countries (used as illustration) were extracted from the GFW AIS data, and their average effort in PAAs from 2018 to 2020 was calculated (Supplementary Fig. 6). It should be noted that the AIS data does not reflect all fishing effort taking place in these waters and not all observed effort within PAAs is necessarily illegal activity, as each PAA has different regulations on what vessels or activities are permitted within those boundaries.
Responses