A multimodal neural signature of face processing in autism within the fusiform gyrus
Main
Autism is a lifelong neurodevelopmental condition with a prevalence of 1 in 36 children1. Social–communicative differences are among the most prominent features of autistic individuals2. In particular, difficulties with processing social information and faces, such as perceiving and interpreting facial expressions of emotions and other mental states, are thought to have a profound impact on their social functioning and daily living skills3,4. While nonautistic individuals (NAI) appear to develop highly skilled strategies to discriminate facial cues at a very early age, autistic individuals have been reported to acquire less expertise with facial expression recognition5. This has, for example, been attributed to diminished social attention6 and structural and functional differences in brain regions implicated in face processing3,5,7. While individual neuroimaging modalities have separately been used to characterize the neural correlates of face processing, multimodal studies of key regions associated with face processing remain scarce. Illuminating the rich multimodal information shared across different imaging modalities can unravel complex interactions and variations that may only be partially addressed by single modalities8. Specifically, elucidating cross-modal links with regards to face processing in autism will be crucial for understanding the biological mechanisms associated with core social difficulties and paving the way for the development of more personalized support.
The fusiform gyrus (FFG) within the human ventral temporal cortex has been identified as a key neural region associated with higher-order processing of visual stimuli. The necessity for a thorough examination of the FFG in isolation is warranted by its detailed, functional heterogeneity exhibiting a fine-grained topographical organization with distinct category-selective patches9,10 that are differentially specialized for facial recognition (that is, the fusiform face area (FFA))11, body part discrimination12 and object features recognition13. With regards to face processing, the FFA in particular has increased activation during face perception tasks in functional magnetic resonance imaging (fMRI) studies14,15 along with evidence from electroencephalography (EEG) studies showing an event-related potential of negative polarity that peaks at around 170 ms when facial stimuli are presented16,17. Furthermore, face processing is a lateralized cognitive function with right hemisphere dominance across these modalities18,19. An exhaustive examination across different neural signatures of this fine-grained local and hemispheric heterogeneity of the FFG—beyond the FFA—has yet to be conducted in autistic individuals. This can offer valuable new insights in light of reports of atypical functional specialization in autism20,21.
Accumulating evidence suggests that there is atypical neural organization within the FFG in autistic individuals. Many studies show that the FFG is hypoactive during face processing fMRI tasks22,23 and functionally atypically connected24,25 in autism. EEG studies show that the N170 latency is delayed in autistic individuals26,27. Structurally, there are reports of volume increases in right FFG28, a reduction in mean FFG neuron density29 and reversed leftward asymmetry30 in autism. These atypical neural substrates are thought to be functionally relevant in autistic individuals. For example, they have been linked to differences in facial expression recognition5, face memory31, adaptive social functioning27,32 and social symptom difficulties and severity24,31,33,34.
While these individual imaging modalities (that is, structural MRI, task-fMRI, resting-state fMRI (rs-fMRI) and EEG) converge to show atypical involvement of the FFG in face processing and related social functioning in autism, there is still little research into how these different neural substrates jointly inform fine-grained FFG organization and social–communicative functioning in autism. Extracting common information from various modalities is crucial in gaining deeper insights into how brain structure and function reciprocally shape each other and inform behavior, cognition and clinical conditions, such as autism. So far, structure–function coupling has predominantly been addressed via univariate approaches where modalities are combined at the statistical or interpretation level27,35,36. However, only when employing multivariate multimodal approaches can we identify direct relationships between different neurobiological mechanisms and how they scale relative to each other. We can further penetrate across different biological spatial and temporal scales of variation leveraging the unique, complementary aspects covered by each individual imaging modality. Prior multimodal efforts are promising as they show that combining information from brain structure and function significantly increases accuracy in predictive frameworks37,38,39,40,41. Previous research in autism and other clinical populations, such as attention deficit hyperactivity disorder, bipolar disorder and schizophrenia shows that multimodal approaches can both replicate and extend unimodal results to shared pathophysiological processes42 and even outperform unimodal approaches43,44,45. Additionally, a recent study combining different neuroimaging measures of rs-fMRI, diffusion-weighted imaging and structural morphometry specifically showed that resting-state (rs)-connection topographies within the FFG were differentially implicated between autistic and NAI46. While such multimodal endeavors are still scarce in autism, this work specifically underscores the important role of the FFG in the neurobiology of autism. Still, the precise nature and a fine-grained topographical characterization of the multimodal neurobiological interactions within the FFG and their relationship with the broader clinical phenotype related to social functioning in autism remain to be established.
In the present study, our aim was to provide a more comprehensive understanding of the FFG in face processing in autism by elucidating the simultaneous involvement and multivariate interplay of different neural sources. Such analysis requires both large and deeply phenotyped samples, and given the scarce availability, especially in clinical populations, this has previously limited its application. Hence, in this study, we leveraged the unique, large-scale and deeply phenotyped EU–AIMS Longitudinal European Autism Project47,48 (LEAP), which is the largest European multicenter initiative aimed at identifying biomarkers in autism. This dataset provides a rich set of different neuroimaging modalities and cognitive, clinical measures, as well as tasks related to face processing and social and nonsocial functioning. Differences in facial expression recognition in autistic individuals have been established in this dataset5. To further tap into their multimodal neural correlates, we combined two methodological innovations: (1) First, we employed normative modeling49 on each imaging modality separately to derive individual-level deviations from a predicted age-related trajectory. Prior research shows that modeling cortical features as deviations from a normative neurodevelopmental trajectory provides a more sensitive measure to map multimodal signatures in psychopathology37 while also improving predictive performance50. (2) Next, we conducted multimodal fusion through linked independent component analysis (LICA)51 across structural MRI, rs-fMRI, task-fMRI and EEG within the right and left FFG to simultaneously decompose the imaging data into underlying modes that characterize multimodal signatures differentially in autistic and NAI. We further provided a fine-grained characterization of implicated regions, shedding light on the topographic organization within the FFG in autism. We hypothesized that multimodal components, by leveraging joint effects across different biological processes, would be more sensitive to capturing subtle diagnostic effects cross-modally. Consequently, they would outperform unimodal components in discriminating autistic from NAI. Finally, we hypothesized that joint expression across modalities related to the FFG and face processing would specifically inform social functioning in autism.
Results
Sample
For an overview of all methods see Fig. 1. The final sample of autistic (N = 99) and NAI (N = 105) did not differ significantly in sex ratio, age, measures of intellectual functioning, handedness, measures of structural image quality, number of EEG trials or head motion associated with task and rs-fMRI (Table 1).
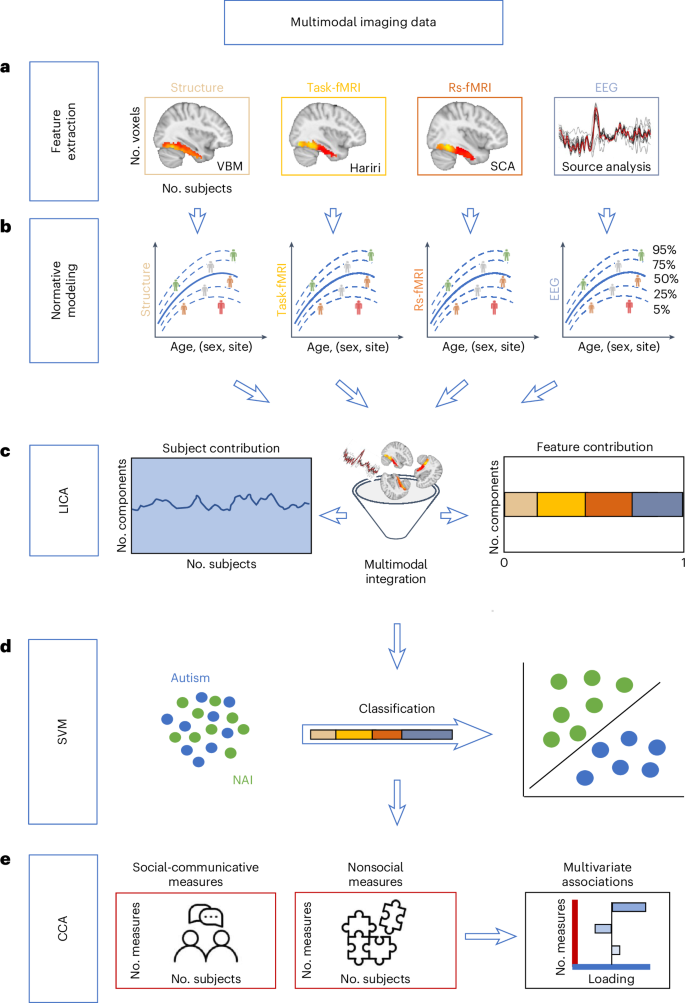
a, The features for each modality were extracted from the right and the left FFG. These were (1) GM volume based on VBM for structural MRI, (2) T-maps contrasting the faces condition to the shapes condition reflecting sensitivity to faces from the Hariri paradigm for task-fMRI, (3) seed-based connectivity analysis (SCA) between the FFA and all other intra-FFG voxels for rs-fMRI and (4) the principal component of source-reconstructed time series for EEG. b, Next, normative modeling was applied to each imaging modality using Bayesian linear regression. The depicted trajectories per modality are schematic and the actual modality-specific normative models are depicted in Extended Data Fig. 1. c, To model cross-subject individual-level variation, resulting Z-deviation maps per modality were statistically merged using LICA resulting in measures of modality contributions and subject loadings. d, Next, we tested for group differences in ICs and group separability using either multi- or unimodal ICs. e, Finally, we computed multivariate associations (that is, CCA) between subject loadings and clinical, cognitive measures related to either social–communicative or nonsocial features.
Unimodal normative models
First, unimodal normative models were estimated. Their accuracy was evaluated using the correlation between the true and the predicted voxel/time point values (Rho), the explained variance (EV), the mean standardized log-loss and standardized mean squared error (Supplementary Fig. 1) and normative models per modality (Extended Data Fig. 1). Evaluation metrics were largely within recommended ranges52 and highly similar when modeling age linearly (Supplementary Fig. 2). When testing for group differences in unimodal features, there were no significant differences in extreme Z deviations between autistic and NAI for any of the eight features (Supplementary Table 1).
LICA
Next, the Z deviations (features) were merged using LICA51. In total, 50 independent components (ICs) were derived across eight different brain feature maps per hemisphere (that is, modalities) (Extended Data Fig. 2). Overall, across these, the right hemisphere (51.7%) and the left hemisphere (48.3%) did not contribute differentially. Single modality contributions were as follows: EEG R (35.0%) > EEG L (33.2%) > rs-fMRI R (11.2%) > rs-fMRI L (9.6%) > task-fMRI R (3.5%) > task-fMRI L (3.4%) > structure L (2.1%) > structure R (2.1%). Supplementary Fig. 3 shows the correlations between the 50-dimensional factorizations (y axis) and 40 (Supplementary Fig. 3a) and 60 (Supplementary Fig. 3b) alternative dimensional factorizations. In line with previous reports53, most components were recovered with high accuracy independently of the order of the factorization.
Group differences
Next, we compared the subject loadings of all (uni- and multimodal) ICs to test for differences between autistic and NAI. Among these, one multimodal IC (44) showed a significant group difference with autistic individuals having higher contributions than NAI (t = 3.5, P value of the false discovery rate (FDR) (PFDR) = 0.027) (Fig. 2b). This remained unchanged when additionally controlling for handedness (t = 3.5, PFDR = 0.028) or when restricting analyses to right-handed individuals only (t = 3.7, PFDR = 0.01). There were no significant group differences in the remaining ICs (Supplementary Table 2) and no IC showed a significant association with handedness (Supplementary Table 3). The results further showed that there were no significant effects of site on group-differential IC44 (site 1: t = 0.37, P = 0.71; site 2: t = 0.1, P = 0.92; site 3: t = −0.78, P = 0.43), nor were there any diagnosis by site effects (diagnosis × site 1: t = 0.96, P = 0.34; diagnosis × site 2: t = 0.76, P = 0.45; diagnosis × site 3: t = 0.1, P = 0.92). The significant multimodal component was not differentially driven by the right (52.8%) or left hemisphere (47.2%) and was associated with several functional modalities (rs-fMRI R (48.5%), rs-fMRI L (35.0%), EEG L (11.6%) and task-fMRI R (3.3%)), and to a smaller extent with gray matter (GM) volume (structure R (1.0%), structure L (0.5%)). Figure 3a depicts the spatial and temporal patterns for each imaging modality within IC44. When further characterizing these in terms of their anatomical and functional overlaps with the Harvard–Oxford atlas (HOA) (Fig. 3k) and the probabilistic functional atlas of human occipito-temporal visual cortex9 (VIS) (Fig. 3f) in the left hemisphere, autistic individuals showed more functional deviations than expected in rs-fMRI connectivity, primarily in retinotopic regions of occipital FFG while, to a smaller extent, also in lower-order face-selective regions (Fig. 3b,g). In the right hemisphere, they showed linked increased deviations in rs-fMRI and structure primarily in higher-order face (mid-lateral fusiform gyrus, mFus, also referred to as FFA-2; posterior lateral fusiform gyrus, pFus, also referred to as FFA-1) and bodies-selective regions of temporal-occipital and occipital FFG (Fig. 3c,h). On the other hand, regions in the left hemisphere where autistic individuals showed linked decreased deviations across structure and rs-fMRI compared with NAI localized to both higher-order face-selective (mFus, pFus) and retinotopic regions of posterior, temporal-occipital and occipital FFG (Fig. 3d,i). In the right hemisphere, these were mostly in higher-order face-selective regions (pFus) across rs-fMRI and task-fMRI and in retinotopic regions across structure in occipital FFG (Fig. 3e,j). Furthermore, autistic individuals showed more left EEG source activation than expected, around 195–203 ms and 417–426 ms, whereas less source activation at 444–449 ms than expected. For further details see Supplementary Table 4.
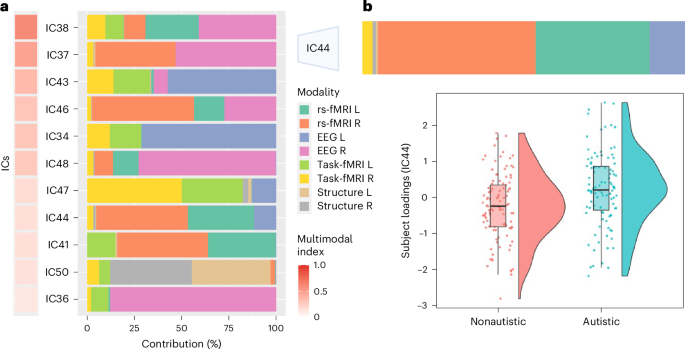
a, Among all ICs, 11 were considered multimodal (Fig. 2a), with a single modality contribution of not more than 90%. b, The violin plots display the distribution of subject loadings (IC44) for autistic and NAI. IC44 showed a significant group difference with autistic individuals (N = 99) having higher contributions than NAI (N = 105). The box plot shows the median and the interquartile range (that is, the 25th and 75th percentiles) with whiskers extending to 1.5 times the interquartile range from the first and third quartiles. L, left; R, right.
Source data
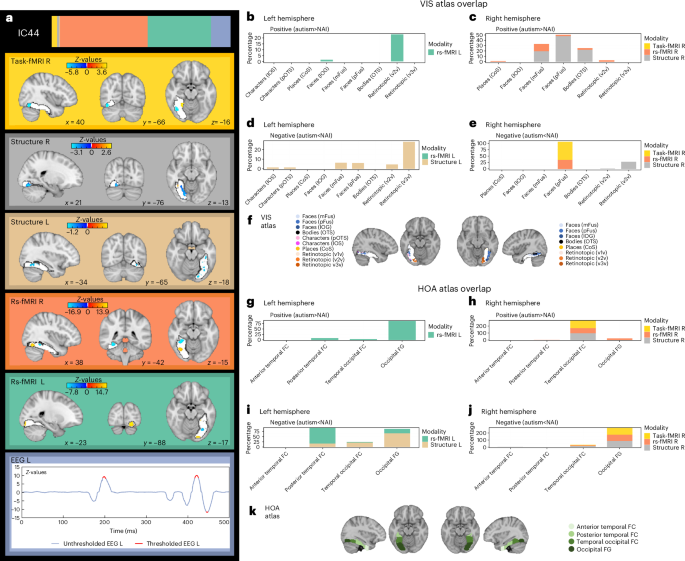
a, The spatial and temporal Z-maps thresholded at the 95th percentile of the different modalities associated with IC44. Positive values (yellow) depict positive loadings onto the IC where autistic individuals have higher deviations than NAI. The negative values (blue) depict negative loadings onto the IC where autistic individuals have lower deviations than NAI. Suprathreshold time points for EEG are depicted in red. b–e, The spatial overlap of suprathreshold voxels with a probabilistic functional atlas of the occipito-temporal cortex (that is, VIS atlas9) for the positive loadings (that is, autism > NAI) (b and c) and negative loadings (that is, autism < NAI) (d and e), for the left (b and d) and right (c and e) hemispheres. f, The VIS atlas and its different category-selective subregions. g–j, The spatial overlap of suprathreshold voxels with the structural HOA (depicted in k) for the positive loadings (g and h) and the negative loadings (i and j), for the left (g and i) and the right (h and j) hemispheres. k, The HOA and its four FFG subregions (that is, anterior and posterior divisions of the temporal FC, temporal-occipital FC and occipital FG. CoS, collateral sulcus; FC, fusiform cortex; IOG, inferior occipital gyrus; IOS, inferior occipital sulcus; OTS, occipital temporal sulcus; pOTS, posterior OTS; VIS, probabilistic functional atlas of the occipito-temporal cortex; R, right; L, left. v1v, v2v, v3v are ventral topographic regions in early visual cortex.
Source data
Multimodal components
For further analyses, we focused on multimodal components only by excluding those that were primarily driven by one imaging modality (that is, with a multimodal index (MMI) below 0.1; Methods and Supplementary Fig. 4) resulting in 11 multimodal ICs (Fig. 2a). Across these multimodal ICs, the right hemisphere (60.0%) contributed more than the left hemisphere (40.0%). Single modality contributions across all multimodal ICs were as follows: EEG R (26.3%) > rs-fMRI R (19.7%) > EEG L (13.9%) > rs-fMRI L (12.1%) > task-fMRI L (9.8%) > task-fMRI R (9.6%) > structure R (4.4%) > structure L (4.2%).
Autism classification
Next, we applied a support vector machine (SVM) to compare the efficacy of unimodal and multimodal ICs in differentiating between the two diagnostic groups. The results showed that multimodal ICs performed significantly better at discriminating autistic from NAI (area under the receiver operating characteristic curve (AUC) unimodal of 0.48, AUC multimodal of 0.64, P < 0.001). This result was confirmed across a range of different multimodality thresholds (Extended Data Fig. 3a) and was not influenced by varying numbers of features between multimodal and unimodal ICs (Extended Data Fig. 3b).
Clinical and cognitive associations
To test for brain–behavior relations, we ran canonical correlation analysis (CCA). This revealed a significant multivariate association between the multimodal ICs and social–communicative features (that is, autism diagnostic observation schedule (ADOS) social affect54, autism diagnostic interview (ADI)-social55, ADI communication, Vineland adaptive behavior scale56 with communication, daily living, socialization subscales, the Reading the Mind in the Eyes Test (RMET)57 and Hariri faces task58,59,60) (r = 0.65, PFDR = 0.008; Fig. 4b). This remained unchanged when additionally controlling for handedness (r = 0.65, PFDR = 0.002) or when restricting analyses to right-handed individuals only (r = 0.66, PFDR = 0.002). On the other hand, the relationship between the multimodal ICs and nonsocial features (that is, ADOS restrictive and repetitive behavior (RRB), ADI RRB, the Repetitive Behavior Scale (RBS)61, the systemizing quotient (SQ)62,63,64 and Hariri shape-matching condition) was not significant (r = 0.45, PFDR = 0.64; Extended Data Fig. 4) pointing to specificity with social-related features of multimodal ICs. These associations remained stable when varying the multimodality threshold (Supplementary Fig. 5). For the significant associations, multimodal IC37 showed the largest contribution on the imaging side followed by IC38, IC44 and IC34 (Fig. 4a,c), whereas ADOS social affect, RMET and Hariri face matching scores showed the largest contribution on the behavioral side (Fig. 4d). The ICs contributing most are depicted in Fig. 4c and Supplementary Figs. 6–8. On average, the right (56.5%) and the left hemisphere (43.5%) did not contribute differentially to these four ICs, which were mostly driven by all functional modalities. Next, imaging patterns correlating with social communication features were characterized in terms of their overlap with anatomical and functional overlaps with the HOA and VIS atlases (Fig. 4e and Supplementary Fig. 9). Especially in higher-order face-selective regions (mFus and pFus) of posterior and temporal-occipital FFG, there were both linked increased deviations in bilateral rs-fMRI and task-fMRI and linked decreased deviations in bilateral structure and right rs-fMRI connectivity. At the same time, particularly in retinotopic regions of occipital FFG, there was more bilateral GM volume along with less right task activation than expected. There were more deviations in right EEG source activation at around 290 ms, while left EEG did not reach significance. These joint imaging patterns were associated with more social difficulties as assessed by the ADOS, ADI and Vineland, and more errors on the RMET, while also with greater accuracy on the Hariri faces task. For more details, see Supplementary Tables 5–8.
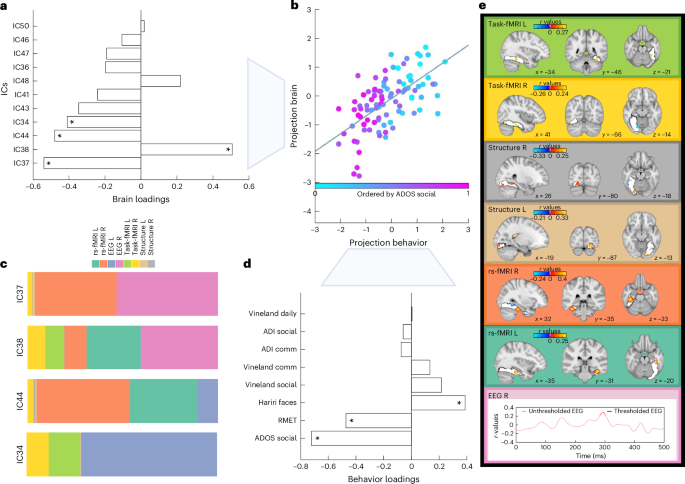
The multivariate association (that is, canonical correlation) was significant between the 11 multimodal ICs and the social–communicative features associated with autism. a, The loadings of each multimodal component contributing to the CCA mode. b, The canonical correlation scatter plot color coded by the highest contributing clinical feature (ADOS social affect). The x axis depicts the projected behavioral CCA variate (projection behavior) and the y axis the multimodal ICs CCA variates (projection brain). c, The modality contributions of the four ICs that contribute significantly to the CCA. d, The loadings of each social–communicative feature contributing to the CCA mode. The asterisks show the significant loadings. e, The spatial and temporal patterns of each imaging modality that are significantly correlated with the social–communicative features. These are based on the significant correlation values between the Z deviations of each imaging modality and the canonical imaging variate derived from the CCA. ADOS social, ADOS social affect subscale; ADI comm, ADI communication subscale; Vineland daily, Vineland daily living skills subscale; Vineland comm, Vineland communication subscale; Vineland soc, Vineland Socialization subscale; R, right; L, left.
Discussion
In the present study, we aimed to characterize the multimodal neural signature of face processing in autism within the FFG, the core region of the face processing network. We identified several ICs that were differentially associated with the four modalities (structure, rs-fMRI, task-fMRI and EEG), hemispheres and functional subdivisions of the FFG. Autism-associated differences in FFG organization were more pronounced when penetrating across multiple rather than single modalities. Furthermore, a set of multimodal ICs was associated with core features related to social but not nonsocial functioning in autism. Taken together, these findings highlight the value of cross-modal analyses in characterizing a key structure in the multilevel neurobiology of autism and its implication in core cognitive and clinical features.
Group differences
Among all components, one multimodal component (that is, IC44) showed a significant difference in subject loadings between autistic and NAI. Overall, the right and left hemispheres did not show differential contributions within this IC and it was associated with all modalities fed into the analysis, with the functional modalities, especially rs-fMRI and EEG, contributing most (Fig. 3). In particular, the overlap with the VIS atlas highlighted that face-selective and retinotopic regions of the FFG were most different between autistic and NAI. More specifically, in the right hemisphere, higher-order face-selective regions exhibited less task activation and FFA connectivity in autistic individuals than expected, primarily in occipital FFG areas (Fig. 3e,j). At the same time autistic individuals showed increased deviations in FFA connectivity primarily in temporal-occipital FFG along with increased GM volume deviations in higher-order face-selective FFG regions (Fig. 3c,h). This strong right-hemisphere involvement of regions associated with FFA across several modalities is in line with reports of increased FFA volume28 and decreased FFA task activation65,66 and FFA connectivity24,67 in autism. Similarly, temporally, autistic individuals showed more increased left deviations around 195 ms, potentially indicative of the consistently reported finding of a slower N170 in autistic individuals26. This has specifically also been shown and extensively characterized in the current sample27. Together these patterns converge to point toward autism-associated differences in face-selective areas of the FFG, at the structural, functional and temporal levels. While these results align with earlier unimodal discoveries, it was previously uncertain whether disparate signals would be separate and independent from each other or coalesce into a joint multimodal expression. Only by employing multimodal approaches are we able to identify the direct links between different neurobiological mechanisms and comprehend how they scale relative to one another while also leveraging the complementary aspects conveyed by each individual imaging modality. In this context, we provide evidence supporting the interconnected nature of distinct signals within a single unified framework.
In the left hemisphere, IC44-related increased deviations in EEG source activation at around 420 ms may indicate reductions in the face N400, which has been associated with familiar face recognition and semantic information68. While in NAI, face processing becomes the most highly developed visual skill, autistic individuals may find social stimuli less rewarding (that is, less socially motivating), resulting in faces potentially conveying greater novelty and thus decreased familiarity69. Furthermore, occipital, retinotopic areas of the left FFG were most implicated as shown by increased functional connectivity deviations between the FFA and retinotopic and lower-order face-selective areas of the FFG in autistic individuals (Fig. 3b,g). This was echoed by less GM volume than expected in left retinotopic areas of FFG in autistic individuals (Fig. 3d,i). Retinotopic early visual areas act as the first stage in a hierarchical network of face processing in which lower-level feature-based components are processed before more complex features in higher-order face-selective regions70. Neural deviations in early visual areas, as seen here, are in line with reports of autistic individuals showing differences in sensory processing at early perceptual stages and have been described at the cognitive level as weak central coherence71. Accordingly, studies show that autistic individuals exhibit a different strategy in processing facial and visual stimuli with a stronger focus on featural, local aspects at the expense of holistic, global information72. Similarly, fMRI studies converge to show greater feature-based perceptual strategies in autistic individuals who primarily tend to recruit object-related regions73,74 when viewing facial stimuli. Taken together, this suggests that the differences we discovered in the left hemisphere point primarily to low-level, bottom-up processing differences, whereas in the right hemisphere they may indicate higher-level atypicalities in the FFA, with a differential involvement across the different structural and functional modalities.
Clinical and cognitive associations
Multimodal ICs showed a significant association with a set of clinical and cognitive features associated with social functioning in autism (Fig. 4). Group-differential IC44 was also among the ICs contributing significantly to these associations. Components loading significantly onto the CCA were mostly driven by functional modalities. Right EEG source activation deviations were around 280–300 ms, potentially indicative of the N250r generated in the FFG75 and associated with the repetition of familiar facial stimuli76. The amplitude of the N250r has been shown to decrease with increasing working memory load77. This suggests that the increased deviations seen here in autistic individuals may reflect differences in degrees of working memory resources allocated to the processing of facial stimuli, which appear more novel and require more attentional effort in autistic individuals. This increased cognitive demand may indicate that the reduced reward response to social stimuli in autism leads to less automatic and more effortful processing of faces69. With regards to the other modalities, increased deviations particularly in higher-order face-selective regions across brain function (task-fMRI and rs-fMRI) while also in lower-order early visual regions across brain structure were associated with more autistic features, such as more social difficulties as assessed by ADOS and lower social sensitivity as assessed by the RMET. Previous unimodal studies showed that the delayed latency of the N170 predicts change in social adaptive behavior in autistic individuals27 (that is, EEG), autistic individuals with low performance on facial emotion recognition have reduced bilateral FFG activation (that is, task-fMRI)5 and that atypical FFA connectivity is associated with increased social symptom severity in autism (that is, rs-fMRI)24. Here, we extend the unimodal results to a multivariate association across a range of social–communicative features that are related to cross-modal signatures within the FFG. Previously, it was unclear whether these separate neural signals contribute independently or jointly to social–communicative features in autism. Our findings provide evidence for an interrelated biological basis of core social functioning in autism and demonstrate that appropriately modeling shared variance across different modalities increases sensitivity to clinical–cognitive features associated with autism78. Remarkably, at the same time, there was no association with a set of nonsocial features, such as repetitive behaviors, pointing to specificity of these multimodal ICs with regards to social functioning.
Summary and implications
Taken together, the multimodal neural signature within the FFG in autism presents differentially across hemispheres, modalities and topography. Specifically, the picture emerges that (1) the functional modalities contribute more than the structural modalities and (2) retinotopic, occipital regions are more implicated in the left hemisphere and higher-order regions are more implicated in the right hemisphere within the FFG when it comes to group differences, but they do not contribute differentially with regards to social functioning. (1) Concurrent neural activity and functional co-expressions (task-fMRI, rs-fMRI and EEG) were strongly tied to social features observed in autistic individuals at present (such as current performance and ADOS assessment). On the other hand, more stable structural aspects of the brain established over time, as well as historical symptoms reported through the ADI and Vineland—which provide insights into past behaviors—had a comparatively smaller impact on the observed association. These results highlight the dynamic nature of the relationship between neural activity and social functioning in autism, underscoring the importance of considering the temporal dimension when investigating the neural correlates of social functioning in autism. Future putative neuroscientifically informed interventions targeting social features may thus benefit from a focus on concurrent neural functioning. (2) Topographically, the FFG is known to exhibit an anterior to posterior gradient with more posterior regions related to lower-order, early visual processing, and more anterior regions related to higher-order processing79. Here, we see the involvement of both retinotopic and higher-order cognitive, particularly face-sensitive, patches. This points to differences in both bottom-up perceptual processes and top-down cognitive information processing in face processing in autism, which can amount to a difference in the face processing strategy employed (for example, more feature based), and which has extensively been described in autism as weak central coherence71. These different processing levels are not differentially implicated across hemispheres in the processing of social information in autism, suggesting that the distinctive face processing strategy in autism transcends right hemisphere dominance of face processing. On the other hand, hemispheric differences are more apparent in the group-differential IC. Teasing apart hemispheric contributions is particularly important in the light of reports of atypical patterns of brain asymmetry in autistic individuals21,34,80. More extreme deviations from a normative model have, for example, been reported in right temporal-occipital fusiform cortex asymmetry in autistic females21, along with more left-lateralized volume in posterior temporal FFG in autistic individuals30,34. Subsequent research should further explore these more nuanced insights revealed by cross-modal analyses pointing to left-lateralized low-level and right-lateralized high-level differences between autistic and NAI.
Strengths and limitations
Integrating data from different modalities has the advantage of being biologically more informative and comprehensive in characterizing a complex, heterogeneous condition, such as autism. Accordingly, when comparing unimodal deviations in each imaging modality, as well as comparing predominantly unimodal ICs between autistic and NAI, there were no significant group differences, despite employing more sensitive individual-level measures derived from normative modeling. Additionally, in line with previous studies43,44,45, multimodal features significantly outperformed unimodal features in differentiating autistic from NAI. As shown, this difference in predictive performance between unimodal and multimodal features is not solely dependent on the quantity of information provided by each modality, but rather on the relevance and complementary nature of the features from different modalities. This suggests that the improvement in classification depends on the specific characteristics and interplay of the features involved. Together, these results confirm our hypothesis and align with previous reports78,81 that appropriately modeling cross-modal variance increases sensitivity to detecting subtle effects that may otherwise be missed. It is important to note, however, that the inclusion of multimodal features does not automatically guarantee superior performance. In certain scenarios, one single modality may suffice, especially when it captures a pronounced biological effect, and adding other modalities could introduce noise rather than biological information. Thus, the superiority of multimodal over unimodal approaches depends on the presence of biologically meaningful, shared information across the modalities. This is particularly relevant for complex cognitive functions, such as face processing, where multiple cellular processes and biophysical changes that manifest across various modalities are involved. These findings further suggest that the discerning signals in this specific brain region are reliably captured through components shared across modalities, emphasizing the multidimensional nature of social functioning associated with autism. Thus, integrating different structural and functional brain measures is among the most promising and powerful methods to achieve substantial advances in our understanding of system-level atypicalities in autism and provides the basis for elucidating mechanisms through which interventions can most efficiently improve clinically relevant functioning78. Furthermore, we combine different innovative methods: LICA is particularly powerful when modeling modalities that are different in their numbers of features, spatial correlations, intensity distributions and units. This is because LICA optimally weighs the contributions of each modality by correcting for the number of effective degrees of freedom and the use of automatic relevance determination priors on components8,51,78. Moreover, by combining normative modeling with LICA, we employ a previously validated approach that has been shown to increase sensitivity in detecting cross-modal effects in clinical populations37.
At the same time, it needs to be pointed out that face processing involves an extended neural network across the whole brain, including other structures such as the amygdala, superior temporal sulcus and occipital and frontal cortex37,74,82,83. It may thus seem too simplistic to reduce face processing to a single brain region. However, the FFG is claimed to be the core node of a distributed face processing network, as substantiated by FFG lesion studies84,85, and its fine-grained functional heterogeneity warrants careful examination in isolation. Additionally, implementing cross-modal analyses presents additional challenges, such as obtaining sufficiently large sample sizes with all participants having available data across all imaging modalities. Here, from a sample of over 600 individuals in the EU–AIMS LEAP dataset, we were able to conduct an analysis in just over 200 individuals who had available imaging data across the four different modalities. Whole-brain analyses based on multivariate techniques will ultimately require larger sample sizes. In the same context, although our prior work suggests that face processing is related to sex-differential factors in autism86, in the current study we did not run sex-stratified analyses owing to the small number of female participants. Future studies with larger sample sizes of both sexes should investigate this further. Furthermore, previous studies have linked handedness with face processing, particularly showing an association between atypical lateralization and left handedness87,88. Owing to the small number of left-handed or ambidextrous individuals in our sample, it is not surprising that we did not find an association with handedness. Still, future research should explore this question in the context of autism. Moreover, there is variability across studies in the task paradigms and comparison stimuli they employ for localizing face processing-related activation. Comparison stimuli vary in the degree to which they resemble living objects or faces (for example, geometrical shapes, houses, scenes, scrambled stimuli and greebles) or in their state (dynamic versus static stimuli). Differences in these stimuli have been shown to produce variability in the extent, strength and patterns of the activation in the FFG89,90. While the localization and peak location of the FFA are relatively unaffected by the specific task and comparison stimuli employed89, it is important to acknowledge that the choice of comparison stimuli is a limitation, which may affect the face specificity of task-based findings. For example, comparison stimuli with face-like features may increase specificity toward face processing. Thus, while future studies should investigate which paradigms and comparison stimuli are most sensitive to elicit autism-related differences in face processing-related FFA activation, we are confident that the functional responses within the FFG observed in our study can be largely attributed to the processing of face-like features. Finally, while both unimodal and more easily implemented behavioral tools, such as eye-tracking, continue to play an important role in the diagnostic process and biological characterization of autism91,92, integrating and supplementing these with multimodal approaches can enhance diagnostic accuracy and offer deeper insights into the multifaceted, biological underpinnings of the condition.
Conclusions
Integrating information from multiple imaging modalities allows us to gain a more holistic and robust understanding of the complex neural processes underlying core clinical and cognitive features associated with autism. The present results suggest that the FFG is a central region differentially implicated across different neural signals and category-selective regions in autistic and NAI and that this cross-modally informs the mechanisms associated with core social functioning in autism. Eventually, elucidating more precise, integrated and individual-level neural associations of core cognitive and clinical features will pave the way for further work identifying stratification, mechanistic and prognostic biomarkers and the development of more personalized support, thereby eventually improving the quality of lives of autistic individuals.
Methods
Sample characterization
Participants were part of the EU–AIMS/AIMS-2-TRIALS LEAP cohort47,48. They underwent comprehensive clinical, cognitive and MRI assessment at one of six collaborating sites. All autistic participants had an existing clinical diagnosis of autism that was confirmed using the combined information of gold-standard diagnostic instruments, the ADI revised55 and the ADOS93,94. The study was approved by the respective research ethics committees at each site (via the Integrated Research Application System; Supplementary Table 9). Informed written consent was obtained from all participants or, for minors or those unable to give informed consent, from a parent or legal guardian. Participants did receive compensation for study visits. Exclusion criteria included the presence of any MRI contraindications (for example, metal implants, braces or claustrophobia) or failure to give informed written consent to MRI scanning, as well as substantial hearing or visual impairments not corrected by glasses or hearing aids. Individuals with an intelligence quotient (IQ) below 50 were excluded. In the autistic group, psychiatric conditions (except for psychosis or bipolar disorder) were allowed, while in the NAI group, parent or self-report of a psychiatric disorder was an exclusion criterion. A history of alcohol and/or substance abuse or dependence in the past year was an exclusion criterion for both groups. Individuals were included if they were on stable medication (at least 8 weeks) at entrance point and over the course of the baseline visit. For further details on the sample and exclusion and inclusion criteria, see Supplementary Methods and our earlier papers47,48. For inclusion and exclusion criteria per modality, see Supplementary Methods and Extended Data Fig. 5. The final sample has both complete imaging data across four different imaging modalities and phenotypic information available consisting of 99 autistic (71 males, 28 females) and 105 NAI (71 males, 34 females) between 7 and 30 years (Table 1). For a distribution of FIQ and handedness, see Supplementary Figs. 10 and 11, for information on the ethnicity of participants, see Supplementary Table 10, and on medication use, see Supplementary Table 11.
Clinical and cognitive measures
We split available autism-associated measures into two sets of feature sets on the basis of the construct they measure (1) social–communicative features comprising measures of difficulties with social communication and daily living skills (that is, ADOS social affect, ADI communication, ADI social, Vineland adaptive behavior scale56 with communication, daily living and socialization subscales), face matching performance (that is, Hariri faces task58,59,60) and social sensitivity to complex emotions (that is, RMET57) and (2) nonsocial features comprising RRBs (that is, ADOS RRB and ADI RRB, the RBS61), systemizing (that is, the SQ62,63,64) and shape-matching performance (that is, Hariri shapes task, as the control condition to the Hariri faces task) (Supplementary Methods and Supplementary Table 12). To tackle missing clinical data and to further avoid reducing the sample size, we used imputed clinical data (derived from Extra Trees regression)95, as in previous work with this dataset41,96.
ROI for FFG
All analyses were restricted to the right and left FFG on the basis of the HOA (Oxford Center for Functional MRI of the Brain) adjusted to have 100% coverage across all individuals for each imaging modality (Supplementary Methods).
Imaging modalities
For MRI and EEG data acquisition parameters and detailed preprocessing steps per modality, see Supplementary Methods and Supplementary Tables 13–14. In summary, the features for subsequent normative modeling were as follows (1) structure: voxel-based morphometry (VBM)-derived, voxel-wise GM volumes, (2) rs-fMRI: seed-based correlation between the FFA and the remaining FFG, (3) task-fMRI: T-contrast maps reflecting sensitivity to faces and (4) EEG: the principal component of source-reconstructed activation obtained across different cortical FFG parcels.
Normative modeling
Normative modeling is an emerging statistical technique that allows parsing heterogeneity by charting variation in brain–behavior mappings relative to a normative range and provides statistical inference at the level of the individual97. The term ‘normative’ should not be seen as incompatible with the neurodiversity framework as it simply refers to statistical norms, such as growth charts, that vary by demographics, such as age and sex. Here, we trained normative models using Bayesian linear regression98 for each brain imaging modality within the right and left FFG region of interest (ROI) independently using age, sex and scanning site as covariates. A B-spline basis expansion of the covariate vector was used to model nonlinear effects of age. Normative models were derived in an unbiased manner across the entire sample under tenfold cross-validation37,49,99. To estimate voxel-wise/time point-wise deviations for each modality in each individual, we derived normative probability maps that quantify the deviation from the normative model summarized in Z-scores. These subject-specific Z-score images provide a statistical estimate of how much each individual’s recorded value differs from the predicted value at each voxel/time point. The accuracy of the normative model was evaluated using the correlation between the recorded and the predicted voxel values (Rho), mean standardized log loss, standardized mean squared error and the EV (Supplementary Fig. 1) as well as based on the forward models (Extended Data Fig. 1). Furthermore, we compared model performance when modeling age linearly (without a B-spline basis expansion; Supplementary Fig. 2). To assess whether autistic and NAI differed in their extreme deviations based on unimodal features, thresholded Z-scores (Z > |2.6| (refs. 21,37,100), corresponding to the 99.5th percentile) were compared between the two groups using a two-sample t-test (Supplementary Methods). Code is available at https://github.com/amarquand/PCNtoolkit.
LICA
To gain more comprehensive insights into cross-modal signatures of face processing, we merged the different individual-level deviations from all imaging modalities (GM volume, FFA connectivity, T-maps contrasting the faces to the shapes condition and the principal components of the source-reconstructed time series) using LICA51 (Supplementary Methods). This is a Bayesian extension of the single modality ICA model, which provides an automatic and simultaneous decomposition of the brain features into ICs that characterize the intersubject brain variability. These multiple decompositions share a mixing matrix (that is, subject course) across individual feature factorizations that reflect the subject contributions to each IC. Here, LICA was used to merge the unthresholded Z-deviation maps derived from normative modeling across the four different imaging modalities within the right and left FFG ROIs. Each measure per hemisphere was treated separately resulting in eight input maps (that is, modalities). Hemispheres were modeled separately given known brain asymmetric differences in autism21,34 and to study the hemispheric contributions and model the different noise characteristics individually. We estimated 50 ICs on the basis of our sample size and following recommendations described in earlier papers37,41,42,53 (that is, sample size ~N/4). To evaluate the robustness of our selected model order (N = 50), we reran LICA using different dimensional factorizations of subject loadings (N = 40 and N = 60) and computed correlations among them.
Group differences
The subject loadings of all ICs were compared between autistic and NAI using a two-sample t-test. Normality and equal variances of subject loadings across the groups were formally tested using the Kolmogorov–Smirnov test and Levene’s test, respectively (Supplementary Table 15). Multiple comparisons were corrected for using the FDR101. ICs showing significant group differences were further characterized by plotting each contributing modality’s spatial map and temporal profile (Z thresholded at the 95th percentile). To further characterize the most implicated regions within the FFG per modality, we computed the overlap between suprathreshold voxels and a structural (that is, the HOA, which covers the entire FFG) and a functional atlas (that is, a probabilistic functional atlas of the occipito-temporal cortex9, which covers category-specific FFG patches) (Supplementary Methods).
Multimodal components
Next, given the current work’s focus on multimodal neural sources, we tested the hypothesis that multimodal components performed superior to unimodal components in differentiating autistic from NAI. For this, we calculated a MMI per IC to quantify the multimodal nature of modalities in each IC42 (Supplementary Methods). The MMI ranges from 0 (equating to 100% unimodal contribution) to 1 (equating to equal contributions from all modalities). Multimodal components were defined as each single imaging modality (that is, regardless of hemisphere) not having more than a 90% contribution to each component and a MMI below 0.1 (Supplementary Fig. 4). Components below this threshold were treated as unimodal.
Autism classification
Next, we implemented two SVM classifiers with a linear kernel—one using unimodal and one using multimodal components as features to test for the added value of multimodal features. The SVM was trained and evaluated using tenfold cross-validation. Class weighting was used to account for group size imbalance. The AUC was used as the performance metric to assess the classifier’s discrimination ability. To test for significant differences in AUC between multimodal and unimodal components, we generated a null distribution of AUC differences by shuffling the cross-validated scores 10,000 times and re-evaluating the classifier performance and computed the likelihood of observing the observed AUC difference under the null hypothesis. To test for robustness of the results, we reran analyses across different thresholds resulting in slightly varying degrees of multimodality ranging between 85% and 99% of single modality contributions. Given that each threshold resulted in a different number of unimodal versus multimodal components, we further checked whether results remained stable when forcing uni- and multimodal components to have the same number of features (Supplementary Methods).
Clinical–cognitive associations
To test for the clinical relevance of multimodal ICs, we ran CCA102 modeling the multivariate relationship between multimodal ICs and cognitive, clinical features related to either (1) social–communicative features related to social functioning and face processing in autism or (2) nonsocial features associated with autism. The statistical significance of the CCA modes was assessed by a complete permutation inference algorithm103, where both brain and behavior data were permuted separately across all participants with 10,000 iterations (Supplementary Methods). To visualize the spatial and temporal patterns of each imaging modality associated with each clinical cognitive measure, we computed the correlations between the original imaging data (that is, the Z-deviation maps) and the canonical imaging variate derived from the CCA104. Significance of correlation maps was assessed with 1,000 permutations, and significant clusters or time points were next visualized and characterized in terms of their functional and anatomical overlap with the VIS atlas9 (Fig. 3f) and the HOA (Fig. 3k and Supplementary Methods). To assess the robustness of CCA results, we set a range of multimodal thresholds between 85% and 99% and selected ICs with modality contributions exceeding this threshold. We then reran the CCA for each threshold to assess stability of results across varying degrees of multimodality.
Reporting summary
Further information on research design is available in the Nature Portfolio Reporting Summary linked to this article.
Responses