A network-based systems genetics framework identifies pathobiology and drug repurposing in Parkinson’s disease
Introduction
Parkinson’s disease (PD) is a devastating and complex neurodegenerative disorder that occurs in around 1% of people over the age of 601. Worldwide, PD has afflicted more than 6.2 million people as of 2015 and is projected to exceed 12 million by 20401. Patients with PD exhibit both motor impairments (e.g., tremors, muscle rigidity and bradykinesia)2,3 and non-motor symptoms (e.g., cognitive impairment, sleep disturbances, anxiety, and depression)4. Current therapeutics primarily aim to alleviate these symptoms and improve quality of life, such as levodopa to boost dopamine (DA) levels5. Despite numerous clinical trials, however, we still lack treatments that slow or stop the disease progression6. With our rapidly expanding growing aging population, there is an urgent need to develop these types of disease-modifying therapies for PD.
Large-scale genome-wide association studies (GWAS) have identified more than 90 independent risk signals for PD across 78 loci, such as SNCA, LRRK2, GBA1 (also known as GBA) and MAPT7. However, the majority of reported GWAS variants resided in non-coding regions with unknown function. Molecular quantitative trait loci (xQTLs), such as expression QTLs (eQTLs), protein QTLs (pQTLs), splicing QTLs (sQTLs), methylation QTLs (meQTLs), and histone acetylation QTLs (haQTLs), are crucial functional genomics tools used in the field to identify genes with high probability of being causally linked to a disease. However, we are still lacking effective approaches to interpret the functional relevance of GWAS loci8,9. Recent advances of network methods and deep learning (DL) show great promise in inferring disease-associated genes and pathways for therapeutic development in Alzheimer’s disease (AD) and other neurodegenerative diseases10,11,12,13,14,15. Therefore, unique integration of the functional effects of non-coding loci via various xQTL elements using network and DL-based models could help with the discovery of potential disease risk genes in ways that lead to identification of new therapeutic approaches, as demonstrated by recent studies16,17,18.
In this study, we present a network-based systems genetics framework to identify potential disease-associated genes for PD from large-scale genetics and xQTL findings (Fig. 1, Methods). Specifically, we leverage non-coding PD loci effects from GWAS across five types of brain-active xQTLs. The fundamental premise of our systems genetics framework is that PD likely risk genes will exhibit distinct functional characteristics compared to non-risk genes, thereby rendering them able to be distinguished by their aggregated xQTL features under the human protein–protein interaction (PPI) network. With this approach, we identified a set of PD-associated genes that are highly expressed (enriched) in well-known PD pathways and likely to represent known drug targets. We then combined network proximity-based drug prediction and large-scale real-world patient data (RWD) validation to identify repurposable drugs (i.e., Simvastatin) for potential prevention or treatment of PD.
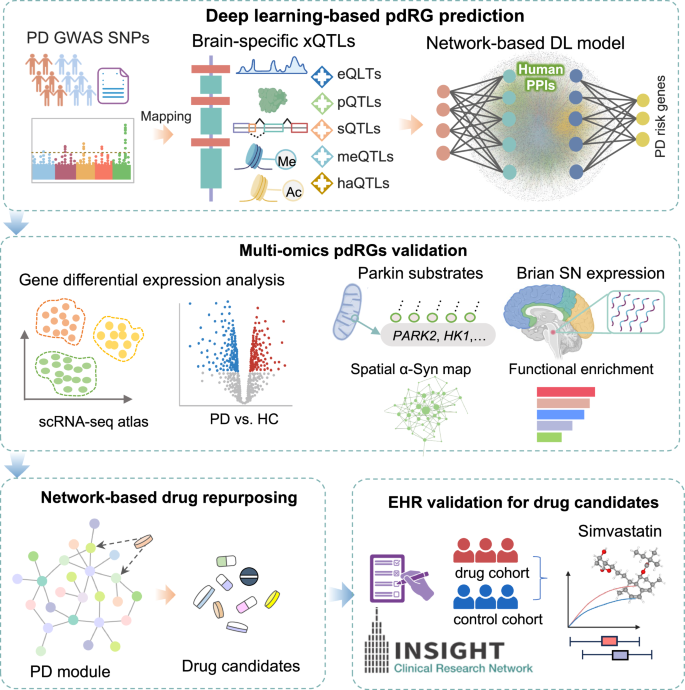
It comprises four major steps: (1) Deep learning (DL)-based PD risk genes (pdRGs) prediction: First, we mapped reported PD GWAS SNPs with five types of molecular xQTLs (including expression, protein, splicing, methylation, and histone acetylation). Then, we applied these xQTL-regulated genes into the network-based DL model to infer pdRGs within human protein–protein interactome; (2) multi-omics validation of the identified pdRGs, including the published single nuclei transcriptome data, Parkin-dependent substrates, alpha-synuclein (α-syn) modifiers, expression patterns in brain substantia nigra (SN) region, functional enrichment, etc.; (3) network proximity-based drug repurposing based on the predicted pdRGs; and (4) Electronic Health Record (EHR) validation of repurposed drug candidates using the INSIGHT database. Images were created by BioRender.com.
Results
A network-based systems genetics framework to infer PD-risk gene
As illustrated in Fig. 1, we applied a network-based deep learning (DL) framework to infer putative PD risk genes (pdRGs) and predict repurposable drugs for PD from genetics and human brain-specific functional genomic findings. It comprises four major steps: (1) Deep learning (DL)-based PD risk genes (pdRGs) prediction. First, we mapped known PD GWAS SNPs with five types of molecular xQTLs (including gene expression, protein expression, splicing, methylation, and histone acetylation) in human brains (Methods). Then, we applied the mapped genes to the network-based DL model to infer pdRGs within the human protein–protein interactome (PPI). Specifically, we clustered PPIs into multiple functional network modules by capturing its topological structures and then quantified a node’s (gene’s) score by integrating its functional similarity with each identified gene with brain-specific xQTL evidence via influencing non-coding loci from PD GWAS loci16; (2) We conducted multi-omics validation of the identified pdRGs, including single-nuclei RNA sequencing (snRNA-seq) data from human PD brains, Parkin-dependent substrates, alpha-synuclein (α-syn) modifiers, brain expression-specificity in human brain substantia nigra (SN) region, and functional pathway enrichment analyses. (3) We performed network proximity-based drug repurposing based on the predicted pdRGs, and (4) further validated top prioritized drug candidates using large-scale Electronic Health Record (EHR) patient data (Methods).
PD GWAS loci are enriched in human brain xQTLs
We assembled two recent large PD GWAS studies7,19 and mapped them to five types of human brain active molecular QTLs, including eQTLs20,21, pQTLs22,23, sQTLs24, meQTLs and haQTLs25 (Methods). As a result, we pinpointed 124 protein-coding genes for subsequent prediction (Fig. 2, Supplementary Table S1 and Supplementary Fig. S1). As depicted in Supplementary Fig. S1A, there are 27,165 pairs between PD GWAS SNPs and eQTL-linked genes (63.38%), followed by haQTLs (10,924, 25.49%), meQTLs (4,697, 10.96%), pQTLs (52, 0.12%), and sQTLs (21, 0.05%). After considering linkage disequilibrium correction (LD, r2 > 0.1, window = 1 Mb), we found that 85 of 124 (~68.5%) mapped genes are linked to lead SNPs (Supplementary Fig. S1B). Figure 2A shows the intersection of gene sets from different xQTL sources. Specifically, GPNMB is associated with all five types of xQTLs (i.e., eQTLs, haQTLs and meQTLs via lead SNP rs858295 [p = 3.83 × 10⁻⁹], and pQTLs and sQTLs via multiple proxy SNPs, such as rs199347 [p = 1.52 × 10⁻⁸, r2 = 0.795])7 (Fig. 3C). Notably, the eQTL effect of rs199347 on GPNMB has been previously reported26, which also exhibited 94% posterior probability of the PD risk. Moreover, three genes were characterized by four types of xQTL evidence, including CTSB (eQTLs, meQTLs, haQTLs and pQTLs), CRHR1 and MAPT (eQTLs, meQTLs, haQTLs and sQTLs). For the well-known PD gene SNCA, we only observed two sources of eQTLs and meQTLs. As for LRRK2, only the eQTL effect was observed. In total, 87, 73, 22, 6 and 6 unique genes were obtained through mapping procedure for eQTLs, meQTLs, meQTLs, sQTLs, and pQTLs sources, respectively. Figure 2B illustrates the distribution of mapped PD GWAS loci (178 pairs between 50 lead SNPs and 85 xQTL-linked genes). We found that SNP variants on chromosome 17 were linked to 18 genes (including MAPT, ARL17A, ARL17B, CRHR1, WNT3, and LRRC37A2). Particularly, many patients with familial frontotemporal dementia with parkinsonism (FTDP) presented mutations in MAPT (microtubule-associated protein tau)27. We also found enrichment for chromosome 4 related to 12 genes, such as SNCA (rs1372518), CD38 (rs4698412). Of note, rs1372518 is a significant variant for Lewy body dementia (LBD) from functional mapping and annotation of genetic associations (FUMA) analysis28. We additionally identified several other key PD risk genes harboring genome wide significant loci, enriched by human brain xQTLs as well, including LRRK2 (rs1491942), GPNMB (rs858295), DGKQ (rs34311866), and TMEM163 (rs6741007). Next, we turned to leverage these human brain-specific xQTL data to infer potential PD risk genes under the human protein–protein interactome model.
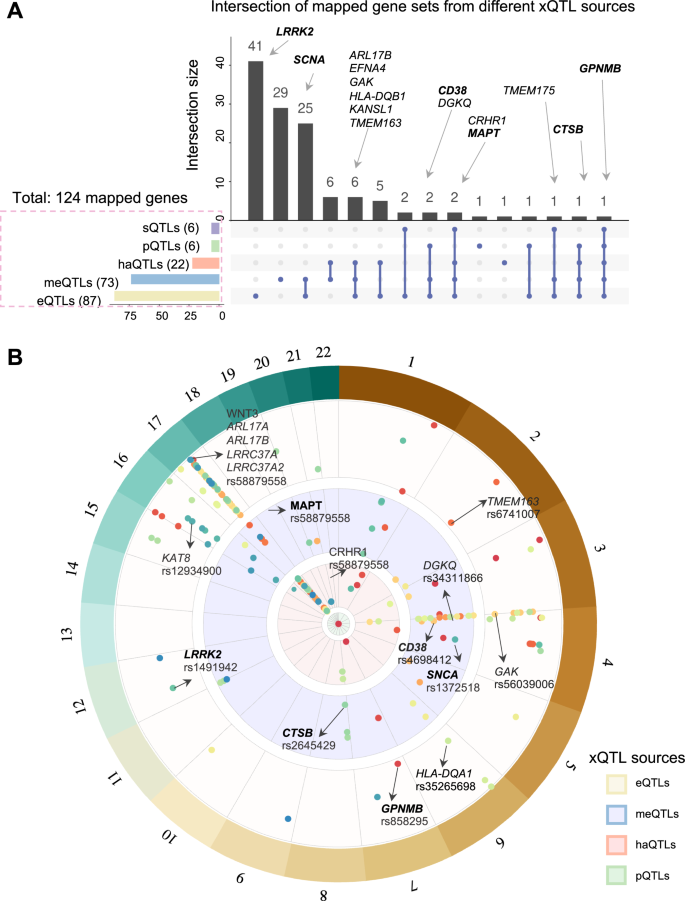
A Upset plot illustrating the intersection of gene sets regulated by different types of xQTLs. The bar plot on the left depicts the size of gene sets linked to each xQTL data, while the bar plot on the top shows the intersection size of gene sets regulated by multiple types of xQTLs. Well-known PD genes are labeled in bold. B Landscape of PD GWAS loci (GRCh37, linkage disequilibrium (LD) clumping r2_cutoff > 0.1) through xQTL mapping, including eQTLs, meQTLs, haQTLs, pQTLs from outside to inside (Methods, Supplementary Table S1).
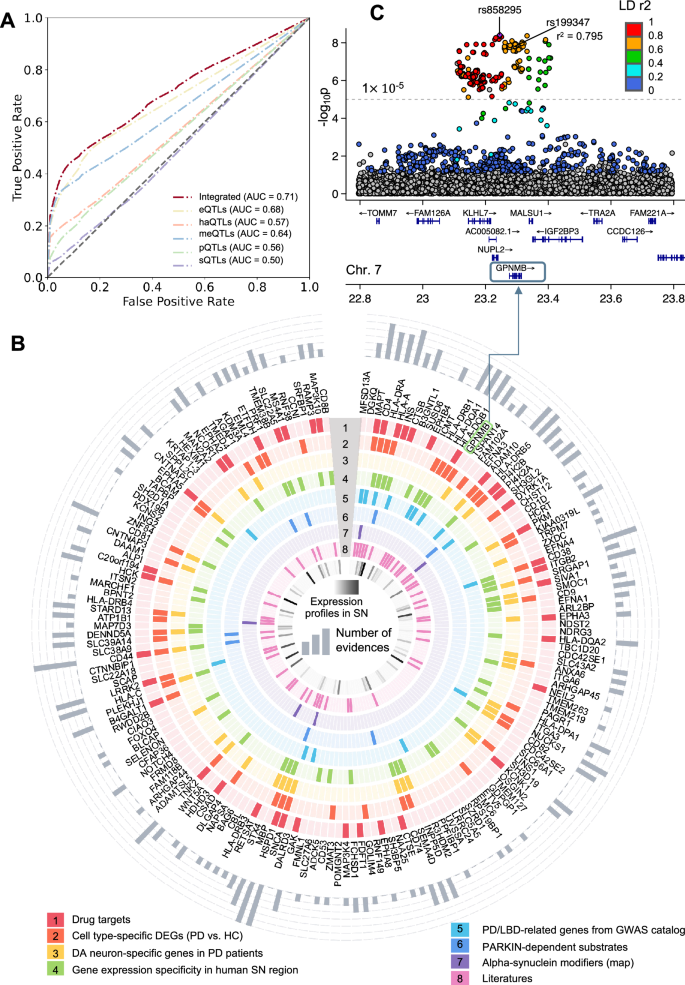
A Model performance (AUCROC) for PD risk gene prediction. The dark red line represents the predicted score for our final model utilizing aggregated xQTL data. The other colored lines depict the respective model performance with single xQTL data. B Circular plot showing eight types of evidence for identified 175 pdRGs, which are displayed clockwise from high to low according to the predicted Z score. Validations are illustrated from outside to inside, including (1) Drug targets; (2) Cell type-specific differentially expressed genes (DEGs, PD vs. HC); (3) DA neuron-specific genes when comparing DA neurons and non-DA cells in PD patients’ brains; (4) Gene expression specificity in human substantia nigra (SN) region (Z > 0); (5) PD/LBD-associated genes from GWAS catalog; (6) Parkin-dependent substrate; (7) alpha-synuclein map; and (8) literatures. Expression profiles of pdRGs in SN are shown in the innermost circle colored by Z score from the GTEx database. The accumulated counts of evidence are plotted in the outermost circle. C Locus zoom plot of the predicted pdRGs GPNMB7 colored by LD r2 (EnsDb.Hsapiens.v75, window_size = 1 Mb).
Network-based prediction of PD likely risk genes
We implemented a network topology-based deep learning (DL) framework within the human protein interactome to test the effects of PD loci and predict disease-associated genes (Methods). First, we employed a network-based self-supervised learning method to classify PPIs into functional subnetwork modules, in which the involved genes share more biological relationships. Next, we inferred likely risk genes by integrating PPI-derived network modules with multimodal analyses of five types of xQTLs implicated by PD GWAS loci. Model performance was further evaluated by comparison with reported genes from the Target Illumination GWAS Analytics (TIGA) database29 (Fig. 3A). The best area under receiver operating characteristic curve (AUROC) was found to be 0.68 for eQTLs and the AUROC was increased to 0.71 after integrating all evidence from five types xQTL data. We utilized this integrated model, identifying 175 genes as putative pdRGs (Supplementary Table S3 and Fig. 3B) encompassing multiple well-known PD risk genes (such as SNCA, GBA, GPNMB, LRRK2, CTSB, and MAPT) as well as other candidate genes (such as MFSD13A, DGKQ, CD4, and HSPD1). These pdRGs are significantly enriched in known PD-associated gene sets (DisGeNET [q = 4.8 ×10⁻⁴]) and other neurodegenerative diseases, including LBD and Dementia in PD (q < 0.05) (Supplementary Table S4 and Fig. S1C).
pdRGs are enriched in PD-related pathobiological pathways
To examine PD pathobiological pathways for pdRGs, we assembled eight types of evidence (Fig. 3B): (1) Known drug targets, (2) Cell type-specific differentially expressed genes (DEGs) between PD and healthy controls (HC) (PD vs. HC) from snRNA-seq data within human substantia nigra (SN), (3) Dopaminergic (DA) neuron-specific genes in PD patients’ brains; (4) Gene expression specificity in SN compared to other brain regions from the GTEx30; (5) Genetics-reported PD/LBD-associated genes from the GWAS catalog database31; (6) Parkin-dependent substrates32, (7) α-syn modifiers33, and (8) Literature-supported PD-associated genes. Together, 113 of 175 (~64.6%) pdRGs exhibited at least one type of evidence associated with PD (bar plot in the outermost circle), such as SNCA, HSPD1 and CD44 (six types of evidence) and MAPT, HLA–A and CD38 (five types of evidence).
PD is characterized by the progressive loss of DA within the SN, a neurotransmitter involved in reward and movement regulation34. We found that pdRGs are more likely to be expressed in SN compared to other brain regions (Fisher’s test, where all genes involved in human protein interactome were used as background35 [p = 0.016], Supplementary Fig. S1D) from the GTEx30. For instance, these SN-specific pdRGs are significantly enriched in interferon gamma signaling [q = 5.75 ×10⁻¹¹], adaptive immune system [q = 5.75 ×10⁻¹¹], and cytokine signaling in immune system [q = 3.41 ×10⁻⁸].
Mutations in PARK2 (encoded the parkin protein) are the most common risk factors for autosomal recessive PD36. It controls mitophagy and programmed cell death via ubiquitination of a variety of proteins (called substrates)37. Interestingly, we found that pdRGs are enriched in parkin-dependent substrates32, including CD44, HLA-A, HSPD1, SLC22A5, SLC39A14, EML4, PI4K2A, and NAA25 (Supplementary Table S5). Modifier of α-syn are also known to play essential roles in PD and LBD38, and we observed pdRGs are enriched in the α-syn modifiers as well (Fisher’s test: [p = 0.047]), including ATP1B1, CBL, MAPT, SH3GL2, and SNCA33. In summary, predicted pdRGs are associated with various PD-related pathobiological pathways, including immune pathways, α-syn modifiers, and parkin-dependent substrates32.
Cell type-specific gene expression of pdRGs in PD
We next examined if the identified pdRGs were differentially expressed in human brains in a cell type-specific manner using a snRNA-seq dataset (Fig. 4 and Supplementary Fig. S1). Removal of low-quality and potential doublets yielded 288,988 nuclei across seven major cell types, including DA neurons, non-DA neurons, astrocytes (Astro), microglia (MG), oligodendrocyte precursor cells (OPC), oligodendrocytes (ODC), and endothelial cells/pericytes/fibroblasts (Endo_Peri_Fib). We then identified 3,158 DEGs (PD vs. HC) across seven cell types (Wilcoxon Rank Sum test: [|log2FC|> 0.25, q < 0.05], Fig. 4B and Supplementary Table S6). We found that pdRGs are more likely to be differentially expressed in human PD brain cells (50 DEGs, Fisher’s test: [p = 2.66 × 10⁻⁶]).
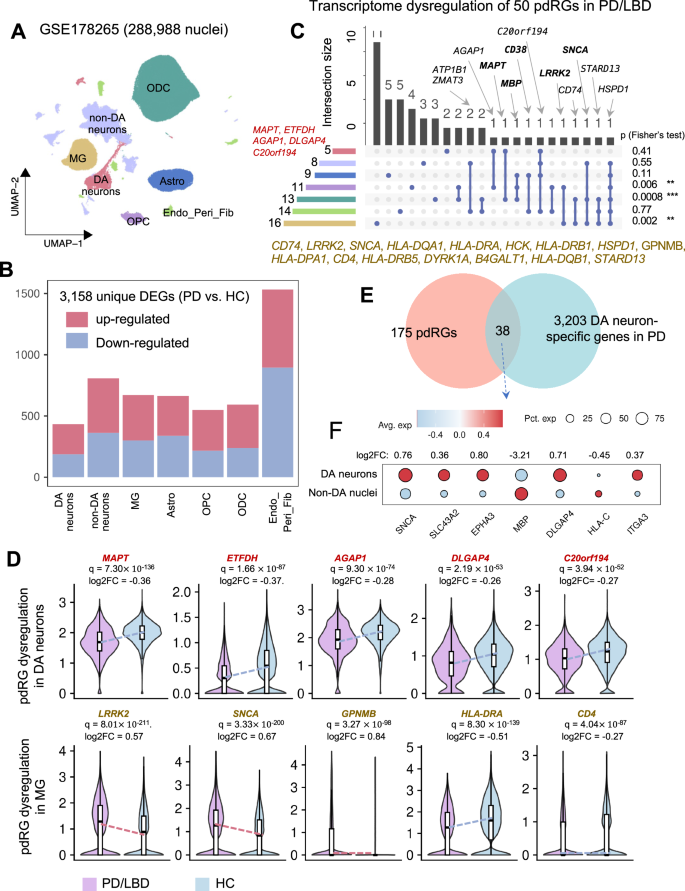
A Uniform manifold approximation and projection (UMAP) embeddings of seven main cell types of 288,988 nuclei from GSE178265, including dopamine neurons (DA neurons), non-DA neurons, astrocytes (Astro), microglia (MG), oligodendrocyte precursor cells (OPC), oligodendrocytes (ODC), endothelial cells/pericytes/fibroblasts (Endo_Peri_Fib). B Stacked bar plot showing the number of cell-type-specific DEGs (PD vs. HC). C Upset plot depicting the transcriptome dysregulation of 50 identified pdRGs, along with fisher’s test results on the left (*p < 0.05, **p < 0.01, ***p < 0.001). The bar plot on the left showed the size of dysregulated pdRGs in different cell types, while the bar plot on the top shows the intersection size of dysregulated pdRG sets observed in multiple cell types. Well-known PD genes are labeled in bold. D Transcriptional expression patterns of selected pdRGs in DA neurons (upper panel) and MG (lower panel). E Venn plot showing the intersection of pdRGs and DA neuron-specific genes in PD patents. F Dot plot of selected seven pdRGs with different expression patterns in DA neurons compared to non-DA nuclei.
As illustrated in Fig. 4C, D, five pdRGs were significantly downregulated in DA neurons, including MAPT, ETFDH, AGAP1, DLGAP4, and C20orf194. Regarding MG, we observed up to 16 differentially expressed pdRGs (i.e., LRRK2, SNCA, GPNMB, HLA-DRA and HLA-DRB1). Beyond DA, there is growing recognition of the microglial function in PD pathogenesis39, such as α-syn-activated microglia40, microglia and neuron interaction41. Specifically, GPNMB was upregulated in MG [q = 3.27 ×10–98, log2FC = 0.84] (Fig. 4D). A GWAS locus of rs199347 was associated with GPNMB through colocalization analyses of eQTL and PD risk loci26. Indeed, GPNMB encodes the transmembrane protein glycoprotein nonmetastatic melanoma protein B and co-immunoprecipitated with α-syn in cells to influence disease progression26. The association of GPNMB and increased risk of PD has also been observed in transcriptome-wide association study (TWAS)42 and Mendelian randomization (MR) analysis43. LRRK2 also showed similar upregulation trends in MG [q = 8.01 ×10–211, log2FC = 0.57]. Multiple pdRGs (such as MAPT, MBP, CD38, LRRK2, and SNCA) are differentially expressed in more than one cell type. For example, HSPD1, encoding heat shock protein family D member 1, is differentially expressed across all six major brain cell types except DA neurons. HSPD1 has been reported as a critical chaperone via regulating proteostasis of α-syn (preventing α-synuclein aggregation) and parkin (involved in mitochondrial protein folding)44. In summary, Fisher’s test supported the observation that the identified pdRGs are significantly enriched in DEGs across MG [p = 0.002], ODC [p = 0.0008] and OPC [p = 0.006]44 from the PD patients’ brains, revealing potential functional roles in PD pathobiology by a cell type-specific manner.
We further compared the gene expression patterns in DA neurons to other brain cell types in PD brains (Fig. 4E, F). We found 38 pdRGs that presented distinct expression [p = 0.02], including SNCA, SLC43A2, MBP, etc. For example, SNCA is more likely to be expressed in DA neurons than non-DA cells [p = 0, log2FC = 0.76]. In total, 64 of 175 pdRGs showed transcriptome changes across multiple cell types in the SN of PD patients.
PD network module identified from the protein–protein interactome
To better understand PD pathogenesis, we further investigated network topology for the proteins encoded by pdRGs within the human protein–protein interactome. After removing self-loops (homodimers) and isolated nodes, the pdRGs formed a disease module comprising 191 edges (PPIs) among 103 nodes (pdRGs) (Fig. 5A) containing several known key genes for PD, such as SNCA, MAPT, LRRK2, and CD3845. For instance, CD38, a key modulator of Nicotinamide Adenine Dinucleotide (NAD) metabolism, is involved in age-related NAD decline and mitochondrial dysfunction46. Indeed, the impairment of the NAD+-mitophagy axis has been recognized as a common course of multiple neurodegenerative diseases47,48,49,50, including AD, PD, Huntington’s disease (HD), and amyotrophic lateral sclerosis (ALS). A recent phase I clinical trial suggested NAD replenishment as a potential neuroprotective therapy for PD51,52. In total, 75 pdRGs involved in this network module were found to be associated with PD (Supplementary Table S6).
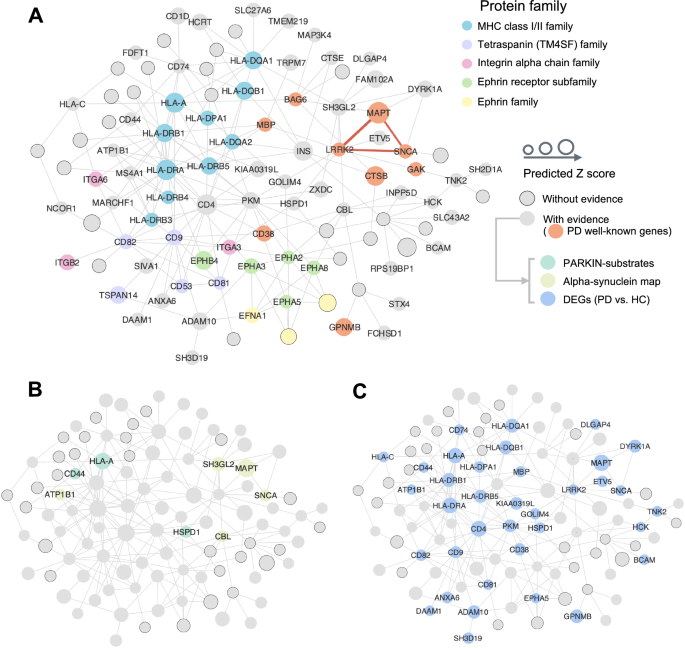
A The overall PD module covering 191 non-isolated PPI pairs (edges) within 103 pdRG-encoded proteins (nodes). All pdRGs with existing evidence are labeled by protein symbol without border (where orange nodes gave well-known PD risk genes), while the size illustrates the predicted score. Parts of nodes were colored by the protein family they belong to. Three well-known pdRGs formed a clique (LRRK2–SNCA–MAPT, red edges in bold). B, C Source of three types of external evidence for pdRGs, including parkin substrates and α-syn network (B) and cell-type specific DEGs (PD vs. healthy control [HC]) (C).
Figure 5B highlighted pdRGs enrichening in parkin-dependent substrates (CD44, HLA–A and HSPD1) and α-syn modifiers (pdRGs, ATP1B1, CBL, SH3GL2, MAPT and SNCA) in the PD network module. Meanwhile, Fig. 5C highlighted 36 pdRGs with significantly changed expression patterns across multiple brain cell types from snRNA-seq data analysis (PD vs. HC). We noted that pyruvate kinase (PKM) played a crucial role in this disease module by interacting with 14 pdRGs. In non-DA neurons, PKM is significantly upregulated in PD patients (log2FC = 0.80, q = 0). A recent study suggested that PKM was destabilized by loss of UCHL1 (also known as PARK5), which mitigates PD-related phenotypes in drosophila and mammalian cells53. Similarly, CD4 (downregulated in MG [q = 4.04(times ,10)-87, log2FC = −0.27]) also kept high connectivity with other pdRGs and was downregulated in MG [log2FC = 0.27]. Notably, a PD mouse model found that CD4 mediated neuroinflammation and neurodegeneration54. Taken together, pdRGs are significantly enriched in various PD-related pathological pathways.
Network proximity-based discovery of candidate drugs for PD
Within the well-established drug-target network35, we found that pdRG-encoded proteins were significantly enriched as druggable targets (41 proteins [~23%, p = 0.009], Fig. 3B). We next prioritized potential repurposable drugs by targeting the protein products of 175 pdRGs (Methods). Here, we calculated network-based proximity scores between pdRGs-encoded proteins and the drug-target network with the human PPI35. Using the following criteria: (1) A stronger network proximity (Z < −3, p.adj.BH [q] <0.05); (2) Existing preclinical and experimental evidence of drugs related to PD; and (3) U.S. Food and Drug Administration (FDA)-approved drugs, we highlighted 12 candidate drugs, including Simvastatin, Fluvastatin, N-Acetylglucosamine, Azathioprine, Riluzole, Clotiazepam, Cyanocobalamin, Bromazepam, Hydroxocobalamin, Lacosamide, Pyridoxine, and Alprazolam (Fig. 6 and Supplementary Table S7). Figure 6A illustrates connections among drugs, targets, and pdRGs. According to the first level of the anatomical therapeutic chemical (ATC) code, these top network proximity-ranked drugs were grouped into seven pharmacological categories. For example, two drugs (Simvastatin and Fluvastatin), are categorized in the cardiovascular system and four drugs (Riluzole, Alprazolam, Bromazepam, and Clotiazepam) in the nervous system. Riluzole is an approved medicine by the FDA for ALS that reduces glutamate release in the brain55. Network-based mechanism-of-action (MOA) analysis showed that Riluzole may interact with four targets (CBL, CD44, KRTAP1-1 and SNCA) encoded by pdRGs (Fig. 4B). Azathioprine, another top-predicted immunosuppressant, is currently in a phase II PD clinical trial (AZA-PD)56 and drug-target network analysis reveals that azathioprine may target multiple protein products of pdRGs, including LRRK2, BAG6, SNCA, HLA-C (Fig. 4C). In summary, these network proximity analyses showed that pdRGs offer potential druggable targets to identify candidate repurposable drugs (i.e., Simvastatin) for PD.
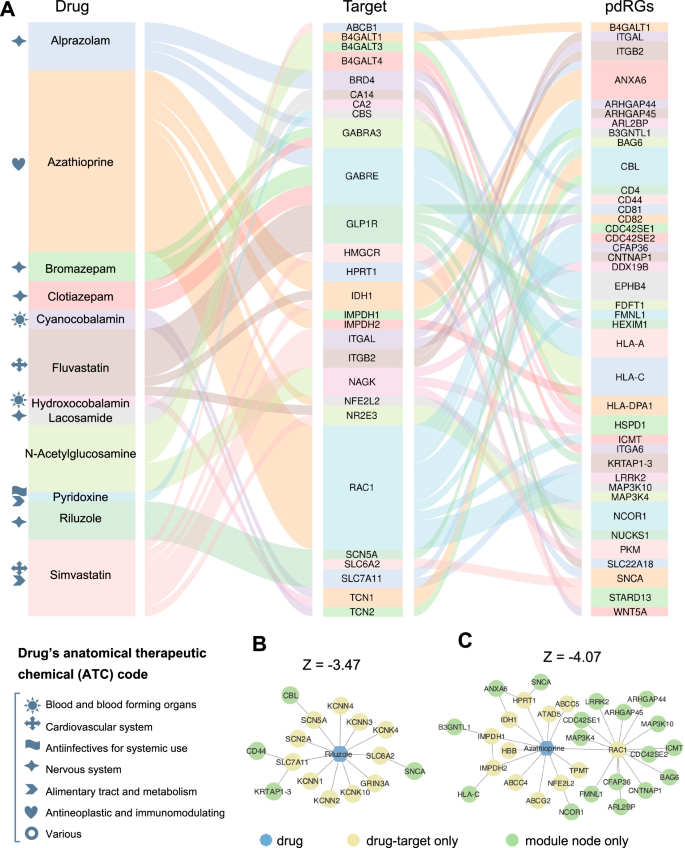
A Sankey plot illustrating targets and pdRGs for prioritized twelve PD drugs (Supplementary Table S7). The gray symbols in front of the drug name characterize the anatomical therapeutic chemical code (ATC). B, C Mechanism-of-actions (MOAs) of two predicted drugs, including Riluzole (B) and Azathioprine (C).
Simvastatin is associated with reduced PD incidence in real-world data
We next sought to evaluate the candidate drug-PD outcome using the large real-world patient EHR data from the INSIGHT dataset. After mapping 12 candidate drugs with patient EHR records, we found that Simvastatin has enough patient records for drug-disease outcome analysis (Fig. 7 and Supplementary Tables S8–10). To adjust for confounding factors, we performed a propensity score matching (PSM) analysis using logistic regression (LR) with ridge penalty (267 covariates). Nearest-neighbor matching (1:1) was applied to construct balanced emulated trials for Simvastatin cohorts (3204 patients [1602 cases and 1602 controls] regarding Fall outcome, and 2890 [1445 cases and 1445 controls] regarding Dementia outcome). We found that Simvastatin was significantly associated with reduced incidence of PD using the Cox proportional hazard model (Fig. 7D and Supplementary Table S10). Specifically, Simvastatin was significantly associated with 12% (95% confidence interval [95% CI: 0.85–0.92, p = 0.002]) reduced PD-related dementia. In addition, Simvastatin was significantly associated with 9% (95% CI: [0.87–0.94, p < 0.001]) reduced risk of fall (secondary outcome). Typically, Simvastatin is used to reduce low-density lipoprotein (LDL) cholesterol synthesis by blocking the enzyme 3-hydroxy-3-methylglutaryl-CoA (HMG-CoA) reductase. Drug-target network analysis shows that Simvastatin directly targets one pdRG-encoded protein ITGB2 (integrin subunit beta 2, previously known as CD18) (Fig. 7D). Indeed, ITGB2 has been reported to have functional roles in neurodegenerative diseases, including PD43,57. Furthermore, Simvastatin also targets the PPI network neighbors of five other proteins encoded by pdRGs of CD4, STARD13, CD82, NCOR1 and ANXA6, revealing potential mechanism-of-actions (MOAs) for PD treatments. Yet, more clinical and experimental validations are warranted to verify Simvastatin’s clinically beneficial effects and to identify its associated MOAs in the future.
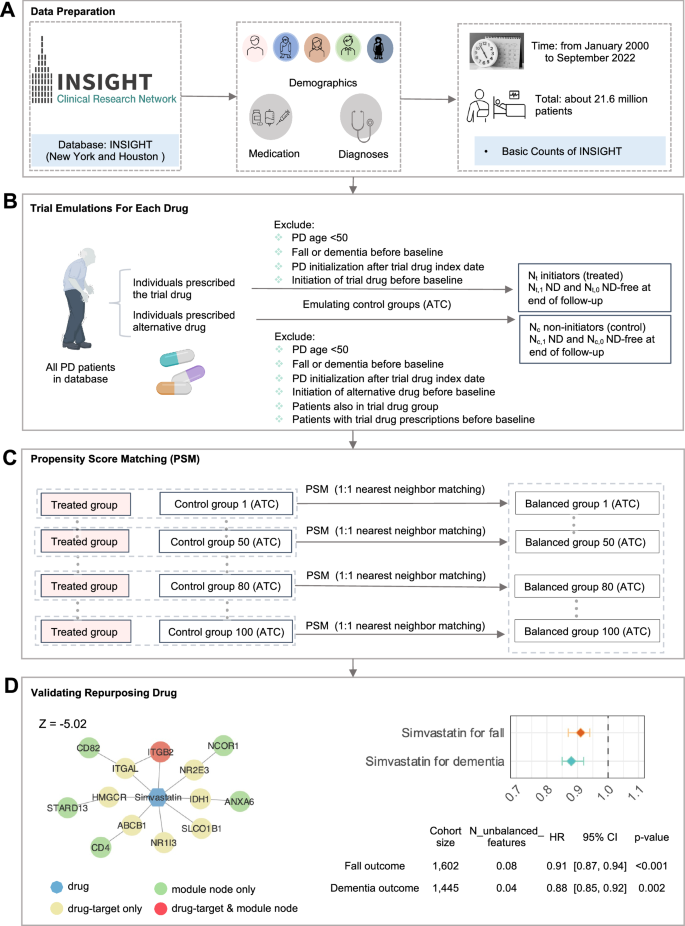
A Basic characteristics of the INSIGHT patient database. B Trial emulation design for each drug with consideration of two kinds of PD outcomes: fall and dementia. C Perform propensity score matching (PSM) to control confounding factors and build balanced trials. D Network-predicted mechanism-of-actions (MOA) for Simvastatin, along with the forest plot of the hazard ratio (HR).
Discussion
PD is a neurological disorder characterized by the classical motor features of parkinsonism associated with loss of dopaminergic neurons in the substantia nigra58,59. Recent studies have also shown that PD is governed by network-associated molecular determinants (termed disease module) of common intermediate endophenotypes5,60. While approaching PD with a direct single-target approach has successfully developed symptomatic therapies, this approach has not achieved disease-modifying or neuroprotective therapies61. Discovery of therapeutic approaches by specifically targeting genetics-informed risk genes is essential for developing disease-modifying treatments for PD60,62. In this study, we presented a network-based deep learning approach from unique integration of PD GWAS loci and human brain-specific functional genomics profiles. The fundamental premise of our network-based framework was that likely risk genes of PD exhibit distinct functional characteristics compared to non-risk genes and, therefore, can be distinguished by their aggregated brain-specific genome wide quantitative trait loci (x-QTLs) features under the human protein–protein interactome network. In totally, we identified 175 putative risk genes for PD (termed pdRGs) via unique integration of existing PD GWAS loci into human brain active eQTLs, pQTLs, sQTLs, meQTLs, and haQTLs. We demonstrated that these predicted PD-associated genes were significantly enriched in multiple PD-related pathobiological pathways: (1) enriched in parkin-dependent substrates and alpha-synuclein (α-syn) modifiers, (2) highly expressed in human brain substantia nigra (SN) region; (3) more likely differentially expressed in human PD brains in cell type-specific manners, including DA neurons; and (4) significantly enriched in literature-reported PD pathways and known drug targets.
A recent study identified a total of 656 target genes of dysregulated cis-regulatory elements (cREs) and genetic risk loci in a cell type-specific manner63, including nine pdRGs of TRPM7, NEIL2, MAPT, TNK2, SNCA, NAA25, TAPBP, KDM3A, EFNA1. Specifically, four pdRGs were observed in DA neurons, including MAPT (cRE ID: chr17:43970936–43973745, GWAS significant peak), TRPM7, NEIL2, TNK2. As for MG, also four pdRGs were found to be related to dysregulated cREs, including SNCA (cRE ID: chr4:90750339-90751275, GWAS significant peak), TRPM7, TAPBP, and KDM3A. Notably, MAPT was observed in multiple cell types (DA neurons, GABA neurons, ODC, OPC, astrocytes), as well as TRPM7 (DA neurons, GABA neurons, ODC, OPC, astrocytes and pericytes).
Using network proximity-based prediction, we identified 12 candidate drugs for potential prevention or treatment of PD. Among the predicted drug candidates, Simvastatin and Fluvastatin belong to the statin class of lipid‐lowering agents. Several preclinical and epidemiological studies support the potential use of statins as prevention and treatment strategies in degenerative disorders through targeting inflammatory and lysosomal signaling pathways64,65,66,67. A recent clinical trial (covering 2841 older adults) found that statin use may reduce the risk of PD65, and a meta-analysis (containing 3,845,303 patients, 8 case-control and 9 cohort studies) also provided evidence for a protective effect of statins in PD, especially atorvastatin67. Notably, one recent randomized phase II clinical trial showed that Simvastatin failed as a disease-modifying therapy in PD68. Yet, only moderate severe PD patients were recruited in this trial (totally 235 participants). Additionally, the lack of ethnic diversity among trial participants limits the generalizability of this trial; 233 of 235 patients in this study (99%) were white68. Although we showed that our network-predicted Simvastatin is associated with reduced risk of PD-related fall or dementia in a large real-world database (Fig. 6), incorporating ethnically diverse participants with early and late PD is warranted to further test Simvastatin as a disease-modifying therapy for PD in the future.
Beyond statins, Riluzole, and Azathioprine, we also highlighted eight other drugs with computational evidence of the potential to slow PD progression (Fig. 6 and Supplementary Fig. S2). Three anti-anxiety drugs (Clotiazepam, Alprazolam, and Bromazepam) were highly ranked and shared similar MOAs. Notably, anxiety is a common non-motor symptom of PD that is experienced by up to 40% of PD patients and a randomized controlled clinical study found that bromazepam is effective for anxiety in PD69. Vitamin B12 (VB12) supplements, including Hydroxocobalamin and Cyanocobalamin, were also identified, and many studies have reported that VB12 level is significantly lower in PD than in healthy people70,71. Interestingly, VB12 modulates LRRK2 kinase activity through allosteric regulation to protect neurons and both VB12 supplements shared similar MOAs. Specifically, they interact with proteins encoded by pdRG CBL (Cbl proto-oncogene), one of the enzymes required for targeting substrates for degradation by the proteasome72. We also identified pyridoxine, which has been shown to promote glutathione synthesis to eliminate oxidative damage to protect DA neurons in a mouse model73, and N-acetyl-glucosamine (O-GlcNAc), which is a sugar-like molecule that can attach to α-syn to affect α-syn clumping74. Lastly, lacosamide also holds promise as a neuroprotective agent in a PD rat model through reducing neuroinflammation and oxidative stress75.
We acknowledge some limitations in the current study. For example, we integrated only two PD-related GWAS studies7,19. The latest GWAS data76 with higher population size should be integrated in the future study. Additionally, we estimated pathogenic scores for known PD GWAS loci based on the CADD-Score and then mapped to five types of xQTL data to re-predict pdRGs (CADD v1.7 with genome reference GRCh37-v1.7)77. We found that the AUROC for the CADD-score based models (PHRED score ≥20) was only 0.52, which is worse than 0.71 in this study (Supplementary Fig. S1F). One possible explanation for the overall low performance of the CADD-based model is the limited number of mapped genes based on existing PD GWAS loci. Other approaches, such as Mendelian Randomization (MR)78 and Transcriptome-Wide Association Study (TWAS)79, can be applied in our future studies as well. Furthermore, the limited number of brain-specific functional genomics datasets, such as pQTLs, and haQTLs, may cause the overall low AUROC in our framework (Fig. 3A). Finally, brain cell type-specific QTLs may also have great potential to improve model accuracy further80,81.
EHR-based drug validation also has certain limitations. First, since the real drug administration data are unavailable, we can only consider whether patients were prescribed the drugs. Although patients may generally adhere to prescriptions, this is not always the case. Second, pharmacoepidemiologic studies may be biased due to unavailable confounding factors (i.e., ethnicity, education level, socioeconomic status) and strategy for addressing the incompleteness of some available confounding factors. For example, missing values related to comorbidities and medications in EHR data may fluence the accuracy of drug-disease outcome analysis as well. Therefore, it is difficult to build causal relationships between drug use and clinical benefits via EHR observation. Computational strategies are an important evolving approach to nominating candidate drugs for treatment of neurodegenerative disorders including PD. Once identified as promising therapies, these candidates can be further interrogated through cellular and animal models to generate support for the likelihood of clinical efficacy and to determine if they should be advanced for assessment in clinical trials82.
Methods
Collection and mapping of PD GWAS and brain-specific xQTL data
We adopted a mapping strategy to obtain GWAS loci linked genes by incorporating five brain-specific regulatory elements. First, we collected 5818 suggestively significant SNPs (p < 1 × 10⁻⁵) from two recent PD-related GWAS studies (one is related to PD risk, study ID: GCST0093257) and another one is related to PD age at onset (AAO), study ID: GCST00778019). Then, we considered five types of brain-specific molecular regulatory elements, including expression, protein, splicing, methylation, and histone acetylation. Specifically, eQTL data is extracted from Sieberts et al.20 (including cortex and cerebellum regions) and Klein et al.21 (including basal ganglia, cerebellum, cortex, hippocampus and spinal cord regions). And pQTL data is from Robins et al.22 and Wingo et al.23, and sQTLs from Qi et al.24, meQTLs and haQTLs from Ng et al.25. Notably, meQTLs give the genetic variants effects on the DNA methylation profiles. As a result, we treated the nearest genes to methylation region as the regulated gene (closest function in bedtools83). Similarly, the nearest gene to peak regions were treated as the haQTL-regulated genes. Second, we mapped PD GWAS SNPs to these five types of xQTLs. Here, we screened only protein-coding genes using ensemble gene reference annotation GRCh37.87 for downstream analysis. Together, we obtained a total of 42,859 pairs between PD GWAS SNPs and xQTL-linked genes (i.e., 124 unique genes, Fig. 2, Supplementary Fig. S1, Supplementary Table S1). When considering LD correction, only 128 independent SNPs can be filtered by LD clumping (plink v1.9, 1000 Genomes [European ancestry], [LD r2_cutoff = 0.1, window size = 1MB]) from these two GWAS studies, contributing to 178 connections between GWAS lead SNPs and xQTL-linked genes (i.e., 85 regulated genes, Fig. 2B). Circular plot of PD GWAS loci regulated by these xQTLs was created by BioCircos v0.3.484 and locus zoom plot for GPNMB locus by locuszoomr v0.2.185.
Collections of known PD-associated genes for model validation
To evaluate model performance, we collected PD-associated genes from the Target Illumination GWAS Analytics (TIGA) database29. This prioritized multiple targets by leveraging gene-trait association with multiple studies and evidence. Here we filtered 127 PD risk genes with meanRankscores >70 (Supplementary Table S2).
Building human protein–protein interactome
Assembling 15 widely used PPI datasets, we built a comprehensive human protein–protein interactome15,16, including (1) binary PPIs validated by high-throughput yeast-two-hybrid (Y2H) system86; (2) kinase-substrate interactions; (3) signaling networks by SignaLink2.087; (4) binary PPIs based on the three-dimensional (3D) structures from Instruct88; (5) protein complexes data (~56,000 candidate interactions) from BioPlex v2.0189; and (6) carefully literature-curated PPIs which are identified by affinity purification followed by mass spectrometry (AP-MS) or literature-derived low-throughput experiments. In total, the established network consists of 351,444 PPIs among 17,706 distinct proteins (https://alzgps.lerner.ccf.org). The largest connected component (LCC) was extract using the igraph v1.5.0, including 336,549 PPIs covering 17,456 proteins.
Network-topology-based PD likely risk gene prediction
To better translate the human genetic findings to pathobiology and therapeutic discovery, Xu et al. proposed a network topology-based DL framework (NETTAG) and applied this in AD16. The preliminary premise of NETTAG is that comparison of risk genes with no-risk genes should reveal distinct functional attributes and thereby distinguish by aggregating genomic features under the human protein interactome, such as eQTLs, enhancers, and CpG islands. In this study, we extended NETTAG16 by incorporating 2nd order neighbors for node representation. This is mainly due to 2 reasons: 1) Previously, we found that nodes and their 2nd order neighbors most likely shared the same gene ontology (GO) annotations16; 2) The PPI contains multiple triangles. This observation indicates that designing graph neural network methods that incorporate higher-order neighbors may not be effective, as higher-order neighbors are often the same as 1st and 2nd order neighbors. This redundancy reduces the value of considering higher-order connections. Thus, we have now extended NETTAG16 by incorporating 2nd order neighbors for node representation as followings,
Here, ({H}^{(i)}) represents the node presentation at layer i. (hat{A}) is the symmetrical normalization of the adjacency matrix A, i.e., (hat{A}={D}^{-1/2}A{D}^{-1/2}), D is the degree matrix. Additionally, we incorporated the jumping knowledge (JK) network90, which was developed to adaptively utilize varying extents of the surrounding network for each node, thereby enhancing the capacity for representations that more fully consider the underlying structure as followings,
Utilizing the mapped xQTL-regulated genes as input, we trained this model based on the well-established human PPI network. In order to improve the stability of prioritized proteins, we ensembled the prediction results from 10 random seeds. Subsequently, we validated them using TIGA findings29.
Transcriptome dysregulation of pdRGs at single-nuclei resolution
To verify transcriptome dysregulation of pdRGs, we utilized one snRNA-seq dataset GSE178265 within the human SN region (GSE178265)91 from ten PD/LBD cases and eight healthy controls (HC). First, we removed low-quality nuclei [nFeature_RNA: 200 ~ 10,000, nCount_RNA: 650 ~ 30000, percent.mt <10, percent.hb <5, percent.ribo <5]. Then, we implemented DoubletFinder v2.0.392 to predict potential heterotypic doublets or triplets. Afterwards, we retained 288,988 high-quality nuclei to explore transcriptome alterations, where the batch effect from different samples was corrected by implementing Harmony v0.1.193. Annotated by canonical marker genes, these nuclei were grouped into seven main clusters, including DA neurons with markers of SLC18A2, SLC6A3 and TH), non-DA neurons (RBFOX3), astrocytes (Astro: AQP4 and GJA1), microglia (MG: C3, P2RY12 and CX3CR1), oligodendrocyte precursor cells (OPC: VCAN and OLIGI), oligodendrocytes (ODC: MOBP and MOG), endothelial cells/pericytes/fibroblasts (Endo_Peri_Fib: CLDN5, FLT1, COL1A2 and MGP) (Fig. 4 and Supplementary Fig. S1D). Cell type specific DEGs (PD vs. HC) were calculated using FindMarkers [Wilcoxon rank sum test: min.pct= 0.01, |log2FC | > 0.25 and p < 0.05]. Furthermore, we explored gene expression patterns by comparing DA neurons and non-DA nuclei in PD patients’ brain (Fig. 4, Supplementary Fig. S1 and Supplementary Table S5). The snRNA-seq analysis was performed in Seurat v4.3.094.
PD/LBD-associated genes from GWAS studies
GWAS studies have accumulated various mutations associated with PD and LBD. The association file (v1.0) was downloaded from GWAS catalog (https://www.ebi.ac.uk/gwas/). Subsequently, we filtered 157 reported genes related PD genes using two keywords “Parkinson” and “Lewy body” with p < 5 × 10⁻⁸.
Gene expression profiles of substantia nigra
In this stage, we evaluated the gene expression specificity of pdRGs in 33 human brain tissues using the RNA-seq data from GTEx database (v8)30. Based on transcript per million counts (TPM), the expression specificity of gene i in tissue t is defined as
where Ei and σi are the mean and standard deviation of the expression of gene i across all considered tissues, respectively. Eit indicates the mean expression of gene i in tissue t. We retrieved highly expressed genes in SN with Z > 0 (Z = 0 if Z < 0, Supplementary Fig. S1).
Construction of pdRGs-induced PPI network for PD
To characterize the interaction patterns among pdRGs, we mapped them with LCC, inducing a PD disease module with 258 edges among 119 nodes. After removing self-loops and isolated edges, the PPI module for PD covered 191 edges (PPIs) among 103 nodes (pdRGs) (Fig. 5). The network was visualized by Cytoscape v3.10.195.
Network-proximity-based drug discovery
Network proximity96 defined a closet distance d(s, t) between disease protein s (s∈S) and drug target t (t∈T) by calculating the average length of shortest path in the human protein–protein interactome as followings,
Subsequently, Z score was applied to quantify the significance of network proximity (i.e., distance) as followings,
Here, ({mu }) and ({sigma },) are the mean and standard deviations of permutation tests (1000 random experiments), which help reduce literature bias associated with well-studied proteins. As a result, we applied Z < −3, adjusted p-value (q) < 0.05 and screened only FDA-approved drugs, and then retained 70 drugs for PD treatment from 2938 candidates.
Real world EHR validation of repurposed PD drugs
To validate drug candidates, we implemented real-world data (RWD) from INSIGHT, containing 15 million patients in the New York City metropolitan area and Hoston (Fig. 7). Use of INSIGHT data was approved by the Institutional Review Board (IRB) of Weill Cornell Medicine under protocol 21-07023759. This included 5,703 fall-diagnosed PD patients and 13,244 dementia-diagnosed PD patients from January 2000 to September 2022.
Eligibility criteria
Patient eligibility criteria for analysis included (Fig. 7):
(1) Patients should have at least one PD diagnosis according to International Classification of Diseases 9th and 10th revision codes (ICD-9/10, Supplementary Table S8), including 332.0 (ICD-9) and G20 (ICD-10).
(2) Patient’s age was >=50 years old at the first PD diagnosis.
(3) Patients who had neurodegenerative disease diagnoses before his/her first PD diagnosis was excluded.
PD outcomes
We considered PD related outcomes including dementia and falls (indicating advanced motor impairment and dyskinesia), which were defined by ICD-9/10 diagnosis codes (Supplementary Table S8). Drug treatment efficiency was defined by reducing the risk to develop the PD outcomes.
Follow-up
Each patient was followed from his/her baseline until the day of the first PD outcome event, or loss to follow-up (censoring), whichever happened first (Supplementary Table S9).
Trial emulation
We first obtained DrugBank ID of each tested drug and translated it to RxNorm and NDC codes using the RxNav API (application programming interface). Drugs which were used by less than 100 patients were excluded for analysis. Following Ozery-Flato et al.97, we defined the PD initiation date of each patient as six months prior to his/her first recorded PD diagnosis event. This accounted for the likelihood that PD may be latently present before formal diagnosis. We defined the index date as the beginning time of treatment of a tested drug candidate or its alternative treatment. We also defined the baseline period as the time interval between the PD initiation date and the index date for each patient. We required that: (1) The index date was later than the PD initiation date. (2) Onset of PD outcomes were later than the index date. Then, for each tested drug, we built an emulated trial using the following procedures:
-
1.
We built its treated group as the eligible PD patients who took the tested drug after PD initiation;
-
2.
We built a control group as:
-
Patients who received alternative treatment of the tested drug, i.e., drugs from a same Anatomical Therapeutic Chemical level 3 [ATC-L3] classification of the tested drug, excluding the drug itself.
-
To control confounding factors, we performed the propensity score matching as described below.
-
Propensity score matching (PSM)
We collected three types of covariates at the baseline period for each patient: 1) We included 64 comorbidities including comorbidities from Chronic Conditions Data Warehouse and other risk factors that were selected by experts98. The comorbidities were defined by a set of ICD-9/10 codes. 2) We considered usage of 200 most prevalent prescribed drug ingredients as covariates in this analysis. These drugs were coded using RXNORM and grouped into major active ingredients using Unified Medical Language System. 3) We also included other covariates, including age, gender, race, and the time from the PD initiation date to the drug index date. In total, we included 267 covariates for analysis, including 2 continuous variables (age and PDToDrug, i.e. the time from the PD diagnosis date to the initiation date of the targeted drug) and 265 binary variables (comorbidities, medications, and gender). There are no missing values for age, PDToDrug, or gender. For the binary variables related to comorbidities (64 variables from ICD-9/10 codes) and medications (200 variables from RXNORM codes), we applied 0 to fill in missing values, indicating that the patient did not have the comorbidity or take the medication.
For each emulated trial, we used a propensity score framework with baseline covariates to balance the treated and control groups99. For each trial, a 1:1 nearest-neighbor matching was performed to build the matched control group99. The covariate balance after propensity score matching was assessed using the absolute standardized mean difference (SMD)100. For each covariate, it was considered balanced if its SMD(le)0.2, and the treated and control group were balanced if only no more than 2% covariates were not balanced101. To enhance robustness of the analysis, we created 100 emulated trials for each tested drug. Tested drugs that had <10 successfully balanced trials were excluded for analysis.
Treatment effect estimation
For each tested drug, we estimated drug treatment effect for each balanced trial by calculating the hazard ratio (HR) using a Cox proportional hazard model102, comparing the risk to develop a specific outcome between the treated and control groups. We reported the median HR with 95% confidence intervals (CI) obtained by bootstrapping103. A hazard ratio <1 indicated the tested drug can reduce risk to develop a specific outcome and a P value < 0.05 was considered as statistically significant. The trial emulation pipeline for treatment effect estimation was implemented using Python packages psmpy v0.3.13104 for propensity score framework and lifelines v0.27105 for the Cox proportional hazard model.
Statistical test
During the multi-omics validation of pdRGs, we applied Fisher’s test to examine whether the proposed pdRGs were significantly enriched in the relevant evidence gene set. We took all genes (~17k) involved in human interactome network as background for this statistic test (significant if p < 0.05). This was executed on an R v4.3.1.
Responses