A noninvasive realtime body position monitoring system for the entire course of tumor radiotherapy

Introduction
Malignant tumors rank as the second leading cause of death, and radiotherapy is the main treatment method for malignant tumors1. Over 70% of cancer patients require radiation therapy, among whom, X-ray-based radiotherapy is the most prevalent. During radiotherapy, setup errors, physiological displacements of organs, and body motion due to patient discomfort can cause radiation to deviate from the clinical target volume (CTV) and planning target volume (PTV), which makes normal tissues receive excess radiation, resulting in radiotherapy-related injuries2,3. Johnson-Hart et al. found that, for lung cancer patients receiving stereotactic ablative radiotherapy (SABR) when the high-dose region shifts a 1 millimeter toward the heart, the risk of death increases 1.262 times4.
In recent years, the use of various image-guided radiotherapy systems has effectively improved the precision of radiotherapy positioning, particularly with the routine application of cone beam computed tomography (CBCT)5,6. Currently, the patient position monitoring techniques during radiotherapy mainly include kilovolt-level X-ray imaging, optical surface tracking, and binocular vision. However, these methods are affected by interference factors such as radiation, accelerator gantry rotation, and thermoplastic body masks. Thus, there is an urgent clinical need to develop a real-time, non-invasive, and radiation-free system for monitoring body position throughout the entire radiotherapy course.
In this study, we developed a non-invasive real-time body position monitoring system for the entire course of tumor radiotherapy, and examined the possible effects of mattress use on computed tomography (CT) imaging and radiation dose using solid water simulation experiments. Lead placement and movement tests were performed on the mattress to verify the accuracy of pressure sensing to monitor the offset of weight. Thoracic and abdominal tumor patients receiving radiotherapy in the supine position were selected as experimental subjects. During radiotherapy, patients wore a thermoplastic body mask and were verified by CBCT before and after radiotherapy, and those with displacement less than 5 mm were categorized as the non-movement group. After radiotherapy, the thermoplastic body mask was removed, and the patients were guided to lie supine on the mattress to do offset movements, and those with a displacement of more than 5 mm were the movement group. The mattress can detect the pressure distribution on the patient’s back in real-time and calculate the position of the center of gravity in both the non-movement and movement groups. Based on the principle of artificial intelligence machine learning, 70% of the position of the center of gravity data is randomly extracted from the non-movement and movement groups respectively to establish a random forest model, and the remaining 30% of the data is used to verify whether the patient position has changed or not, and external data is used for external validation to evaluate the accuracy and robustness of the model.
Results
CT imaging and radiation dose impact test results
The solid water phantoms, as well as those superimposed on the pressure mattress, were scanned using a large-aperture CT (Philips Brilliance™ Big Bore CT) and CBCT, respectively, the parameters of large-aperture CT were 120 kV, 350 mA, and the layer thickness was set to 2 mm, the parameters of CBCT were 120 kV, 20 mA, and the layer thickness was set to 3 mm. The results showed that the hounsfield unit (HU) values of solid water at different locations ranged from 0 to 20, with no artifacts observed. Additionally, the HU values of solid water with the addition of the pressure mattress also ranged from 0 to 20, with no artifacts, indicating that the effect of the pressure mattress on CT imaging was negligible. (see Supplementary Fig. 1).
The effect of the pressure mattress on dose delivery was tested using solid water phantoms under accelerator gantry angles of 0° and 180°, shown in Supplementary Fig. 2 and Supplementary Table 1. Compared to the dose measured after passing through solid water alone, the addition of the pressure mattress resulted in relative dose reductions of 0.68% and 0.72%, respectively, both of which are less than 1%. These findings indicate that the impact of the pressure mattress on dose delivery is negligible.
Accuracy analysis of the positional monitoring system
The accuracy of the mattress measurement was tested using lead blocks, and the results are presented in Supplementary Fig. 3. As the lead block traversed varying distances, the relative error between the software-calculated total trajectory length (LCOP) and the actual travel distance of the lead block remained below 0.1%. Additionally, the relative error between the software-derived trajectory area (SCOP) and the polygon area generated by the centroid positions of the lead block approached zero. These results confirm the high measurement precision of the positional monitoring system.
Data cleaning results
Raw data from the ABC (A: Right scapula, B: Left scapula, C: Sacrococcygeal region) regions of each individual in cohort 1 were aggregated. Logarithmic (log10) transformations were applied to the LCOP and SCOP data, and box plots were constructed (see Supplementary Fig. 4). The box plots showed that the C region had more outliers, and the non – movement groups had significantly more outliers than the movement group. The IQR method was used to exclude these outliers, resulting in final valid datasets of 25,319 samples for the non-movement group and 10,433 samples for the movement group.
Modeling and validation
During the cohort 1 modeling process, the results of testing 1–6 mtry values and 50–500 decision trees are provided in Supplementary Table 2. Considering both computation time and accuracy, a random forest model was established with 3 features and 150 decision trees to determine whether position displacement occurred. The model’s performance, as shown in Supplementary Table 3, includes a precision of 0.9457, indicating high accuracy in predicting true positives, and a recall of 0.9249, demonstrating the model’s effectiveness in identifying most actual positives. The specificity was 0.8978, reflecting the model’s strong ability to correctly classify negatives, and the F1 score was 0.9352, demonstrating a good balance between prediction accuracy and completeness. These metrics collectively indicate that the model has high predictive accuracy. The AUC for the internal test set of cohort 1 was 0.995, approaching 1 (see Fig. 1a). Internal validation results revealed a TPR of 95.5%, an FNR of 4.5%, a TNR of 97.2%, an FPR of 2.8%, and an ACC of 99.5%, indicating that the model has a high predictive accuracy for position displacement (see Supplementary Table 4).

a The AUC of 0.995 for the internal test set of cohort 1. b The AUC of 0.969 for the external validation set from cohort 2.
Using the data from cohort 2, which included 5331 samples from the non-movement group and 2769 samples from the movement group, we performed external validation of the constructed model. The AUC was 0.969 (see Fig. 1b). Validation results show a TPR of 86.1%, an FNR of 13.9%, a TNR of 94.6%, an FPR of 5.4%, and an ACC of 91.6%. These results show that the model also exhibits excellent accuracy and robustness on different radiotherapy machines (see Supplementary Table 5).
Discussion
The effectiveness of tumor radiation therapy is influenced by target area, radiation dose, positioning, and patient motion. Among these factors, precise positioning before radiotherapy and postural motion during radiotherapy are crucial. Existing monitoring devices such as CBCT, kV X-ray imaging, MRI/ultrasound/electromagnetic guided tracking, infrared binocular vision imaging, and optical surface guidance (see Supplementary Table 6) are good solutions for precise localization before radiotherapy. However, there is a lack of means to monitor the patient’s postural motion during radiotherapy, especially the full postural monitoring technique using thermoplastic film to immobilize the patient, which represents a current gap.
With the advancement of radiotherapy techniques, ultra-hypofractionated radiotherapy (UHFRT) and high-dose-rate brachytherapy (HDR-BT) have found clinical applications. In the DESTROY-2 trial7, Deodato et al. performed SRS-VMAT treatment on 227 lesions in 164 patients, demonstrating that single-fraction, high-dose stereotactic body radiation therapy (SBRT/SABR) provides greater benefits to patients compared to the conventional radiotherapy. Bilski et al. compared the dosimetric differences between HDR-BT, CyberKnife-based stereotactic body radiation therapy (SBRTck), and Elekta Versa HD LINAC-based stereotactic body radiation therapy (SBRTe) in the therapy of liver metastases. A comparative analysis was also carried out to evaluate the efficacy of CT-guided interstitial HDR brachytherapy (CT-BRT) and two modalities of stereotactic body radiotherapy (SBRTck and SBRTe) in the treatment of liver oligometastases. The results indicate that HDR-BT has significant advantages in the local ablation treatment of liver malignancies, and CT-BRT can serve as an alternative to SBRT for some patients with liver malignancies8,9.
The development of these novel techniques has led to significant benefits for patients. However, it has also raised the need for more precise tumor localization and effective monitoring of body positional accuracy during treatment.
This study integrates pressure sensor technology with artificial intelligence to develop a contact-based body position monitoring system placed on the patient’s back. This system enables non-invasive, radiation-free, real-time monitoring throughout the entire course of tumor radiotherapy, achieving an accuracy exceeding 90% in detecting patient movement. Additionally, it offers the advantages of ease of use, low cost, and scalability, providing an effective and feasible solution for monitoring positional changes in patients undergoing tumor radiotherapy.
In future work, we plan to enhance the spatial resolution of the pressure mattress and refine the modeling methodologies to further improve monitoring accuracy and discriminative performance. Additionally, we will conduct further research on the distance and direction of patient positional displacement and explore the correlation between this displacement and tumor target volume.
Methods
Design of the pressure mattress positioning monitoring system
As illustrated in Fig. 2a, the stress mattress has a size of 30 × 30 cm and is constructed by bonding two layers of soft PET polyester film (TOYOBO A4100). The 80 rows of conductive (Acheson ED-430SS Silver Ink) and strain-resistive material printed on the upper film intersect with the 80 columns of homogeneous material printed on the lower film, forming 6400 piezoresistive sensitive points. The distance between adjacent sensitive points, which represents the monitoring accuracy, is 3.75 mm. When there is no external pressure, the resistance at the sensitive points is infinite, and when pressure is exerted, the resistance decreases accordingly. The data acquisition unit (STMicroelectronics STM32) calculates the resistance values for each sensitive point based on the Wheatstone Bridge Principle, with a response time of 10 ms, and transmits the data to a computer via Ethernet using the TCP/IP protocol. The computer software calculates the position center of gravity based on the resistance values distributed across the array, and the software also possesses data storage, playback, and analysis capabilities. The main parameters of the mattress position monitoring system are listed in Supplementary Table 7.
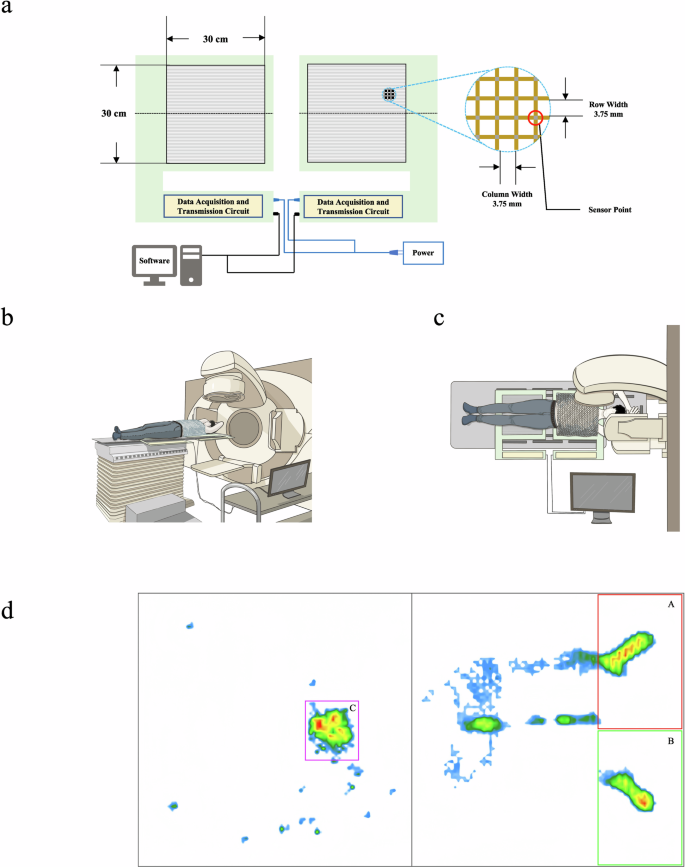
a System structure and pressure-sensitive area diagrams. b, c Lateral and top views of pressure mattress usage during radiotherapy. d Data collection areas on the patient’s back. (A: Right scapula, B: Left scapula, C: Sacrococcygeal region).
The use of the pressure mattress in radiotherapy is shown in Fig. 2b, c. The first mattress is placed adjacent to the headrest, with the second mattress positioned 15 cm away. During radiotherapy, the patient’s head is stabilized by the headrest, and the scapulae are maintained within 10 cm of the mattress’s upper edge. According to the bony parts of the patient’s back in the supine position, the patient’s right scapula (termed “A”), left scapula (termed “B”), and sacrococcygeal (termed “C”) contact areas were selected on the mattress for pressure data acquisition. We selected a 15 × 10 cm acquisition area at each of A and B. However, since the position of the sacrococcygeal part relative to the mattress de-pended on the patient’s height, the acquisition area was selected based on the patient’s actual body size at C. The range of the area was 3 × 3.4 cm–10.9 × 15.4 cm. The acquisition area was kept unchanged for multiple acquisitions of the same patient. Figure 2d shows the pressure distribution of a patient on the mattress.
Testing the impact of the pressure mattress on CT imaging and radiation dose
When considering CT scan positioning and accelerator beam therapy, radiation will pass through the pressure mattress to reach the human body, which requires an examination of the impact of the pressure mattress on CT imaging and radiation dose. We used a large-aperture helical CT (Philips Brilliance™ Big Bore CT) and CBCT to study the effect of the pressure mattress on CT imaging. Using solid water to simulate the human body, a CT scan was performed on the pressure mattress placed between two vertically arranged solid water slabs. We then checked the CT images for artifacts to assess the pressure mattress’s impact on CT imaging. Furthermore, the solid water and pressure mattress were placed on the treatment bed of a linear accelerator (Elekta Infinity), and the X-ray energy was typically set at 6 MeV, and the gantry angles were set to 0° and 180°, respectively. A cylindrical ionization chamber (PTW 0.6 cc) and a dosimeter (PTW UNIDOS E) were used to detect the radiation dose passing through the mattress, and to assess the impact of the pressure mattress on the radiation dose.
Evaluation of pressure mattress monitoring accuracy
When the patient accepts radiotherapy in the supine position, the mattress mainly supports the body through the scapulae and sacrococcygeal region, and these bony parts are subjected to the greatest pressure10. The pressure exerted by the bony parts of the patient’s back on the mattress generates a Center of Pressure (COP), which has a small reciprocal movement along with respiration and organ movements. However, when the patient’s body position is changed, the COP is significantly shifted. The total length of the trajectory (LCOP), and the area of the trajectory (SCOP), formed by the change in COP position are usually applied to assess postural stability in the pressure region, and a shorter LCOP and a smaller SCOP indicate better postural stability11,12.
The monitoring accuracy of the mattress system was verified with the help of a cubic lead block with the center of gravity at the geometric center moving on the mattress. The size of the lead block used in the experiment was 5 × 5 × 8 cm, and its weight was about 1.95 kg. The lead block was randomly moved 1, 5, 10, or 20 cm on the mattress, and the distance moved each time was compared with the LCOP calculated by the analyzing software, at the same time, Origin software was used to fit the COP moving area of the lead block to a polygon (shown as the yellow line in Fig. 3), and the area of the polygon was calculated and compared with the SCOP calculated by the software to verify the monitoring accuracy of the pressure mattress monitoring system.
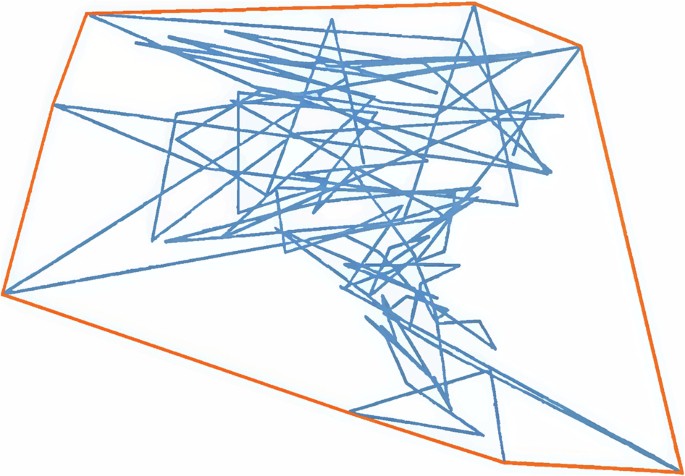
The blue curve represents the real-time trajectory of the COP, while the yellow curve denotes the trajectory polygon fitted using Origin software.
Patient inclusion and clinical data collection
Patients with thoracic and abdominal tumors who were treated with radiation therapy using thermoplastic body masks for fixation and in the supine position at the Hefei Cancer Hospital, Chinese Academy of Sciences, were recruited to participate in a test of the radiotherapy position monitoring system between May 25, 2022, and April 30, 2023. All of them were autonomously conscious, aged between 30 and 88, following CT imaging of the pressure mattresses and radiographic dose testing. The test was divided into two cohorts, cohort 1 was performed on the Elekta infinity linear accelerator, with 209 patients and a cumulative total of 869 radiotherapy treatments, and cohort 2 was performed on the Elekta Axesse linear accelerator, with 42 patients and a cumulative total of 177 radiotherapy treatments. The project was approved by the Ethics Committee of Hefei Cancer Hospital, Chinese Academy of Sciences (Approval number:
PJ-KY2022-006), and all participating patients or their authorized representatives signed informed consent.
During the process of linear accelerator beam therapy, the patient lay supine and wore a thermoplastic body mask, and CBCT was employed to verify the patient’s position before and after radiotherapy. Patients with displacements less than 5 mm are categorized as the non-movement group, and the radiotherapy position monitoring system was used to collect pressure data from the corresponding regions A, B, and C of the patients, the LCOP and SCOP within these three regions were extracted as the non-movement group data. After radiotherapy, the thermoplastic body mask was removed, and the patients were instructed to lie supine on the mattress and perform an offset movement exceeding 5 mm, these patients belong to the movement group, and their LCOP and SCOP within the A, B, and C regions were categorized as the movement group data.
Data cleaning
After data collection for cohort 1 was completed, data cleaning was performed using the Interquartile Range (IQR) method. In this method, Q1 represents the first quartile, and Q3 represents the third quartile. Values between the lower bound (Q1 – kIQR) and the upper bound (Q3 + kIQR) are considered normal and retained, while values outside this range are classified as outliers and removed to improve the model’s accuracy. With k = 1.5, box plots were generated to visualize the data, and outliers in the LCOP or SCOP data were identified and removed based on the discrete points in the box plot13,14.
Modeling and validation
Data modeling and validation for cohort 1 (n = 209) and cohort 2 (n = 42) is shown in Fig. 4. Due to the variation in radiotherapy duration for each patient, data from the non-movement and movement groups were extracted based on each individual’s radiotherapy time. Six feature values were derived from the LCOP and SCOP within the ABC regions to assess positional changes. Positional displacement was coded as 1 (positive) and positional stability as 0 (negative) for the modeling and testing processes. For cohort 1, 70% of the feature values from both the non-movement and movement groups were randomly selected for model training, while the remaining 30% were reserved for internal validation15. Cohort 2 was used for external validation of the model.
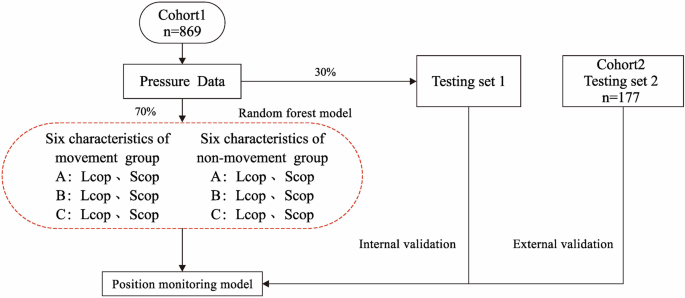
Data modeling for cohort 1 (n = 209) with feature extraction and 70% of data used for training. External validation using cohort 2 (n = 42), applying the model to a separate dataset.
In data modeling, we tested 1–6 mtry values and 50–500 decision trees to build a model, considering both computational time and accuracy to select the optimal number of mtry and decision trees for constructing the random forest model. The model was evaluated using parameters such as Precision, Recall, Specificity, and F1 Score.
The model was validated both internally and externally using ROC analysis. A high AUC value, approaching 1, indicates strong model reliability. Additionally, the positional movement monitoring model was evaluated using metrics such as TPR, FNR, TNR, FPR, and ACC. The respective formulas for these metrics are as follows16:
TP, FN, TN, and FP represent the number of true positives, false negatives, true negatives, and false positives, respectively.
Responses