A novel multigene panel (Sig27) robustly predicts poor prognosis of renal cell carcinoma via high-level associations with immunosuppressive features
Introduction
Kidney cancer is a major malignancy of the urinary system with 431,288 cases diagnosed and 179,368 deaths, ranking 13th worldwide in cancer death in 2020 [1]. Renal cell carcinoma (RCC) constitutes 85% of kidney cancer and consists of 3 major subtypes: clear cell RCC (ccRCC, 80%), papillary RCC (pRCC, 15%), and chromophobe RCC (chRCC, 5%) [2]. ccRCC is the most prevalent and aggressive RCC and has thus been most widely studied. Approximately, 20–40% of ccRCC patients will have disease relapse following curative therapy [3] and 5–10% of patients will develop metastasis [3]. Metastatic ccRCCs are currently managed via immune checkpoint blockade (ICB) therapy and targeted therapies using tyrosine kinase inhibitors to vascular endothelial growth factor receptor (VEGFR) [4]. Targeting VEGFR is based on the well-established loss of the von Hippel-Lindau (VHL) tumor suppressor in ccRCC, which is in part due to chromosome 3p loss [5]. Loss of VHL stabilizes the hypoxia inducible factors (HIF), leading to VEGF upregulation. Even with the relatively rich knowledge of genetics, ICB, and targeted therapies, treatment of metastatic ccRCC remains challenging [4]. One approach to improve ccRCC management is via accurate risk stratification; biomarkers have thus been explored on multiple properties of ccRCC, including gene mutation, the immune checkpoints of PD-1/PD-L1 status, and gene expression [6]. However, none has been developed into clinical application [6].
The management of patients with non-ccRCC (pRCC and chRCC) presents an even greater challenge, largely due to these diseases being substantially under studied. While pRCC incidence is significantly less than ccRCC, pRCC can be aggressive. The recurrence rate of pRCC after surgery is approximately 40% [7]. The current management of pRCC is largely “borrowed” from ccRCC knowledge; for instance, the utilization of sunitinib as the standard of care for metastatic pRCC [8]; as expected, the treatment is with limited benefits [9]. A similar situation occurs in chRCC. Unlike ccRCC and pRCC, chRCC commonly affects young women [10]. Organ-confined chRCC is significantly less aggressive than ccRCC, which does not apply to metastatic chRCC [11, 12]. Approximately 5.7% of patients with localized chRCC developed recurrence in 5 years following surgery and 76.5% of these patients progressed to distant metastases [13]. Treatment options for metastatic chRCC are also extracted from ccRCC [11]. Given the heterogenous outcomes of pRCC and chRCC, accurate risk stratification is also essential for patient management. However, the identification of effective biomarkers for non-ccRCC is challenging, given their rare incidence of disease occurrence.
ccRCC, pRCC, and chRCC are individual RCC subtypes with different genetics. ccRCC is featured with 3p loss and somatic mutations in tumor suppressors residing in the chromosome 3p region: VHL, PBRM1, BAP1, and SETD2 [14]; pRCC has alterations (activation) in the MET (mesenchymal epithelial transition) gene [15] and mutations in the FH (fumarate hydratase) gene [16]; and chRCC is associated with BDH (Birt-Hogg-Dube) syndrome and tuberous sclerosis complex with the respective mutations in the FLCN (folliculin) gene [17] and the TSC1/2 genes [18]. Differences in genetics contribute to the behaviors of ccRCC, pRCC, and chRCC. Nonetheless, we reasoned the existence of common components contributing to poor prognosis of ccRCC, pRCC, and chRCC. This notion is supported by the non-exclusive genetic features among ccRCC, pRCC, and chRCC; the typical mutations in PBRM1, BAP1, and SETD2 in ccRCC also occur in pRCC [19]; mutations in BAP1 were detected in chRCC [20]. Mutations in the TP53 and PTEN tumor suppressor genes are established oncogenic events in ccRCC [21], pRCC [22, 23], and chRCC [24]. Activation of mTOR is a significant event in ccRCC, which is commonly targeted in ccRCC therapy [25], and chRCC [26]. At the cellular level, an immunosuppressive microenvironment contributes to RCC progression. Immunosuppressive tumor microenvironment (TME) is a typical feature of many cancers. In this regard, we recently identified a multigene panel Sig27 from prostate cancer, which clearly contains component relevant to tumor immunity, for instance FPR3 and NOD2 [27]. This feature with the belongingness of prostate cancer and RCC to urogenital cancer implies the utility of Sig27 in predicting prognosis of RCC.
In this research, we report Sig27 as a novel and effective pan-RCC biomarker. Sig27 is highly associated with the immune factors promoting RCC immune evasion, including TAMs (tumor-associated macrophages), regulatory T cells (Tregs), myeloid-derived suppressor cells (MDSC), and multiple immune checkpoints. Collectively, our findings may contribute to the risk stratification of ccRCC, pRCC, and chRCC, offering a promising avenue for the future management of RCC.
Results
Sig27 robustly stratifies poor OS and disease progression in ccRCC, pRCC, and chRCC
The composition of Sig27 component genes is enriched in the pathways relevant to RCC, including cell adhesion, chemotaxis, and autophagy (Supplementary Fig. S1a), suggesting Sig27’s biomarker potential in stratifying RCC risk. To investigate this potential, we retrieved the expression data of all 27 component genes of Sig27 along with relevant clinical data from the TCGA PanCancer Altas cohorts of ccRCC (n = 512), pRCC (n = 283), and chRCC (n = 65). Sig27 risk scores for ccRCC, pRCC, and chRCC were then calculated using individual cohorts based on the formula: ∑(coefi x Geneiexp)n (coefi: Cox coefficient of genei in ccRCC, pRCC, or chRCC, Geneiexp: expression of Genei in ccRCC, pRCC, or chRCC, n = 27). Coefs were derived from ccRCC, pRCC, or chRCC using the multivariate Cox model. Sig27 effectively stratifies the overall survival (OS) probability in the TCGA PanCancer Atlas populations of ccRCC, pRCC, and chRCC with cutoff points estimated by maxstat (Supplementary Fig. S1b–d). Furthermore, Sig27 achieves accurate risk stratification in all three subtypes of RCC with a range of cutoff points estimated by the empirical, kernel, normal, and maxstat methods (Fig. 1a–c). The risk stratification is particularly impressive in chRCC (Fig. 1c; Supplementary Fig. S1d). However, the rareness of chRCC attributed to relatively small population size, which limits Sig27’s biomarker potential in chRCC (see Discussion for details). The effectiveness in risk stratification by prostate cancer-derived Sig27 in ccRCC, pRCC, and chRCC with a range of cutoff points strongly validates Sig27 as a novel and effective biomarker of RCC. This notion is further supported by Sig27’s ability to robustly stratify the progression risk (progression-free survival/PFS) of ccRCC and pRCC via a range of cutoff points (Supplementary Fig. S1e, f).
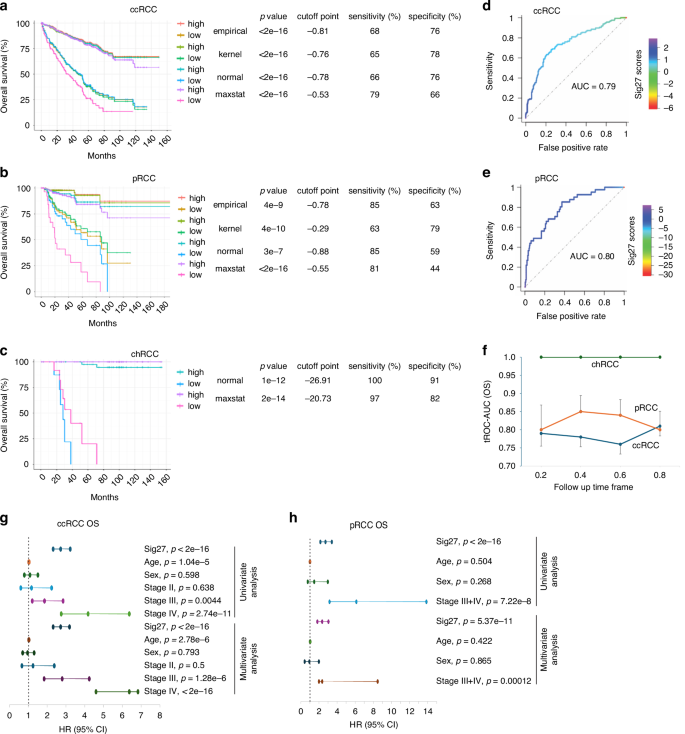
a–c Sig27 risk scores for individual RCCs were calculated; cutoff points towards poor prognosis (fatality) were estimated using the empirical, kernel, normal, maxstat method. Kaplan–Meier survival curves and log-rank test were performed using the R survival package. The relevant p value, cutoff point, sensitivity, and specificity are included. The individual TCGA Pancancer datasets were used in these analyses. Discriminative analysis of Sig27-derived stratification of OS in ccRCC (d) and pRCC (e). f Evaluate the discriminative power of Sig27 towards OS in ccRCC, pRCC, and chRCC using time-dependent ROC. The individual values of area under the curve (AUC) in the indicated follow-up time frame were graphed. Univariate and multivariate Cox analyses of Sig27, age at diagnosis (Age), Sex, and Stage in predicting OS probability in ccRCC (g) and pRCC (h) were performed with the R survival package in the respective TCGA Pancancer cohort. In ccRCC, Stage II, III, and IV tumors are compared to Stage I tumors; in pRCC, Stage III + IV in comparison to Stage I + II; HR hazard ratio, CI confidence interval.
We evaluated Sig27’s discriminative performance in stratifying poor OS and PFS. Sig27 predicts the OS probability of ccRCC and pRCC at ROC (receiver-operating characteristic)-AUC (area under the curve) value of 0.79 and 0.80 respectively (Fig. 1d, e) as well as PFS of ccRCC and pRCC at ROC-AUC value of 0.75 and 0.79 respectively (Supplementary Fig. S1g, h). Additionally, by using time-dependent ROC, we noticed that Sig27 effectively predicts the early poor OS in ccRCC, pRCC, and chRCC (Fig. 1f) and disease progression in all three subtypes of RCC (Supplementary Fig. 1i). Furthermore, Sig27’s biomarker potential is independent of age at diagnosis, sex, and stage in both ccRCC and pRCC (Fig. 1g, h).
We further examined Sig27’s ability to estimate RCC’s OS probability. For ccRCC, we divided the ccRCC PanCancer dataset into 10 groups based on Sig27 risk score, combined those groups with similar fatality risk, and allocated patients into four groups (Fig. 2a). Groups 1–4 have increasing Sig27 risk score and thus elevations of the risk of death (Fig. 2a). Patients in Group 4 have the median survival month (MSM) 19.6 and death rate of 80.4% (Fig. 2a); in comparison, only 3 patients in 102 patients of Group 1 died of ccRCC, which was 2.9% (Fig. 2a). The fatality rates for patients in Group 2 and Group 3 are 26.5% (68/253) and 53.3% (56/102), respectively (Fig. 2a). Sig27 also possesses the similar effectiveness in predicting the OS probability of pRCC patients (Fig. 2b). The death rate and MSM are 58.6% and 19.6 respectively in the high-risk group in comparison to the fatality rate of 2.7% in the low-risk group (Fig. 2b). Taken together, Sig27 can effectively predict the fatality risk of ccRCC and pRCC patients. Considering Sig27 being derived from prostate cancer, its impressive effectiveness in the stratification of ccRCC and pRCC poor prognosis (Fig. 2) may significantly improve the management of ccRCC and pRCC.
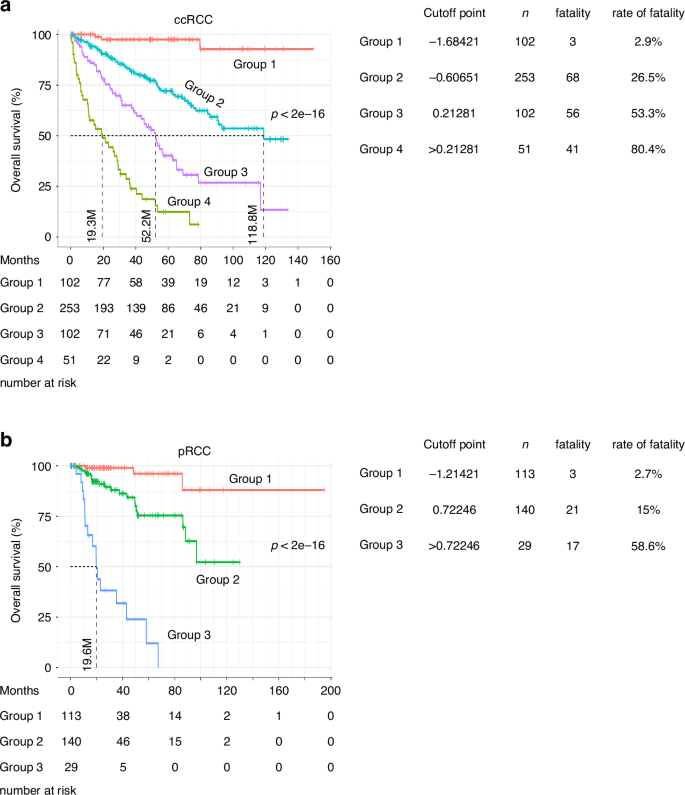
TCGA PanCancer ccRCC and pRCC datasets were divided into four groups (a) and three groups (b) based on Sig27 risk score. The overall survival probability, the number of patients, number of fatalities, and percentage of deaths in individual groups are presented.
The biomarker potential of Sig27 component genes
To characterize Sig27-derived risk stratification in RCCs, we analyzed its individual component genes in predicting RCC risk. In ccRCC, the ccB tumors are associated with poor prognosis compared to ccA ccRCCs [28]. BIRC5, DCST2, LAMP3, MXD3, and PRR7 are upregulated in ccB (Supplementary Fig. S2a). BIRC5, LAMP3, MXD3, and PRR7 along with other 10 genes significantly stratify ccRCCs OS probability (Supplementary Figs. S2b–e, S3). Four (BIRC5, PI15, MCTP1, and ZFHX4) and three (BIRC5, DCST2, and LAMP3) genes predict pRCC’s and chRCC’s OS probabilities respectively as individual genes (Supplementary Fig. S4a, b). BIRC5 effectively stratifies the poor OS of ccRCC, pRCC, chRCC (Supplementary Figs. S2a, S4). BIRC5 or survivin is a well-established anti-apoptotic factor [29]. Its upregulation has recently been reported in ccRCC, pRCC, and chRCC [30]. BIRC5 expression predicts poor OS in ccRCC [31], pRCC [29], and chRCC [32]. Our observations are thus in line with recent publications; however, the biomarker potential of BIRC5 is substantially more robust in our study compared to others, which was likely attributable to differences in cutoff point estimation. Additionally, MXD3 and NOD2 were also reported to predict poor OS in ccRCC [33, 34]. The rest of Sig27 component genes are unknown to RCC.
Differential expression of Sig27 component genes in RCC
Given the largely unexplored nature of Sig27 genes in RCC, we demonstrated more than 2-fold upregulations of PRR7, HAGHL, BIRC5, and MXD3 in pRCC (Supplementary Fig. S5a, b) and HAGHL in chRCC (Supplementary Fig. S5c, d). Besides HAGHL as a common DEG (differentially expressed gene) in both pRCC and chRCC, PLXNA4 and LCN12 were downregulated ≥2 folds in pRCC (Supplementary Fig. S5b), chRCC (Supplementary Fig. S5d), and ccRCC (Supplementary Fig. S6a–d), further supporting common alterations in all 3 subtypes of RCC.
In two large and independent ccRCC cohorts (the TCGA dataset consisting of 533 tumors and 72 kidney tissues, and the Tun-144 cohort containing 72 ccRCC and 72 kidney tissues), FPR3, LAMP3, and NOD2 are among genes upregulated around 2-fold in tumors (Supplementary Fig. S6a–d). In our own cohort, FPR3, TFEC, LAMP3, and LCN12 were upregulated in ccRCC (Supplementary Fig. S6e). FPR3 (formyl peptide receptor 3) and NOD2 are pattern recognition receptors (PRRs) with established roles in immune regulation [35, 36]. LAMP3 (lysosomal associated membrane protein 3) plays a role in antigen presentation in dendritic cells [37], implying Sig27 containing some immune components in RCC.
Wide distributions of Sig27 gene expression in human kidney cells, including immune cells
ccRCC and pRCC are originated from kidney proximal tubule epithelium [38], while chRCC is believed to arise from intercalated cells [39]. Recent efforts in single cell RNA sequencing of human kidney [40] identified immune cell populations, tubule epithelial cells, endothelial cells, intercalated cells, and other cell types (Supplementary Fig. S7a). Using this resource, we observed Sig27 gene expression in a wide range of cell populations in human kidney (Supplementary Table S1); the immune cells (lymphoid and myeloid), proximal tubule (PT), and endothelium are the major kidney cell populations in which Sig27 genes are detected (Supplementary Table S1). Their comparable, if not more, prevalent presence in the immune cells compared to PT cells (Supplementary Table S1) is intriguing, given the likelihood of PT cells as the origin of ccRCC and pRCC [38]. While FPR3 is the most upregulated gene among Sig27 genes in ccRCC (Supplementary Fig. S6a–d), it is not expressed in PT but in the myeloid cells (Supplementary Table S1). Among Sig27 genes, HAGHL is the only one expressed at a high level in intercalated cells (Supplementary Table S1), the origin of chRCC [39]. Given HAGHL unique upregulation in chRCC (Supplementary Fig. S5c, d), its abundant presence in intercalated cells indicates HAGHL being relevant to chRCC.
BIRC5 strongly predicts poor RCC OS (Supplementary Figs. S2b, 4a, 4b). It is only limitedly expressed in human PT (Supplementary Fig. S7b), but its expression is largely in the proliferating proximal tubular epithelial cells (Fig. 3e, Supplementary Table S1). While TFEC is not apparently upregulated in ccRCC (Supplementary Fig. S6c, d), it is most abundantly expressed in PT among Sig27 genes (Fig. 3c; Supplementary Table S1; Supplementary Fig. S7f). We detected a major expression of FAM65B (also known as RIPOR2) in the lymphoid and myeloid cells (Fig. 3a; Supplementary Table S1; Supplementary Fig. S7c) and LTC4S in the endothelium (Fig. 3b; Supplementary Table 1; Supplementary Fig. S7e). While the long non-coding RNA LINC01089 displays a wide expression pattern in human kidney (Supplementary Table S1; Supplementary Fig. S7d), it is the only gene among Sig27 genes with a clear presence in epithelial progenitor cells (Fig. 3d; Supplementary Table S1). Collectively, the above evidence suggests the presence of Sig27 genes in multiple cell types, including immune cells, in the kidney and RCC.
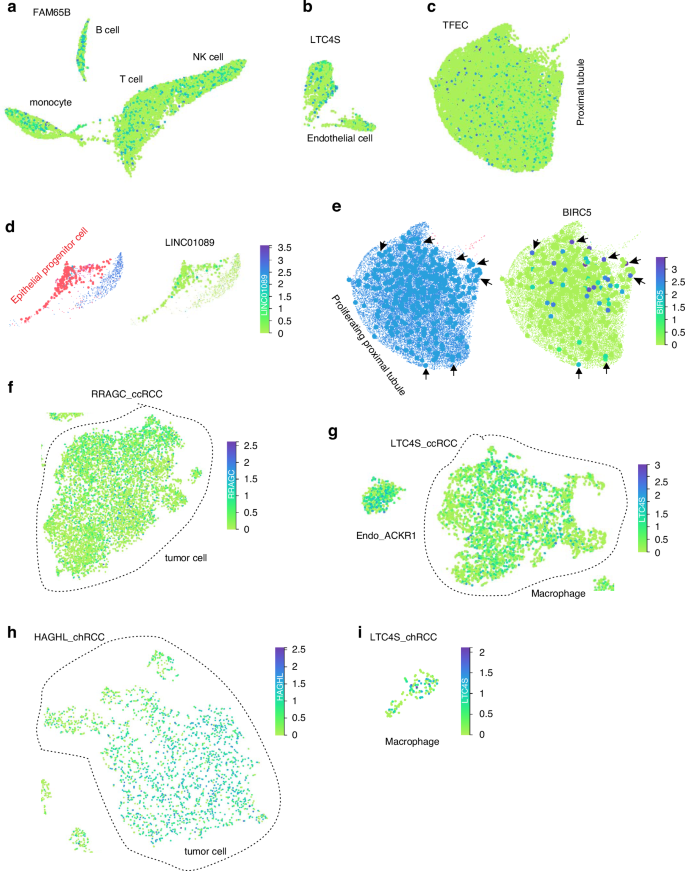
Expression of FAM65B in the indicated immune cells (a), LTC4S in endothelial cells (b), and TFEC in proximal tubule epithelial cells (c) in human kidney. For the identify of individuals cell clusters in human kidney, please see Supplementary Fig. S7a. Analyses were performed using kidney cell atlas for mature human kidney (https://www.kidneycellatlas.org/mature-kidney-global) [40]. d Expression of LINC01089 in the epithelial progenitor cells within human kidney. Left: epithelial progenitor cells (red dots); right: LINC01089 expression is overlapped with epithelial progenitor cells. e Expression of BIRC5 in proliferating proximal tubule epithelial cells. Left: proliferating proximal tubule epithelial cells (solid blue circles) within the proximal tubule cluster (See Supplementary Fig. S7a for details); right: overlap of BIRC5 expression cells with the background proliferating proximal tubule epithelial cells. Arrows indicate a few overlaps between BIRC5 expressing cells and proliferating proximal tubule epithelial cells. Expression of RPAGC in ccRCC tumor cells (f) and LTC4S in ccRCC-associated macrophages (g). Analyses were performed using single cell RNA sequencing data of ccRCC (https://cellxgene.cziscience.com/e/be39785b-67cb-4177-be19-a40ee3747e45.cxg/) [41]. Expression of HAGHL in chRCC tumor cells (h) and LTC4S in chRCC-associated macrophages (i). Analyses were performed using single cell RNA sequencing data of chRCC (https://cellxgene.cziscience.com/e/4c6f9f26-5470-455b-8933-c408232fbf56.cxg/) [41].
Sig27 gene expression in tumor and stromal cells of ccRCC and chRCC
RCC pathogenesis and progression are affected by both tumor and stromal cells; the wide distribution of Sig27 gene expressions in human kidney, as observed above, thus suggests the stromal and tumor cell impact of Sig27 genes on RCC. To investigate this possibility, we determined Sig27 gene expressions in RCC at the single cell level. This task is feasible because of the single cell RNA sequencing data of ccRCC (Supplementary Fig. S8a) and chRCC (Supplementary Fig. S9a) [41]. Sig27 genes are expressed prevalently in macrophages, endothelial cells, and tumor cells in ccRCC (Supplementary Table S2), revealing their presence in stromal and tumor cells. Among ccRCC cell populations (Supplementary Fig. S8a) [40], BIRC5 is not abundantly expressed in individual cell populations (Supplementary Table S2; Supplementary Fig S8b), but displays a focal expression pattern in CD8+ T cells, MKI67 macrophages, and tumor cells (Supplementary Fig S8b). While RRAGC is not mainly expressed in proximal tubular epithelial cells in human kidney (Supplementary Table S1), it is most abundantly expressed in tumor cells among Sig27 genes (Fig. 3f; Supplementary Table S2; Supplementary Fig. S8f). FAM65B is clearly detected in the endothelium and T cells of ccRCC (Supplementary Fig. S8c), which is different from its dominant expression in the immune cell domain in kidney (Supplementary Fig. S7c). LINC01089 does not display a preference in expression in ccRCC (Supplementary Fig. S8d), which is consistent with a minor existence of cancer stem cells in a cancer mass. While LTC4S is mainly expressed in the endothelium of human kidney (Supplementary Fig. S7e), its gain of expression in ccRCC macrophages is apparent (Fig. 3g; Supplementary Table S2; Supplementary Fig. S8e). Collectively, alterations in Sig27 gene expression in ccRCC from their expression in kidney occur in both tumor and stromal cells.
In chRCC, HAGHL is most abundantly expressed in tumor cells (Fig. 3h; Supplementary Table S3; Supplementary Fig. S9c), consistent with its clear expression in intercalated cells (Supplementary Table S1), the origin of chRCC [39]. BIRC5 displays a focal expression in chRCC (Supplementary Fig. S9b); KCNN3 is mainly detected in endothelial cells (Supplementary Fig. S9d) and LTC4S is clearly expressed in macrophages in chRCC (Fig. 3i; Supplementary Fig. S9e), which is consistent with LTC4S expression in ccRCC macrophages (Fig. 3g; Supplementary Table S2; Supplementary Fig. S8e). Taken together, the evidence above suggests an unknown functions of HAGHL in chRCC and interactions among individual cell types, including immune cells, in ccRCC and chRCC pathogenesis.
High-level correlations of Sig27 genes in RCC-associated immunosuppressive cells: population evidence
The abundant immune cell presence of Sig27 genes in RCC stroma, as detected above, suggests their impact on RCC immune evasion. Of note, FPR3 is limitedly expressed in macrophages in human kidney (Fig. 4a; Supplementary Table S1; Supplementary Fig. S10a) and is substantially expressed in tumor-associated macrophages (TAMs) in ccRCC (Fig. 4b; Supplementary Table S2; Supplementary Fig. S10b). Given FPR3 as the most upregulated genes among Sig27 genes in ccRCC (Supplementary Fig. S6c, d), its upregulation was likely attributable to FPR3 dominant expression in TAMs. FPR3 is also abundantly expressed in TAMs of chRCC (Fig. 4c; Supplementary Table S3; Supplementary Fig. S10c), indicating an important role of FPR3 in facilitating immune escape of ccRCC and chRCC.
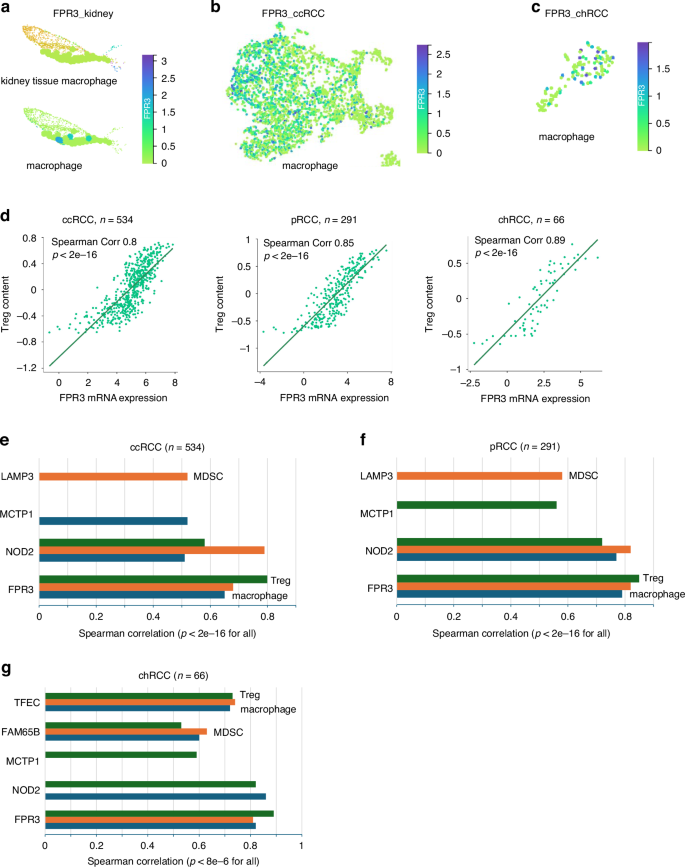
a Expression of FPR3 in human kidney resident macrophages. Top: kidney tissue macrophages. Bottom: FPR3 expressing kidney macrophages (for cluster details, please see Supplementary Fig. S7a). b, c Expression of FPR3 in the TAMs of ccRCC and chRCC. d High levels of correlation between FPR3 and Treg in ccRCC, pRCC, and chRCC. The analyses were performed using the respective TCGA datasets organized by TISIDB [65]. Correlations of the indicated genes with MDSC, Treg, and TAMs in ccRCC (e), pRCC (f), and chRCC (g). Analyses were carried out using the TISIDB platform.
To further investigate the above concepts, we detected negative correlations of FPR3 with tumor purity in large populations of ccRCC (n = 534), pRCC (n = 291), and chRCC (n = 66) (Supplementary Fig. S10d), supporting the main presence of FPR3 in the stromal compartment of RCC. In these datasets, FPR3 is correlated at high levels with TAMs in ccRCC (Spearman correlation/Corr 0.65, p < 2e−16) (Fig. 4e), pRCC (Corr 0.79, p < 2e−16) (Fig. 4f), and chRCC (Corr 0.82, p < 2e−16) (Fig. 4g). The above evidence supports an association of FPR3 with TAM in ccRCC and chRCC; this concept agrees with FPR3 expression in macrophages and tissue residence macrophages [42]. Besides TAM, MDSC and Tregs are major immunosuppressive cells contributing to tumour immune evasion [43]. In this regard, FPR3 also displays high-level correlations with Tregs and MDSC, in ccRCC, pRCC, and chRCC (Fig. 4d–g).
Sig27 also associates with immunosuppressive features of RCC via other component genes. NOD2 and MCTP1 are correlated with MDSC, Treg, or TAM in all 3 subtypes of RCC at Spearman correlation ≥0.5 and p < 2e−16 (Fig. 4e–g). While LAMP3 is correlated with MSDC in ccRCC and pRCC (Fig. 4e, f), TFEC and FAM86B are correlated with MDSC, Treg, and macrophages in chRCC (Fig. 4g). Collectively, in large populations and at the population level, NOD2, MCTP1, LAMP3, TFEC, and FAM65B contribute to Sig27’s relevance in facilitating RCC immune evasion.
Expression of the Sig27 metagene and its component genes (FPR3, NOD2, LAMP3, MCTP1, TFEC) in RCC immune cells: single cell evidence
To compensate the above population studies, we present evidence and quantification of Sig27 and its component genes with RCC-associated immune cells using multiple single-cell studies. In a single-cell RNA (scRNA) chRCC dataset [41], FPR3, TFEC, MCTP1, FAM65B, and LAMP3 are all detected in Mono/Macrophages with FPR3 and TFEC being most clearly expressed (Fig. 5a). MCTP1 is also observed in endothelial cells and FAM65B is mainly expressed in exhausted CD8+ T cells (CE8Tex) (Fig. 5a). Consistent with these observations, we detected the Sig27 metagene expression in immune cells, tumor cells and stromal cells of chRCC with immune cells displaying the most abundant expression (Fig. 5b). In immune cells, the Sig27 metagene is present in both CD8Tex and Mono/Macrophages with the latter being more dominant (Fig. 5c, d). The above evidence thus supports the presence of FPR3, TFEC, and importantly Sig27 in chRCC’s TAM and CD8Tex.
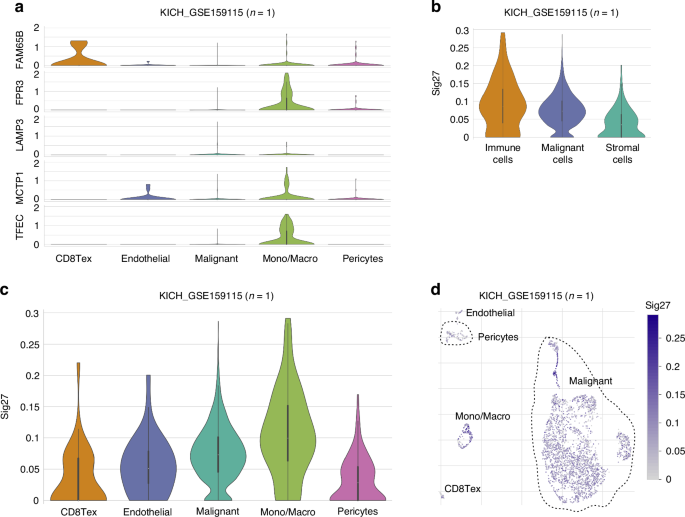
a The expression of the indicated genes in the indicated cell populations of chRCC using the KICH_GSE159115 dataset. b–d The expression of the Sig27 metagene (collapsed by mean) in the indicated cell populations of chRCC. Analyses were performed using the TISCH2 platform.
We also demonstrated the association of FPR3, MCTP1, TFEC, and Sig27 with ccRCC TAMs and other immune cells in multiple scRNA datasets with a total of n = 22 patients (Figs. 6, 7). In the KIRC_GSE111360 [44], KIRC_GSE139555 [45], and KIRC_GSE145281 [46] datasets, FPR3, MCTP1, TFEC are expressed more in M2 macrophages (Fig. 6a, c, d). FAM65B is detected in multiple immune cell populations in multiple scRNA ccRCC datasets (Fig. 6a–e), implying a general involvement of FAM65B in modulating the immune aspect of ccRCC; this notion is intriguing considering that FAM65B’s oncogenic role has only been limitedly studies (n = 4, PubMed on Dec 7, 2024) but not in kidney cancer. In multiple datasets, LAMP3 is expressed in ccRCC-associated dendritic cells (DCs) (Fig. 6b–d); LAMP3+ DCs were recently identified in hepatocellular carcinoma (HCC), which may facilitate T cell dysfunction in HCC [47]. The presence of FPR3, NOD2, MCTP1, LAMP3, TFEC, and FAM65B in the immune cell populations of ccRCC (Fig. 6) suggests an association of Sig27 with ccRCC-associated immune cells. Indeed, in these 6 scRNA ccRCC datasets, the Sig27 metagene, which was produced via collapsing its individual genes by mean, was detected in all the immune cell populations documented in these datasets, including CD8Tex, Treg, DCs, M2 macrophages, and Mono/Macrophages (Fig. 7a–f). The abundant expression of Sig27 in M2 macrophages occurred in KIRC_GSE112360, KIRC_GSE139555, and KIRC_GSE145281 (Fig. 7a, c, d). In the KIRC_GSE121636 [48], KIRC_GSE159115 [41], and KIRC_GSE171306 [49] scRNA datasets, FPR3 is most abundantly expressed in Mono/Macrophages in which both MCTP1 and TFEC are also present (Fig. 6b, e, f). Sig27 is also mainly expressed in Mono/Macrophages in these datasets (Fig. 7b, e, f).
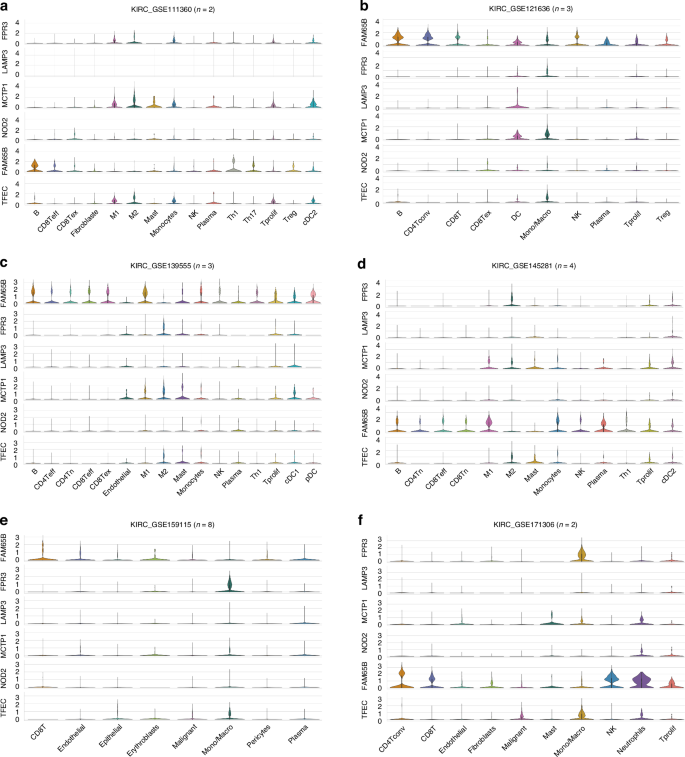
a–f Expression of the above genes in the indicated immune cell populations using the indicated scRNA ccRCC datasets. Analyses were performed using the TISCH2 platform. CD8Teff: effector CD8+ T cells, CD8Tex: exhausted CD8+ T cells, CD8Tn: naïve CD8+ T cells, CD4Tn: naïve CD4+ T cells, CD4Tconv: conventional CD4+ T cells.
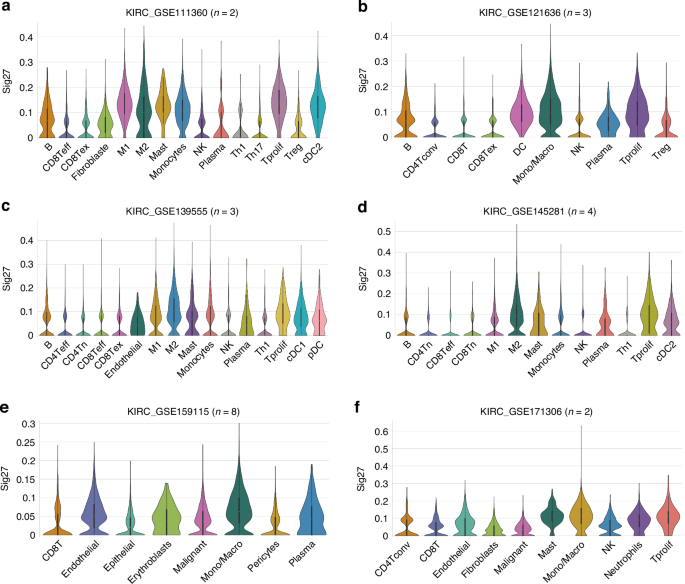
a–f Sig27 metagene expression in the indicated immune cells within the indicated scRNA ccRCC datasets. Analyses were performed using the TISCH2 platform.
We further analyzed the above set of Sig27 component genes and the Sig27 metagene in tumor-infiltrating myeloid cells in pan-Kidney cancer scRNA datasets. In the KIPAN-GSE154763 dataset [50], FPR3, LAMP3, MCTP1, NOD2, TFEC, and Sig27 are either mainly or clearly expressed in DC (Supplementary Figs. S11a–d, S12a–e). FAM65B, FPR3, MCTP1, NOD2, TFEC, and Sig27 are either dominantly (FAM65B) or clearly present in Mono/Macrophages (Supplementary Figs. S11a–d, S12a–f). Similar observations were also obtained in an-independent renal carcinoma (RCC) scRNA dataset KIPAN_GSE159913 [51] (Supplementary Figs. S11e, f, S13a–h). Collectively, we provide comprehensive evidence for the association of FPR3, LAMP3, MCTP1, NOD2, TFEC, FAM65B, and the Sig27 metagene with RCC-associated immune cells possessing immunosuppressive properties, including TAM, CD8Tex, Treg, and others. These associations are likely relevant to RCC immune evasion.
Broader associations of Sig27 component genes with immune checkpoints of RCC
Immunosuppressive tumor microenvironment (TME) consists of an array of features including the major immune cell populations of TAM, MDSC, and Tregs [43] as well as a set of immune checkpoints (ICs). In this regard, FPR3 displays high-level correlations with multiple ICs, including 6 ICs (ICOS, CD96, BTLA, CSF1R, PDCD1LG2/PD-L2, and IL10) in ccRCC (Fig. 8b), 8 ICs in pRCC (Fig. 8c), and 13 ICs in chRCC (Fig. 8d), suggesting a broader impact of FPR3 on RCC immune evasion. Among these ICs includes CSF1R, with which FPR3 is robustly correlated in ccRCC (Corr 0.79, p = 1.76e−99) (Fig. 8b), pRCC (Corr 0.77, p = 2.46e−99) (Fig. 8c), and chRCC (Corr 0.86, p = 9.12e−21) (Fig. 8a). CSF1R signaling is essential for macrophage development [52] and plays critical roles in TAM, evidenced by the CSF1R inhibitor Pexidartinib (PLX3397) being approved by FDA in cancer therapy [53]. The association of FPR3 with CSF1R in RCC fits well with its clear expression in TAM or Mono/Macrophages in RCC (Figs. 4–6).
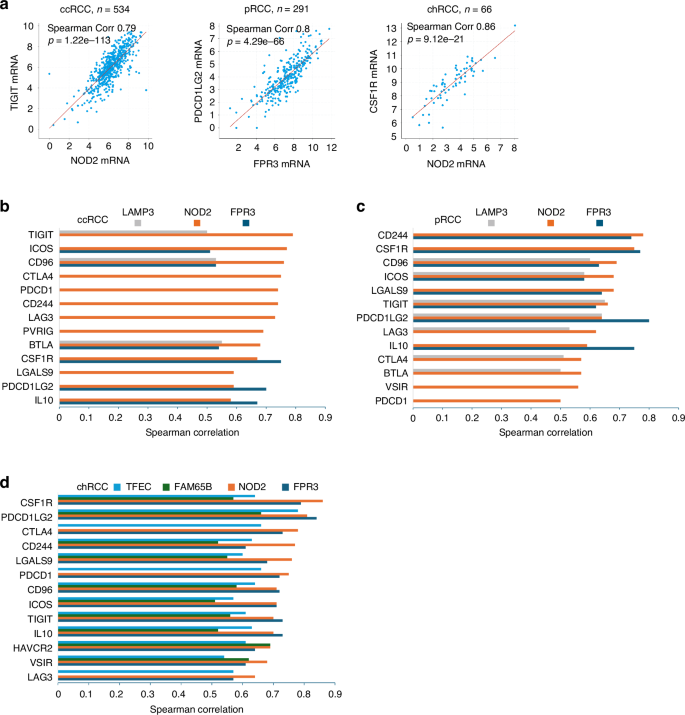
a High-level correlations (Spearman correlation ≥0.5) between NOD2 and TIGIT in ccRCC and CSF1R in chRCC. High-level correlation of FPR3 with PDCD1LG2 (PG-L2) in pRCC. The respective TCGA datasets organized by cBioPortal (https://www.cbioportal.org/) were used. Correlations between the indicated Sig27 genes and the indicated immune checkpoints in ccRCC (b), pRCC (c) and chRCC (d) are graphed. The respective TCGA datasets within the cBioPortal platform were used in the analyses.
Additionally, NOD2 exhibits high-level correlations with 13 immune checkpoints in ccRCC (Fig. 8a, b), 13 ICs in pRCC (Fig. 8c), and 13 ICs in chRCC (Fig. 8d). LAMP3 is correlated at high levels with 3 ICs in ccRCC (Figs. 8b) and 7 ICs in pRCC (Fig. 8c). FAM65B correlates with 10 ICs only in chRCC at high levels (Fig. 8d).
TFEC is also uniquely associated with 13 ICs in chRCC (Fig. 8d), implying its specific roles in chRCC immune escapes. At the single cell level, TFEC is mainly expressed in proximal tubule (PT) cells with minor presence in immune cells (myeloid and lymphoid cells) (Supplementary Fig. S7f) and dominantly expressed in TAM of chRCC (Supplementary Fig. S14a). TFEC belongs to the family of microphthalmia-associated transcription factors (MiT/TEF or MiT) [54] and is not known to function in RCC [55]. Nonetheless, TFEC expression was reported in macrophage [56]; TFEC’s correlations with TAMs, MDSC, and Treg in chRCC (Fig. 4g) indicate TFEC facilitating chRCC immune evasion (see Discussion for details). Taken together, Sig27 contains an immune evasion component, which may contribute to its effective risk stratification across ccRCC, pRCC, and chRCC.
Discussion
RCC is the dominant contributor to kidney cancer deaths. Effective risk stratification is crucial for optimizing RCC management, but it remains ineffective due to the lack of accurate biomarkers. In our novel approach to address this need, we investigated a multigene biomarker, Sig27, derived from prostate cancer for its biomarker potential in pan-RCC subtypes. This approach is not only based on our hypothesis for the underlying commonality among the three subtypes of RCC relevant to their poor prognosis but also extends to another urogenital cancer: prostate cancer. If validated, this approach will provide a more objective outcome compared to the classic and cancer-type focused biomarker studies.
Our research validates this cross-cancer biomarker study. Sig27 is an effective prognostic biomarker for 3 subtypes of RCC. Given the rareness of chRCC occurrence and the associated challenges in performing predictive medicine research in chRCC, Sig27 is particularly appealing. However, also attributable to the limitation of small chRCC sample population size, Sig27’s clinical application needs further investigations particularly in chRCC. Sig27 effectively stratifies poor prognosis in ccRCC and pRCC, which should be further studied.
Further exploration of Sig27 clinical applications in RCC is based on multiple considerations. 1) The novelty of Sig27 in RCC. Except for BIRC5, Sig27 genes remain largely unknown in RCC. Even for BIRC5, its biomarker potential has yet to be thoroughly examined in all 3 subtypes of RCC. Through optimizing cutoff point, our research revealed BIRC5 as an effective biomarker of ccRCC, pRCC, and chRCC. Given its single gene status, BIRC5 as a potential RCC biomarker is appealing and should be further examined. 2) The association of Sig27 with immunosuppressive features of RCC. Immune evasion is a hallmark of tumorigenesis and cancer progression [57], a process that involves immune checkpoints and immune cells conferring immune tolerance in cancer with MDSC, Treg, and TAMs as the major immune cell populations [43]. This knowledge has been translated into cancer therapy, evidenced by the utilization of immune checkpoint blockade (ICB) in treating multiple cancers [57]. Nonetheless, ICB-based immune therapy needs significant improvements. Towards this goal, our research revealed novel genes with possible impacts on RCC immune escapes including FPR3, NOD2, LAMP3, FAM65B, MCTP1, TFEC, and Sig27 metagene.
FPR3 and NOD2 are established pattern recognition receptors (PRRs) [35, 36]; their activity in initiating proinflammatory responses via sensing pathogens and tissue damage suggests their upregulations in RCC result in chronic inflammation, which promotes RCC progression. In this regard, it is tempting to propose targeting FPR3 and NOD2 in RCC immunotherapies.
FAM65B (RIPOR2) is expressed in T cells and suppresses T cell activation via binding and inhibiting RHOA [58]. In line with this knowledge, FAM65B is expressed in T cells infiltrated in chRCC at single cell level (Supplementary Fig. S14b), supporting its association with Treg in the TCGA chRCC cohort (Fig. 4g). While the physiological relevance of MCTP1 in immune regulation is unclear, it is expressed in myeloid cells in human kidney (Supplementary Fig. S15a) and TAMs in both ccRCC and chRCC (Supplementary Fig. S15b, c). At the single cell level, LAMP3 is expressed in immune cells in human kidney and TAMs of ccRCC; it plays a role in antigen presentation in dendritic cells [37], supporting its role in the immune evasion of ccRCC and pRCC (Figs. 4–6 and 8).
Our observed high-level correlations between TFEC and TAMs, MDSC, or Treg in chRCC (Fig. 4g) imply the functional role of the MiT family in RCC. The MiT family contains four basic helix-loop-helix leucine zipper (bHLH-LZ) transcription factors: MITF, TFE3, TFEB, and TFEC [55]. Fusion of TFE3, TFEB, or MITF with partner genes via chromosome translocation occurred in a rare group of RCC: translocation RCC (tRCC) [55, 59]. tRCC shares similarities with chRCC, including affecting young individuals and more women than men [55] as well as association with the BHD syndrome and tuberous sclerosis complex (TSC) [60, 61]. Within the MiT family, TFEC is an exception with no observed involvement in tRCC [55]. Nonetheless, our research suggests that TFEC contributes to chRCC via facilitating immune evasion within tumor microenvironment. However, whether TFEC plays a role in ccRCC and pRCC remains to be determined. Although TFEC is widely recognized for its restricted expression in macrophages [56], we observed abundant expression of TFEC in proximal tubule epithelial cells (Fig. 3c; Supplementary Fig. S7f), the commonly regarded origin of ccRCC and pRCC [38].
Our study lays the ground for further investigations of the mechanisms for BIRC5 actions in RCC and HAGHL roles in chRCC. While BIRC5 accurately stratifies RCC risk, its expression in kidney, ccRCC and chRCC is limited with a pattern of focal expression. Will the limited number of cells expressing BIRC5 be important in RCC pathogenesis and progression? Given the magnitude of HAGHL upregulation in chRCC (Supplementary Fig. S5d), the potential impact of HAGHL on chRCC should be investigated in the future. This research is limited by its retrospective nature. The biomarker potentials of Sig27 revealed here should be examined prospectively in future.
Methods
Patients
Tissues from ccRCC patients were obtained from Hamilton Health Sciences, Hamilton, Ontario, Canada under approval from the local Research Ethics Board (REB# 11114).
Semi-quantitative real-time PCR
Total RNA was isolated from ccRCC and adjacent non-tumor kidney tissues with the Iso-RNA Lysis Reagent (5 PRIME). Reverse transcription was performed using Superscript III (Thermo Fisher Scientific). Semi-quantitative real-time PCR was conducted with the ABI 7500 Fast Real-Time PCR System (Applied Biosystems, Foster, California, USA) using SYBR-green (Thermo Fisher Scientific). Fold alterations were calculated using the formula: 2−ΔΔCt. The real-time PCR primers for 4 of Sig27 component genes are presented in Supplementary Table S4.
Programs and websites
This study used the following programs: R2: Genomics Analysis and Visualization Platform (http://r2.amc.nlhttp://r2platform.com), UALCAN [62], Metascape [63], TIMER [64], and TISIDB [65]. The R glmnet, survival, Maxstat, and other packages were also utilized.
Data sources
The TCGA PanCancer Atlas datasets of ccRCC, pRCC, and chRCC organized by cBioPortal were used in this study. Single cell RNA sequencing of normal human kidney (https://www.kidneycellatlas.org/mature-kidney-global) [40], ccRCC (https://cellxgene.cziscience.com/e/be39785b-67cb-4177-be19-a40ee3747e45.cxg/) [41], and chRCC [41] were also utilized.
Assignment of risk scores to individual tumors
Coefficient (coef) of Sig27 component genes (n = 27) in predicting OS probability was generated using multivariate Cox PH regression within the R Survival package. Risk scores for individual tumors were determined as: Sum (coef1 x Gene1exp + coef2 x Gene2exp + … …+ coefn x Genenexp), where coef1 … coefn are the coefs of individual genes and Gene1exp … … Genenexp are the expression of individual genes.
Statistical analysis
Kaplan–Meier curves, log-rank test, and Cox regressions were performed with R Survival package and tools provided by cBioPortal. ROC profiles were constructed using the PRROC package in R. Other statistical analyses were performed using specific website programs and by GraphPad Prism 7 and SPSS 26. Data were presented as mean ± SEM/SD. A value of p < 0.05 was considered statistically significant.

Responses