A polyketide-based biosynthetic platform for diols, amino alcohols and hydroxy acids
Main
Diols are widely used, industrially important commodity and speciality chemicals1. Over the past decades, a few natural and artificial pathways for their synthesis have been established in Escherichia coli and other industrial microbes targeting different short-chain diols2,3,4,5. The development and industrialization of microorganisms to convert renewable feedstocks into 1,3-propanediol, 1,4-butanediol and 1,3-butanediol (1,3-BDO, used as a humectant and cosmetic solvent) has been a major advance for metabolic engineering6,7. In addition to short-chain diols, medium- and branched-chain diols are also important solvents, polymer building blocks, fragrances and cosmetic ingredients1. A prime example is 2-ethyl-1,3-hexanediol (2-E-1,3-HDO), used as an insect repellent, boron extractant, ink solvent and ingredient in cosmetics for over half a century8. In addition to its own market value, its derivative 2-ethylhexanol is a major building block for polyvinyl chloride plasticizers, is produced in millions of tonnes annually and had a US$6 billion market size in 20229. Despite their importance, metabolic pathways to produce medium- and branched-chain diols are rare and have not been commercialized. Also, each target molecule generally requires a distinct biosynthetic pathway that will not produce other analogues, making it impossible to extend the knowledge gained from the synthesis of one molecule to the synthesis of others. In fact, this issue represents a biosynthetic challenge for almost all medium- and branched-chain chemical bioproduction (alcohols, amines and amino alcohols, to list a few) and highlights a major knowledge gap in metabolic engineering. To tackle this problem, we aimed to design a biosynthetic platform suitable for the production of 1,3-BDO, 2-E-1,3-HDO and any medium- or branched-chain alcohol and derivative, with programmable access to precisely tuned chemistry a key feature.
Modular type I polyketide synthases (PKSs) are megasynthases that use coenzyme A (CoA) substrates to produce complex natural products, many of which are used as pharmaceuticals10. The chemical structure of PKS products are strictly determined by the order of each enzymatic domain and module10,11. Because the structure of the molecule it produces is encoded in the DNA sequence, scientists have long dreamed of designing PKSs to produce nearly any organic molecule. Recently, PKSs have been redesigned to incorporate unnatural functionalities, such as fluorine12,13, or to produce new-to-nature molecules, such as short-chain ketones14 and triketide lactones15,16. Thus, we hoped to investigate whether PKSs can be used as a platform for the biosynthesis of many different diols and related molecules that have not yet been biosynthesized or molecules that require distinct biosynthetic pathways. The PKS production of 1,3-BDO and 2-E-1,3-HDO has two prerequisites: an initiation module that selects acetyl and butyryl starter units, and an extension module with a ketosynthase-acyltransferase-ketoreductase-acyl carrier protein (KS-AT-KR-ACP) architecture to install a hydroxyl group on the third carbon (Fig. 1a). Finally, the polyketide biosynthesis must be terminated with an alcohol if we want to produce a diol with a hydroxyl group on the first carbon (or with an amine if we want to produce an amino alcohol with an amine on the first carbon). Unfortunately, most natural PKSs terminate polyketide biosynthesis with thioesterases (TEs), which either directly hydrolyse the ACP intermediates to produce carboxylic acids or catalyse macrocyclization to give lactones or lactams. Indeed, the limited scope of TE-mediated termination is a major hurdle to expand the current PKS design space.
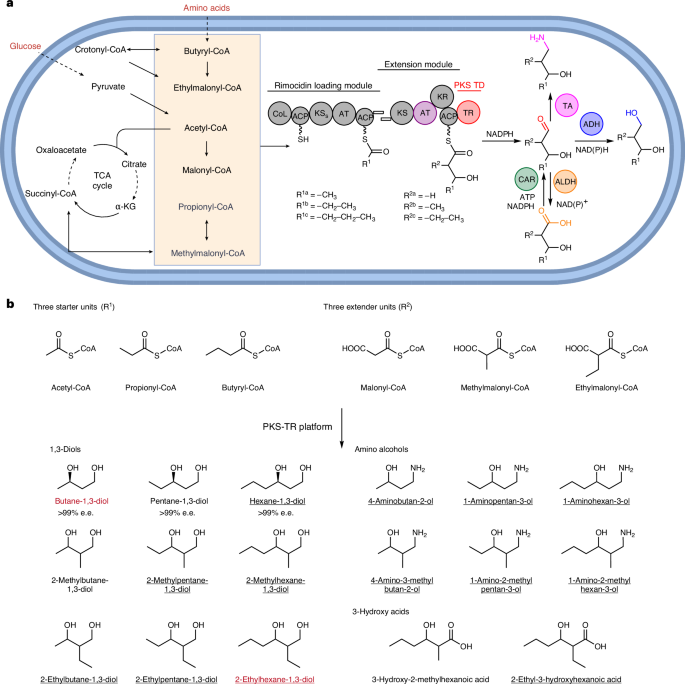
a, Using glucose (and l-valine) as the carbon source, engineered rimocidin PKS can load three CoA starter units and three extender units. Incorporation of a PKS TR led to the production of diverse products via programmed post-PKS modification by alcohol dehydrogenases (ADHs), aldehyde dehydrogenases (ALDHs) or transaminases (TAs). The dashed lines in the precursor pathways indicate multiple steps. TCA, tricarboxylic acid; α-KG, α-ketoglutarate; KSS, non-canonical KS in rimocidin loading module; TD, terminal domain; CoL, CoA ligase. In the substituent codes R1a/b/c and R2a/b/c, the notation a/b/c denotes different chemical groups that are accepted as substrates for the specified reactions. b, Summary of all the products elaborated in this study. Molecules highlighted in red are industrially valuable and underlined products were microbially synthesized here as featured products. e.e., enantiomeric excess. Created with BioRender.com.
An appealing strategy to overcome this challenge is to use terminal thioreductases (TRs)11. Reduction-dependent termination in natural product biosynthesis is common in non-ribosomal peptide synthetases (NRPSs), carboxylic acid reductases (CARs), hybrid PKS and NRPS, and fungal iterative PKS systems17,18,19,20,21,22. These reductase (R) domains catalyse nicotinamide adenine dinucleotide (NADH)-dependent or nicotinamide adenine dinucleotide phosphate (NADPH)-dependent two-electron reduction to produce aldehydes or aldehyde derivatives, or four-electron reduction in two steps to produce alcohols. For comparison, modular PKS chain release catalysed by TRs has been reported in the past decade, but with only a handful of examples23,24,25,26,27,28,29, including the coelimycin and cyclizidine PKSs. These are often coupled with cognate transaminases (TAs) in biosynthetic gene clusters (BGCs): TR catalyses two-electron reductive cleavage of the acyl substrate to produce an aldehyde, which is subsequently converted to an amine by the TA23. Apart from a few studies to understand natural PKS TRs, they have not been used in engineered PKSs.
In this study, we biochemically and structurally characterized PKS TRs and confirmed that TRs catalyse two-electron reductive cleavage to produce aldehydes. As aldehydes are highly reactive intracellularly, we designed an engineered PKS-TR-based biosynthetic platform for the bioproduction of a wide range of aldehyde derivatives, illustrated by the production of nine 1,3-diols, including 1,3-BDO and 2-E-1,3-HDO, six amino alcohols and at least two 3-hydroxy acids (Fig. 1b). This platform exploits PKS substrate promiscuity and assembly-line architecture to provide designable carbon skeletons, as well as TR catalysis and programmed post-PKS modification to diversify the chemistry at C1 with the potential to produce a wide range of bioproducts, including diols, alcohols, amines and hydrocarbon biofuels.
Results
PKS TRs terminate polyketides with an aldehyde group
We first built a PKS TR library based on phylogeny analysis (Fig. 2a and Supplementary Fig. 1) and selected nine TRs to study (TR1–TR9). The selected TRs uniformly covered the phylogenetic tree, and seven of them had validated pathway products. Among them, the TR from the coelimycin PKS BGC (TR1 or CpkC TR) has been reported to be an NADH-dependent reductase23 that is capable of reducing octanoyl-CoA, a natural substrate mimic (Supplementary Fig. 2), to octanol in two steps (Fig. 2b). Our phylogenetic analysis suggested a close evolutionary relationship between PKS TRs and NADPH-dependent PKS KRs30 and a distant relationship with NADH-dependent alcohol dehydrogenases31 (ADHs), contrary to the literature report of NADH dependency (Fig. 2a). To gain further insight into TR catalysis, we overexpressed TR1, TR2, TR7 and TR9 in E. coli BL21(DE3) and purified these TRs to >95% homogeneity (Supplementary Fig. 3a–d). We also purified the TR1-cognate ACP1 with a maltose binding protein (MBP) tag fused at the amino terminus of ACP1 to improve protein solubility (Supplementary Fig. 3e). We then loaded octanoyl-CoA onto MBP-ACP1 in vitro with surfactin phosphopantetheinyl transferase (Sfp), a promiscuous phosphopantetheinyl transferase32. After removal of excess octanoyl-CoA via dialysis, octanoyl-ACP1 was tested as a TR1 substrate together with octanoyl-CoA and octanal. TR1 did not reduce octanoyl-CoA or octanal when NADH was used as cofactor (Supplementary Fig. 4b), but it did reduce octanoyl-ACP1. With NADPH, TR1 reduced octanoyl-ACP1 and octanoyl-CoA at a much faster rate than it reduced octanal (Supplementary Fig. 4a). These results indicate that TR1 is an NADPH-preferred reductase. To conclusively address the substrate scope and cofactor preference of PKS TRs, we next purified ACP9 without the MBP tag and tested its reactivity with TR9 (Supplementary Fig. 3f). TR9 is derived from the venediol BGC, with 63% sequence identity to TR1 (ref. 28). TR9 used only NADPH as a cofactor, readily reacting with the natural substrate analogues octanoyl-ACP9 and octanoyl-CoA, but not with NADH or octanal (Fig. 2c,d and Supplementary Fig. 4c). From these results, we concluded that TRs are NADPH-dependent termination enzymes that produce aldehydes and are incapable of further reducing aldehydes to alcohols.
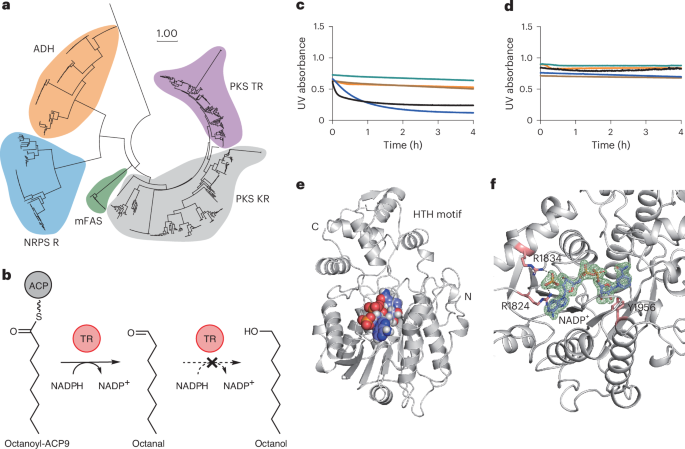
a, Phylogenetic analysis of PKS TRs, PKS KRs, mammalian fatty acid synthases (mFASs), NRPS R domains and ADHs in primary metabolism. The scale bar labeled ‘1.00’ means that a branch length of that size corresponds to one amino acid substitutions per site on average. b, TR9-catalysed reaction of a natural substrate mimic, octanoyl-ACP9. c,d, Characterization of the TR9 substrate scope and cofactor preference with NADPH (c) and NADH (d). NAD(P)H consumption was assessed by monitoring the UV absorbance at 340 nm. Black, TR9 + NAD(P)H + octanoyl-ACP9; blue,TR9 + NAD(P)H + octanoyl-CoA; brown, TR9 + NAD(P)H + octanal; green, NAD(P)H + octanoyl-CoA; orange, NAD(P)H + octanal. For TR catalysis, the preferred substrates are ACPs or CoAs and the preferred cofactor is NADPH. e, Crystal structure of the CpkC TR (TR1) bound to NADP+. The protein is shown in grey and the cofactor is shown in light blue (carbon), red (oxygen), dark blue (nitrogen) and orange (phosphorus). f, View of the active site of TR1 and Arg1824- and Arg1834-coordinated NADP+ ribose 2′-phosphate. Tyr1956 is the catalytic proton donor. The NADP+ omit map (mFo − DFc, 3.0 σ level) is shown in green. mFo represents the experimentally observed structure factors, DFc represents the calculated structure factors.
Source data
To understand the structural basis for TR cofactor recognition, we determined the crystal structure of CpkC TR (TR1) bound to NADP+ at 1.8 Å resolution (Fig. 2e). The TR1 structure consists of the amino (N)-terminal nucleotide binding domain and the carboxy (C)-terminal substrate binding domain, featuring an invariant ‘TGX2GX2G’ motif, and two conserved arginine residues at 1824 and 1834 that coordinate the ribose 2′-phosphate in NADP+, providing a structural explanation for the preference for NADP+ (refs. 31,33; Fig. 2f and Supplementary Figs. 5 and 6). Overall, these structural features align well with published tyrosine-dependent ‘extended’ short-chain dehydrogenase/reductase (SDR) structures19,21. We performed a structural homology search using the Dali server34 and found the closest structural homologues to be the non-ribosomal peptide synthetase MxaA terminal reductase (NRPS R) domain19, with a root mean squared deviation (r.m.s.d.) of 1.14 Å, and the Segniliparus rugosus carboxylic acid reductase (SrCAR) R domain35, with an r.m.s.d. of 1.97 Å. The major structural differences between PKS TR, NRPS R and CAR R lie in the post-β5 loop and α10-α11 ‘helix-turn-helix’ (HTH) motif (Fig. 2e and Supplementary Fig. 7), which are the putative ACP or peptidyl carrier protein (PCP) binding sites. The HTH motif is absent in other common types of SDR, supporting the importance of HTH for ACP/PCP recognition36. Furthermore, the limited structural similarity between the PKS TR, NRPS R and CAR R HTH regions suggests distinct substrate binding patterns for these three types of reductase in secondary metabolism.
Engineering rimocidin PKS and TRs for 1,3-diol production
With a functional TR in hand and an understanding of its catalytic potential, we next sought to use it to produce aldehyde-derived alcohols, including 2-E-1,3-HDO. To do this, we used the retrobiosynthesis software ClusterCAD RetroTide, which we developed previously to design PKSs for specific products37. We designed PKS domain architectures for the production of 2-E-1,3-HDO that contain a butyryl-CoA-specific loading module, an ethylmalonyl-CoA-specific extension module with a KS-AT-KR-ACP architecture and a TR termination domain. Based on that information, we searched for suitable PKS candidates and narrowed our candidates to the rimocidin (Rim) PKS. Rim-like natural products have been isolated from several Streptomyces species38,39. Depending on which substrates are loaded onto the PKS, the products are CE-108 and Rim in Streptomyces diastaticus var. 108 and BU16 and Rim in Streptomyces mauvecolor strain BU16. Only partial BGC information was available; therefore we analysed the Rim BGCs and validated their PKS architectures using antiSMASH40 (Supplementary Fig. 8). As the Rim PKS loading module RimM0 has a CoA ligase (CoL) loading domain architecture, CoL-ACP1-KS-AT-ACP2, we investigated its loading mechanism as the first step. However, we failed to obtain soluble RimM0 when we expressed it in E. coli. Instead, we turned our attention to a RimM0 homologue protein in the natamycin/pimaricin (Pim) PKS pathway, PimS0, which has the same domain architecture41 (Supplementary Fig. 9a). We expressed the gene encoding PimS0 in E. coli, purified it and confirmed this PKS initiation mode with an acetyl starter unit (Supplementary Figs. 9b,c and 10). Despite the same initiation module architecture as Rim PKS, Pim PKS is unable to load the butyryl starter unit required for 2-E-1,3-HDO production. Thus, we tested whether the Rim PKS can be fused with TRs and produce 1,3-diols in a microbial host (Fig. 3a).
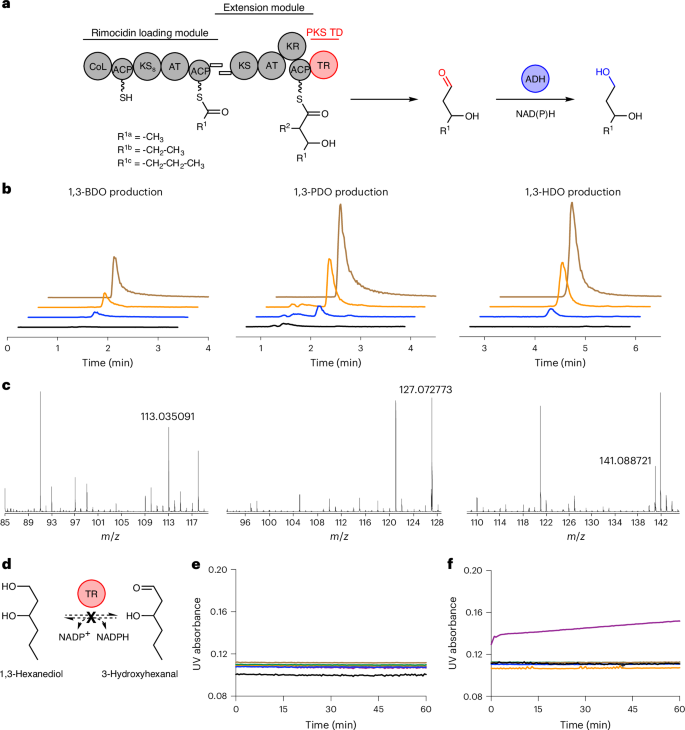
a, Schematic showing the production of 1,3-BDO, 1,3-PDO and 1,3-HDO with RimPKS-TR. In the substituent codes R1a/b/c, the notation a/b/c denotes different chemical groups that are accepted as substrates for the specified reaction. R2 = –H. b, LC–MS extracted ion chromatograms of the 1,3-diols produced by S. albus RimM0M1-TR1 (QD27). Black, S. albus RimM0 (QD1) control; blue, QD27; orange, QD27 spiked with standards; brown: 1,3-diol standards. c, MS detection of 1,3-diol [M + Na]+ (see Supplementary Fig. 13 for details). d–f, Characterization of 1,3-HDO enzymatic oxidation (d) by monitoring the accumulation of NADPH (e) or NADH (f) via UV absorbance at 340 nm. Black, 1,3-HDO + NAD(P)+; blue, TR1 + 1,3-HDO + NAD(P)+; brown, TR2 + 1,3-HDO + NAD(P)+; green, TR7 + 1,3-HDO + NAD(P)+; orange, TR9 + 1,3-HDO + NAD(P)+; purple, TADH2 + 1,3-HDO + NAD(P)+. No TR catalysed such oxidation reactions. TADH2 serves as a positive control.
Source data
Using bacteriophage integrases42, we integrated the native rimM0 gene driven by a constitutive PrpsL(RO) promoter into Streptomyces albus J1074 and Streptomyces coelicolor M1152, two common heterologous hosts for PKS engineering. RimM0 protein abundance in these Streptomyces hosts was assessed by proteomics analysis, which showed that RimM0 was present at 1.2 ± 0.3% relative protein abundance in S. albus and absent in S. coelicolor (Supplementary Fig. 11a). We also screened rimM0 expression under two other constitutive promoters, Pgapdh(EL) and kasOP*, a strong mutant version of kasOP (refs. 43,44). Pgapdh(EL)-driven rimM0 expression led to a peak in the screening test, with 8.3 ± 0.9% protein abundance, while no kasOP*-driven rimM0 expression was detected. With S. albus RimM0 (QD1) in hand, we examined potential target molecule consumption by our Streptomyces hosts, a phenomenon that we observed when engineering other hosts to produce new-to-nature molecules45,46. Neither of the two target molecules, 1,3-pentanediol (1,3-PDO) and 1,3-hexanediol (1,3-HDO), were catabolized by our Streptomyces hosts when added to cultures (Supplementary Fig. 12). This led us to build S. albus RimM0M1-TR1 (QD27) and look for 1,3-diol production. For the chimaeric RimM1-TR1 design, we identified the N-terminal boundary of TR1 (DFAAE motif) based on the crystal structure, fused the N terminus of the TR1 linker (RAELSADGSASRPVG sequence) with the C terminus of RimM1 ACP (LRSEV sequence) and integrated the chimaeric Pgapdh(EL)–rimM1-TR1 into QD1 to make QD27. Liquid chromatography-mass spectrometry (LC–MS) was used to detect the 1,3-diol products. Thus, we successfully detected the production of 6.7 mg l−1 1,3-BDO, 12.3 mg l−1 1,3-PDO and 0.76 mg l−1 1,3-HDO in tryptic soy broth (TSB) medium after 72 h, demonstrating the feasibility of PKS-TR engineering for diol bioproduction (Fig. 3b,c and Supplementary Fig. 13). For comparison, we also constructed S. albus RimM0M1-6-deoxyerythronolide B synthase (DEBS) TE (QD18) and looked for 3-hydroxy acid production, but with no success (Supplementary Fig. 14a). 3-Hydroxypentanoic acid and 3-hydroxyhexanoic acid, two putative QD18 products, were quickly consumed by S. albus J1074 after direct feeding, providing a possible explanation (Supplementary Fig. 14b,c). This presents a vivid example of the advantage of PKS-TR over traditional PKS-TE engineering, as polyketide-based carboxylic acids may be prone to β-oxidation, resulting in the loss of the desired product and ultimately design failure. Apart from providing alternative C1 chemistry as a more reactive aldehyde, PKS-TR may also protect the designed carbon skeleton from host consumption and degradation.
Because TR is incapable of aldehyde reduction, the conversion of aldehyde to 1,3-diol that occurred in our engineered S. albus QD27 was probably catalysed by unknown ADHs in the host. To confirm this hypothesis, we tested whether four purified TRs can oxidize the 1,3-diols that QD27 produced to 3-hydroxy aldehydes as ADH-catalysed reactions of alcohols to aldehydes are usually reversible (Fig. 3d). For example, promiscuous tomato alcohol dehydrogenase 2 (TADH2) readily catalysed the NAD+-dependent oxidation of 1,3-BDO, 1,3-PDO and 1,3-HDO47 (Fig. 3e,f and Supplementary Figs. 15 and 16). For comparison, none of the four TRs accepted these 1,3-diols as a substrate, suggesting that native S. albus ADHs catalyse the final reduction step in 1,3-diol biosynthesis without the need to incorporate exogenous ADHs (Fig. 3e,f).
Exploring the engineering strategies of a tunable PKS-TR platform
Our next goal was to increase the titres of all 1,3-diols and also the ratio of 1,3-HDO to other diols. We first screened a series of common Streptomyces growth media, including TSB, R5, M042, ISP2 and ISP4 (Supplementary Fig. 17). When grown in R5 medium, QD27 produced the highest titre of 1,3-diols in 72 h (38.6 mg l−1). Based on this result, for the following experiments, we chose R5 as the standard medium, which includes 1% glucose. Next, we tested eight RimM0M1-TR1/2/3/4/6/7/8/9 chimaeras and confirmed 1,3-diol production in all designs except RimM0M1-TR4 and RimM0M1-TR7. Of the six successful designs, RimM0M1-TR2 (QD28) was the best producer of 1,3-diols (Fig. 4a). Finally, prolonged cultivation of QD28 for 10 days led to an increase in the total 1,3-diol titre to 264.2 mg l−1, with 135.4 mg l−1 1,3-BDO, 99.7 mg l−1 1,3-PDO and 29.1 mg l−1 1,3-HDO produced in shake flasks (Fig. 4b). Interestingly, although Pgapdh(EL)-driven rimM0 expression was higher than PrpsL(RO)–rimM0 expression in engineered S. albus, 1,3-diol production in the latter strain was optimal (Supplementary Fig. 11b).
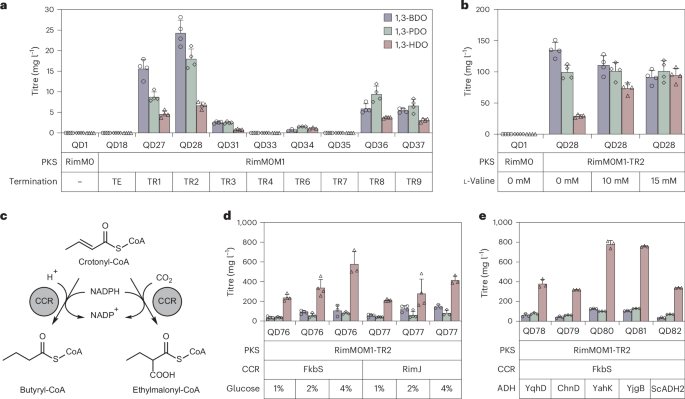
a, Results of the screening of eight TRs in RimM0M1-TR after cultivating for 3 d in R5 medium (n = 3 for RimM0M1-TR6; n = 4 for other groups). b, The addition of the butyryl-CoA precursor l-valine increased the 1,3-HDO production titre and ratio in RimM0M1-TR2 (QD28; n = 4). c, Crotonyl-CoA carboxylase/reductase (CCR)-catalysed reactions to convert crotonyl-CoA to butyryl-CoA and ethylmalonyl-CoA. d, Overexpression of FkbS or RimJ CCR in QD28 and increasing glucose concentration in R5 led to 765 mg l−1 total 1,3-diol production in shake flasks (n = 3 for 4% glucose groups; n = 4 for other groups). e, Overexpression of exogenous ADH YahK in engineered S. albus RimM0M1-TR2 + FkbS (QD76) led to QD80 with increased 1,3-diol total titres of 1,008 mg l−1 after cultivation for 7 d in R5 + 2% glucose + 15 mM l-valine (n = 3). All cultivation data are presented as mean values; error bars indicate the standard deviation (s.d.).
Source data
Next, to evaluate the effect of TRs on diol productivity, we purified RimM1 ACP in apo form from E. coli BL21(DE3) (Supplementary Fig. 3h) and evaluated the origin of TR substrate specificity using isothermal titration calorimetry (ITC). No affinity between RimM1 ACP and standalone TR1 or TR2 was detected by ITC (Supplementary Fig. 18a,b). This suggests that RimM1 ACP–TR interactions, if present without a small substrate molecule attached to the ACP, are mostly transient and require a covalent linkage to position RimM1 ACP near the TR. Next, we attempted to detect TR1 or TR2 binding to 3-hydroxybutyryl-CoA, a CoA substrate mimic for 1,3-BDO production. To our surprise, we detected no CoA substrate binding to TR1 or TR2 with or without excess NADP+ (Supplementary Fig. 18c,d). For comparison, TR1 and TR2 bind to NADP+ with equilibrium dissociation constant (Kd) values of 45.9 and 34.2 μM, respectively (Supplementary Fig. 18e,f), and 3-hydroxybutyryl-CoA was reduced by TR1 or TR2 when NADPH was added (Supplementary Fig. 19), indicating that CoA substrate recruitment to the TR active site requires NADPH cofactor binding. We next used AlphaFold 3 (ref. 48) to predict all eight RimM1 ACP–TR complex structures involved in our study and analysed putative RimM1 ACP–TR interactions when fused together (Supplementary Figs. 20–22). As expected, the HTH motif is the predicted ACP recognition site. Notably, PKS ACP–TR HTH interactions are predicted to be primarily charge–charge interactions, distinct from the absence of charge–charge interactions observed at the NRPS PCP–R didomain interface36. We also found that AlphaFold 3 predicted no ACP–TR interaction in the ACP–TR3 and ACP–TR4 complexes (Supplementary Fig. 21c,d), in agreement with the observation of limited diol production by RimM0M1-TR3 (QD31) and no diol production by RimM0M1-TR4 (QD33). Another factor that may play a key role in determining diol productivity is the chimaeric RimM1-TR protein abundance in our engineered strains. In agreement with the absence of diol production by RimM0M1-TR7 (QD35), we did not detect RimM1-TR7 protein in our proteomics analysis (Supplementary Fig. 23), indicating the importance of chimaeric protein stability and abundance for detectable in vivo product titres.
As 1,3-HDO was still a minor product in QD28, we hoped to further improve its titre and product ratio. Substrate-promiscuous PKSs have been proposed as biosynthetic platforms that can be elegantly tuned by CoA substrate regulation, with a few reports of successful engineering14. In S. albus, the addition of l-valine increased the intracellular levels of butyryl-CoA and ethylmalonyl-CoA49, both of which are putative building blocks for 1,3-HDO and 2-E-1,3-HDO biosynthesis. To validate the hypothesis that l-valine can be converted into 1,3-HDO through engineered RimPKS-TR catalysis, we fed in 13C-labelled l-valine and observed 13C-labelled 1,3-HDO as the final product (Supplementary Fig. 24). We then added 15 mM l-valine in R5 medium and detected a slight increase in the overall 1,3-diol titre from 264.2 mg l−1 to 287.2 mg l−1, with a marked improvement in both the 1,3-HDO titre (from 29.1 mg l−1 to 94.5 mg l−1) and ratio (from 11% to 33%; Fig. 4b).
Next, we attempted to further increase the butyryl-CoA and ethylmalonyl-CoA substrate pools by enzymatically modifying their biosynthetic pathways. (2S)-Ethylmalonyl-CoA is the third most used extender unit in PKS biosynthesis50 and several Streptomyces BGCs that extend with ethylmalonyl-CoA contain annotated crotonyl-CoA carboxylase/reductase (CCR) genes, presumably to enhance the CoA substrate supply51,52. Being part of the (2S)-ethylmalonyl-CoA pathway, these CCRs preferentially catalyse NADPH-dependent carboxylation on crotonyl-CoA to produce (2S)-ethylmalonyl-CoA (Fig. 4c). When CO2 (or bicarbonate) is absent, butyryl-CoA is formed as a minor CCR product from crotonyl-CoA. We selected two candidates, rimJ CCR in the Rim BGC38 and fkbS CCR in the FK520 BGC53. Both CCR genes were integrated into S. albus QD28 and the resulting strains showed an improved 1,3-HDO titre of 238.9 mg l−1 (QD76 with fkbS integration) and 210.4 mg l−1 (QD77 with rimJ integration) after cultivation for 7 days. Remarkably, QD76 completely reversed the product ratio and produced 309.2 mg l−1 1,3-diols, 77% of which was 1,3-HDO, demonstrating the robustness of tuning PKS product profiles by adjusting CoA substrate pools. Moreover, increasing the glucose concentration in R5 from 1% to 2% led to a total production of 517.3 mg l−1 1,3-diols, and R5 + 4% glucose produced 765.1 mg l−1 1,3-diols in shake flasks (Fig. 4d). Finally, we integrated five exogenous ADH genes (yqhD, chnD, yahK, yjgB and ScADH2)4,54,55 into QD76, creating strains QD78–QD82, and tested whether overexpression of these ADHs can improve the production of 1,3-diols. We found that the yahK-integrated strain QD80 and the yjgB-integrated strain QD81 improved production, with QD80 being the best producer, achieving a 1,3-diol titre of 1,008.5 mg l−1 after cultivation for 7 days in R5 + 2% glucose + 15 mM l-valine, of which 77% was 1,3-HDO (Fig. 4e). To determine the chirality of our 1,3-diol products, we extracted 1,3-BDO, 1,3-PDO and 1,3-HDO from the cell culture using dichloromethane and separated them by flash chromatography. Each pure biodiol was derivatized as follows. First, we used tert-butyldimethylsilyl chloride and imidazole in dichloromethane to selectively protect the primary alcohol as the tert-butyldimethylsilyl ether. Second, the secondary alcohol at the C3 position of bio-1,3-diols was coupled with N-(2-carboxy-4,5-dichlorobenzoyl)-(–)-10,2-camphorsultam (CDPA) to convert a mixture of enantiomers into a corresponding mixture of diastereomers (Supplementary Fig. 25). By detailed NMR analysis of the CDPA derivatives of racemic 1,3-diol standards, (3R)-diol standards and cell culture samples, we determined all three diols to be 100% (3R)-diols (Supplementary Figs. 26–29). We also validated the diol enantiomeric excess (e.e.) to be >99% by chiral gas chromatography mass spectrometry (GC–MS), further confirming strict stereospecificity of PKS (Supplementary Fig. 30). These results convincingly demonstrate the efficiency and tunability of our PKS-TR platform.
Bioproduction of medium- and branched-chain diols
So far, branched-chain diol biosynthesis has proved a major challenge due to the relatively narrow scope of available pathways for biosynthesis. Amino acids with branched side chains such as l-valine and l-isoleucine can serve as precursors for branched-chain diol biosynthesis through CoA-independent biosynthesis routes4, but the lack of available enzymes to modify amino acid side-chain length and chemical diversity hinders their further application. We aimed to use our PKS-TR platform via AT domain exchange to produce a series of branched-chain diols (Fig. 5a). Among our targets, a low titre (12.1 mg l−1) of 2-methyl-1,3-butanediol (2-M-1,3-BDO) has been produced in E. coli4. For methyl-branched diol production, we replaced the malonyl-CoA-specific AT in the PKS extension module with a methylmalonyl-CoA-specific AT from module 7 of the Rim BGC (RimM7 AT), constructing S. albus RimM0M1(RimM7 AT)-TR2 (QD66) and S. albus RimM0M1(RimM7 AT)-TR2 + FkbS (QD83). We selected a cultivation of 7 days in R5 + 2% glucose + 15 mM l-valine as our standard cultivation method, under which QD66 produced 425.3 mg l−1 2-M-1,3-BDO, 56.2 mg l−1 2-methyl-1,3-pentanediol (2-M-1,3-PDO) and 40.0 mg l−1 2-methyl-1,3-hexanediol (2-M-1,3-HDO; Fig. 5b). Furthermore, the diastereomeric ratios of the 2-methyl-diols were >99:1 for 2-M-1,3-BDO and 2-M-1,3-PDO and 97:3 for 2-M-1,3-HDO in QD83 (Supplementary Fig. 31); together with the fact that no unbranched-chain diols were detected, these data highlight a precise PKS engineering strategy for branched-chain molecules (Supplementary Figs. 32 and 33). Next, TR screening showed that TR7 was the best TR to accept methyl-branched substrates, resulting in the production of 743.6 mg l−1 2-methyl-1,3-diols (Fig. 5b). We also tested a RimM7 AT homologue, PimM7 AT, achieving a similar 2-methyl-1,3-diol titre of 572.8 mg l−1 in RimM0M1(PimM7 AT)-TR7 (QD69). In QD69, FkbS CCR overexpression created the QD85 strain with an increased 2-M-1,3-HDO titre (from 18.6 mg l−1 to 79.2 mg l−1) and ratio (from 3% to 31%). The relatively low ratio of 2-M-1,3-HDO in the product profile is likely due to the accumulation of its carboxylic acid derivative, 2-methyl-3-hydroxyhexanoic acid, as FkbS overexpression also led to an 8.6-fold increase in the production of 2-methyl-3-hydroxyhexanoic acid (Supplementary Fig. 34).
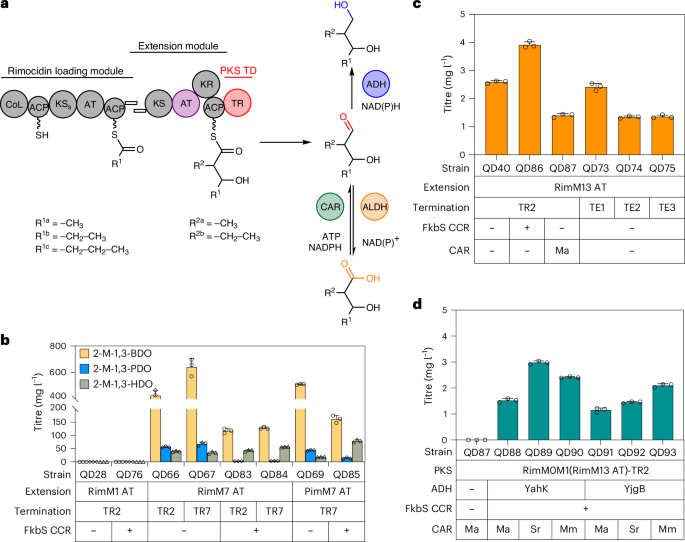
a, Schematic showing PKS-TR engineering via AT exchange and post-PKS modification. In the substituent codes R1a/b/c and R2a/b, the notation a/b/c denotes different chemical groups that are accepted as substrates for the specified reactions. b, Bioproduction of 2-methyl-1,3-diols in S. albus RimM0M1(Rim/PimM7 AT)-TRs. c, Bioproduction of 2-ethyl-3-hydroxyhexanoic acid in engineered S. albus RimM0M1(RimM13 AT)-TR2/TEs. TE1, DEBS TE; TE2, pikromycin TE; TE3, Rim TE. d, Bioproduction of insect repellent 2-E-1,3-HDO in S. albus RimM0M1(M13 AT)-TR2 + ADH + CAR. All data were collected after cultivation for 7 d in R5 + 2% glucose + 15 mM l-valine. The data are presented as mean values; the error bars indicate the s.d. of three biological replicates (n = 3).
Source data
Next, we constructed a microbe for the production of 2-E-1,3-HDO by replacing the malonyl-CoA-specific AT with an ethylmalonyl-CoA-specific AT. RimM13, the last module of Rim PKS, has the same functional domain composition as RimM1, except that RimM13 AT loads ethylmalonyl-CoA based on pathway analysis. This drove us to test a series of RimPKS-TR chimaeric designs, including the exchange of only RimM1 AT with RimM13 AT (QD40), RimM1 AT-KR-ACP with RimM13 AT-KR-ACP (QD51) or the entire RimM1 with RimM13 (QD42; Supplementary Fig. 35). Among these designs, not one produced 2-E-1,3-HDO; only S. albus RimM0M1(RimM13 AT)-TR2 (QD40) produced 2.6 mg l−1 2-ethyl-3-hydroxyhexanoic acid (Fig. 5c). To validate whether 2-ethyl-3-hydroxyhexanoic acid was produced via enzymatic condensation of the butyryl starter unit and ethylmalonyl extender unit, we performed 13C-labelled l-valine feeding and observed both half and fully 13C-labelled 2-ethyl-3-hydroxyhexanoic acid, confirming its biosynthetic route (Supplementary Fig. 36). We also tested three other TEs as the termination domain; compared with the DEBS, pikromycin and Rim TEs, TR2-containing QD40 remained the best producer of 3-hydroxy acid. FkbS CCR overexpression in QD40 led to QD86 with an increased 2-ethyl-3-hydroxyhexanoic acid titre of 3.9 mg l−1, albeit still with no production of 2-E-1,3-HDO.
We reasoned that the endogenous ADHs in S. albus were not capable of reducing ethyl-branched aldehydes to diols, in agreement with our observation that the overexpression of Mycobacteroides abscessus carboxylic acid reductase (MaCAR) in QD40 (QD87) did not produce 2-E-1,3-HDO. Therefore, to enzymatically convert 2-ethyl-3-hydroxyhexanoic acid into 2-E-1,3-HDO, we tested three CARs (MaCAR, SrCAR and MmCAR from Mycobacterium marinum) and two ADHs (YahK and YjgB) in QD86; all the resulting QD88–QD93 microbes produced diastereomerically pure 2-E-1,3-HDO, with the SrCAR + YahK combination (QD89) producing the highest 2-E-1,3-HDO titre (3.0 mg l−1; Fig. 5d and Supplementary Fig. 37). Moreover, LC–MS peaks matching the theoretical [M + Na]+ m/z values of 2-E-1,3-BDO and 2-E-1,3-PDO were observed (Supplementary Fig. 38), together with 2-E-1,3-HDO, demonstrating the successful engineering of 2-ethyl extender units into our diol biosynthetic pipelines.
Bioproduction of amino alcohols via post-PKS transamination
Amino alcohols are also important speciality chemicals in the polymer and pharmaceutical industries, and they can be synthesized using the PKS platform that we constructed to synthesize diols. Moreover, most PKS pathways in nature have dedicated post-PKS decoration enzymes with extraordinary diversity and peculiarity, including TR-cognate transaminases, yet their application in PKS engineering has not been reported23,56. To explore this possibility (Fig. 6a), we synthesized the TA1 and TA2 genes from the coelimycin and B24891 BGCs, respectively, and integrated them into S. albus RimM0M1-TR1 (QD27) and RimM0M1-TR2 (QD28). The four resulting strains (QD94–QD97) successfully produced 4-aminobutan-2-ol, 1-aminopentan-3-ol and 1-aminohexan-3-ol, confirming the activity of TAs (Fig. 6b and Supplementary Figs. 39 and 40). Despite the fact that post-PKS TAs are often TR-cognate in natural PKSs, our choice of TAs was not strictly restricted by the TRs selected for PKS termination because QD96 with the TR2 + TA1 combination was the best producer of amino alcohol in R5 + 2% glucose (425.1 mg l−1 4-aminobutan-2-ol, 112.1 mg l−1 1-aminopentan-3-ol and 17.1 mg l−1 1-aminohexan-3-ol, 554.3 mg l−1 in total). Moreover, we successfully tuned the amino alcohol product profile using the same CoA substrate regulation strategies: 15 mM l-valine-supplemented QD98 (FkbS overexpression in QD96) cultures led to a dramatic increase in the 1-aminohexan-3-ol titre (from 17.1 mg l−1 to 364.4 mg l−1) and product ratio (from 3% to 70%). The AT exchange was also compatible with PKS-TR-TA-based branched-chain amino alcohol production as S. albus RimM0M1(RimM7 AT)-TR2 + TA1 + FkbS (QD99) produced 21.6 mg l−1 4-amino-3-methylbutan-2-ol as well as 1-amino-2-methylpentan-3-ol and 1-amino-2-methylhexan-3-ol (Fig. 6b and Supplementary Figs. 41 and 42).
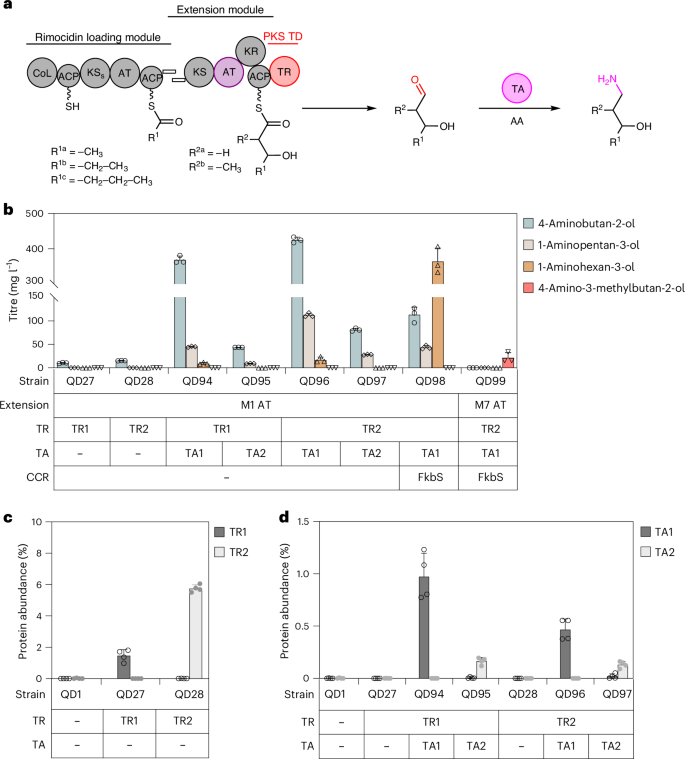
a, Schematic showing PKS-TR engineering via PKS TR-cognate transamination. AA, amino acid. In the substituent codes R1a/b/c and R2a/b, the notation a/b/c denotes different chemical groups that are accepted as substrates for the specified reactions. b, Bioproduction of 1-amino-3-alcohols in S. albus RimM0M1-TRs + TAs after cultivation for 7 d in R5 + 2% glucose. Note that 15 mM l-valine was also included in the QD98 and QD99 groups. In QD99, RimM7 AT exchange was applied in the production of the methyl-amino alcohol (n = 3). c,d, Protein abundance of TR1 and TR2 (c) and TA1 and TA2 (d) (n = 4). All cultivation data are presented as mean values; error bars indicate the s.d.
Source data
Next, we evaluated the impact of protein abundance on the amino alcohol titres. Proteomics analysis confirmed the expression of all of the genes incorporated in S. albus and showed a higher level of TR protein in RimM1-TR2 than in the RimM1-TR1 chimaera (Fig. 6c), explaining the higher product titres when using RimM1-TR2 to produce either 1,3-diols or amino alcohols. Furthermore, the TA1 protein level was five times higher than that of TA2 (Fig. 6d), also in agreement with the production data for amino alcohol. Together, these data demonstrate that an optimal protein expression level is key to high product titres by these engineered PKS systems in Streptomyces hosts.
Another possible key factor that may play a critical role in PKS-TR-based bioproduction is the intracellular NAD(P) level, as both PKS KRs and TRs are NADPH-dependent and many ADHs are NADH-dependent. We measured the NAD(P) levels in several of our engineered S. albus strains and concluded that they were similar in all tested strains (Supplementary Fig. 43), ruling out the possibility of cofactor influence on the observed product titres.
Discussion
Nature designs and produces a wide range of structurally complex molecules with modular type I PKSs, which provide parts to engineer megasynthases for a variety of unnatural molecules that would be difficult or impossible to biosynthesize in any other way. In this study, we developed PKSs with terminal thioreductases (TRs) to enable the biosynthesis of medium- and branched-chain aldehydes. Compared with previously established pathways that can be used to form C–C bonds, such as reverse β-oxidation57, PKSs have three major advantages. First, because PKSs liberate carbon dioxide during Claisen condensation, they have a thermodynamic advantage over thiolase-catalysed non-decarboxylative condensation reactions. Taking the 2-ethyl-3-hydroxyhexanoic skeleton as an example, the PKS biosynthesis route has a 3 kcal mol−1 advantage in Gibbs standard free energy over the thiolase pathway (Supplementary Table 5). Second, the PKS biosynthesis route is a platform that can be used to produce many different molecules because of the great structural diversity in the starter choice as well as the extender choice due to AT-gated substrate loading (for example, desmethyl, methyl, ethyl, allyl, hydroxy, methoxy and amino, to name a few50). This is particularly advantageous compared with other routes for adding branches at designated even positions. Furthermore, because of the stepwise catalytic nature and ACP protection of intermediates, PKS product profiles are more amenable to fine-tuning. Rim PKS naturally initiates with acetyl, propionyl and butyryl starter units, based on which we successfully engineered RimPKS-TRs for the bioproduction of a series of unbranched 1,3-diols, including the humectant 1,3-BDO. We also validated the plausibility of the canonical PKS AT exchange engineering strategy when terminating with TRs, presenting a platform suitable for medium-chain methyl- and ethyl-diol biosyntheses, featuring the insect repellent 2-E-1,3-HDO. Finally, natural PKS pathways provide enzymatic toolkits, including many post-PKS decoration enzymes. In this study, we showcased the TR-cognate TAs, incorporation of which led to bioproducts with a terminal amine in our engineered RimPKS-TR + TA hosts.
Moreover, we achieved tunable product profiles of RimPKS-TRs through substrate CoA pool engineering. PKS pathways are often tightly regulated in nature, as shown by the wide presence of PKS pathway-specific transcription regulators within the BGCs58 and the more recent discovery of pyrroloquinoline quinone gene clusters that co-evolved with PKS BGCs and enhanced natural product production59. Another common PKS-related regulation approach prioritizes regulating CoA substrate biosynthesis, investigation of which has benefited the identification of key steps in the engineering of such PKSs. For example, the biosynthesis of (2S)-ethylmalonyl-CoA in Streptomyces has been extensively investigated60: the major route is a CCR-catalysed reaction to convert crotonyl-CoA to ethylmalonyl-CoA, with propionyl-CoA carboxylase-catalysed butyryl-CoA carboxylation a minor pathway. Butyryl-CoA is a major product of l-valine catabolism, and multi-omics analysis revealed a strong suppression of CCR gene expression upon l-valine supplementation49. This observation is indicative of a CCR shortage in our engineered system and may dampen butyryl-based 1,3-HDO production; thus, we overexpressed a secondary FkbS or RimJ CCR and reversed the diol production ratio with a single step of engineering, leading to an increase in the 1,3-HDO product ratio from 33% to 77%.
Lastly, terminal TR domains in PKS BGCs have been reported in multiple biosynthetic studies, yet their application in PKS engineering is largely uninvestigated. A common theme of these natural TR-containing pathways is the production of amine through TR-catalysed reductive cleavage of the thioester bond and subsequent TA-catalysed transamination. TRs have been reported to be NADH-dependent, which was unexpected given the fact that all PKSs are secondary metabolic enzymes and similar PKS KRs are NADPH-dependent. In this study, we concluded that TRs are evolutionarily related to PKS KRs and are also NADPH-dependent. Moreover, our observation that TRs do not catalyse aldehyde reduction agrees with the fact that PKS TRs often have cognate TAs in the BGCs that react with TR-produced aldehydes. The inability of PKS TRs to reduce aldehydes separates them from NRPS Rs, many of which can catalyse four-electron reduction to produce alcohols19. The inability of CARs to reduce aldehydes during natural product chain termination has been widely investigated35. A conserved Asp residue was proposed to facilitate NADPH binding into a catalytic-ready conformation only in the presence of a PCP substrate, and not in the presence of a much smaller aldehyde substrate. When the Asp was mutated to glycine, SrCAR modestly reduced aldehydes to alcohols. This Asp residue is also conserved in all PKS TRs, suggesting a similar substrate recognition mechanism (Supplementary Fig. 5). For comparison, it has been reported that the presence of a CoA substrate does not affect the cofactor binding affinity of the NRPS R domains61. Moreover, a few NRPS R domains have been reported to catalyse the second two-electron reduction step much faster than the first reduction step18,19, but it is still unclear how these NRPS R domains control two-electron or four-electron reduction reactions on a molecular level. Notably, TRs are also widely present in other understudied secondary metabolisms, including putative iterative type I PKSs in Dictyostelium discoideum62,63.
Taken together, our study presents a comprehensive PKS-TR engineering strategy towards diols, amino alcohols and carboxylic acids that provides valuable toolkits for PKS retrobiosynthesis and lays the foundation for transforming PKS design schemes to produce unnatural alcohols and amines. Our engineering efforts may expand the narrow scope of available biosynthetic pathways for medium- and branched-chain products; further chemical diversification on the C1 aldehyde group can also generate polyketide-based alkenes and alkanes, many of which are interesting biofuel candidates and pharmaceutical intermediates.
Methods
Materials
S. albus J1074, S. coelicolor M1152, E. coli ET12567/pUZ8002, E. coli ET12567/pUB307 and E. coli BAP1 were collected as previously described64,65. Streptomyces rimosus subsp. rimosus (ATCC 10970) and Streptomyces natalensis (ATCC 27448) were purchased from ATCC. Streptomyces tsukubaensis (NRRL 18488) was purchased from NRRL. E. coli BL21(DE3), DH5α and DH10β were purchased from New England Biolabs.
The pSC and p41 Streptomyces integration vectors were collected as previously described66. The pOSV807 (Addgene 126600) and pOSV809 (Addgene 126602) Streptomyces integration vectors and pHIS (Addgene 29653) and pMBP (Addgene 29656) E. coli expression vectors were purchased from Addgene. The pG-KJE8 chaperone plasmid was purchased from Takara Bio.
1,3-Pentanediol and 2-ethyl-3-hydroxyhexanoic acid were purchased from BLDpharm. 1,3-Hexanediol, 2-methylpentane-1,3-diol, 2-methylhexane-1,3-diol, 4-aminobutan-2-ol, 1-aminopentan-3-ol, 1-aminohexan-3-ol and 4-amino-3-methylbutan-2-ol were purchased from Enamine. 3-Hydroxypentanoic acid was purchased from AmBeed. 3-Hydroxyhexanoic acid was purchased from Toronto Research Chemicals. (R)-(−)-1,3-Hexanediol was purchased from AA Blocks. All other chemicals were purchased from Millipore Sigma.
Cloning of integration plasmids and Streptomyces integration
All integration plasmids were constructed using the same Gibson assembly protocol with triparental conjugation into S. albus J1074 and biparental conjugation into S. coelicolor M1152. For S. albus J1074 triparental conjugation, using p41_rimB27 (p41 plasmid carrying Pgapdh(EL)-rimM1-TR1) as an example, we PCR-amplified the VWB integrase gene-containing p41 backbone, rimM1 piece and TR1 piece using PrimeSTAR GXL enzyme premix. The plasmid backbone and inserts were ligated through Gibson assembly, and the recombinant plasmid was then transformed into chemically competent E. coli DH5α for plasmid mini-preparation. The plasmid sequence was verified by whole-plasmid sequencing. The validated plasmid was subsequently transformed into chemically competent E. coli DH10β, which was selected on Luria-Bertani (LB) agar containing apramycin. Helper cells ET12567/pUB307 were also plated and selected on LB agar containing kanamycin and chloramphenicol. The integration plasmid-containing DH10β and helper cells ET12567/pUB307 were then inoculated in 10 ml LB broth at 37 °C with proper antibiotics until they reached an optical density (O.D.) of 0.4 at a wavelength of 600 nm. They were then centrifuged at room temperature to remove the remaining media, washed and finally resuspended in 1 ml LB. Next, 500 µl S. albus spores were heat-activated at 50 °C for 10 min and mixed with 250 µl plasmid-containing DH10β and 250 µl ET12567/pUB307. They were then concentrated to a final volume of 100 µl, plated on mannitol soy agar (2% mannitol, 2% soy flour and 10 mM MgCl2) and incubated at 30 °C for 16 h. Finally, 1 ml nalidixic acid (50 µg ml−1) and apramycin (50 µg ml−1) were overlaid to eliminate those S. albus that failed to integrate the recombinant plasmid.
For S. coelicolor M1152 biparental conjugation, using pSC_rimA0 (pSC plasmid carrying PrpsL(RO)-rimM0) as an example, the validated pSC_rimA0 plasmid obtained from E. coli DH5α was transformed into E. coli ET12567/pUZ8002 through electroporation. E. coli ET12567/pUZ8002, serving as the conjugal donor, was then grown and selected in 10 ml LB broth containing spectinomycin, kanamycin and chloramphenicol at 37 °C until it reached an O.D. value of 0.4 at 600 nm. The following conjugation procedure with heat-activated S. coelicolor M1152 spores and antibiotics overlay (1 ml of 50 µg ml−1 nalidixic acid and 400 µg ml−1 spectinomycin) was identical to that used for the triparental conjugation experiments.
The conjugated Streptomyces colonies were inoculated into 3 ml TSB medium with 2 or 3 plating beads in a 24-well block at 30 °C for 2 d and then 100 µl aliquots of culture were removed to verify successful integration via genome PCR amplification.
Streptomyces collection and cultivation
First, 100 µl of Streptomyces culture with successful integration was spread evenly over mannitol soy agar containing nalidixic acid (50 µg ml−1) and grown at 30 °C for 7 d to allow sporulation. Spores were then collected from the plate with 5 ml of 2× YT medium and filtered through a sterilized cotton syringe. The spore mixture was subsequently mixed with 5 ml of 60% glycerol stock and stored at −80 °C. For Streptomyces cultivation, spores were 1:100 inoculated in 3 ml TSB medium with two to three plating beads and cultured at 30 °C for 2 d. Then, 1 ml of Streptomyces seed culture was added to 30 ml broth in a 250 ml baffled shake flask for cultivation at 30 °C and 200 r.p.m. The media used in this study were prepared with the following components. TSB medium: 17 g tryptone, 3 g soytone, 5 g NaCl, 2.5 g K2HPO4 and 2.5 g glucose in 1 l deionized H2O (dH2O), pH 7.3. Standard R5 medium: 103 g sucrose, 0.25 g K2SO4, 10.12 g MgCl2·6H2O, 10 g glucose, 0.1 g Difco casamino acids, 5 g Difco yeast extract, 5.73 g TES buffer and 2 ml trace element solution in dH2O (1 l final volume). A trace element solution (1 ml) was prepared with 40 mg ZnCl2, 200 mg FeCl3·6H2O, 10 mg CuCl2·2H2O, 10 mg MnCl2·4H2O, 10 mg Na2B4O7·10H2O and 10 mg (NH4)6Mo7O24·4H2O. Before use, 100 ml R5 medium was mixed with 1 ml KH2PO4 (0.5%), 0.4 ml CaCl2·2H2O (5 M), 1.5 ml l-proline (20%) and 0.7 ml NaOH (1 N). ISP2: 4 g yeast extract, 10 g malt extract, 4 g dextrose in 1 l dH2O. ISP4: 10 g soluble starch, 1 g MgSO4·7H2O, 1 g NaCl, 2 g (NH4)2SO4, 2 g CaCO3, 1 ml trace salt solution (0.1 g FeSO4·7H2O, 0.1 g MnCl2·4H2O and 0.1 g ZnSO4·7H2O in 100 ml dH2O). M042 was prepared as previously reported14. Streptomyces culture (1 ml) was collected at different time points (maximum 10 d) for LC–MS analysis.
LC–MS sample preparation and analysis
First, 1 ml of Streptomyces culture was centrifuged at 4,000 g for 5 min. The soluble fraction was collected and subsequently mixed with the same volume of LC–MS-grade MeOH, vortexed for 10 s and centrifuged in Millipore Amicon Ultra-0.5 centrifugal filters (3 kDa) at 14,000 g for 15 min. The follow-through solution was diluted in 50% LC–MS-grade MeOH, to a 25-fold dilution if necessary, and analysed by LC–MS using an Agilent LC/MSD iQ single quadrupole mass spectrometer. Accurate mass measurements were performed using an Agilent 6520 Q-TOF LC/MS system.
For the detection and quantification of 1,3-diols or 3-hydroxy acids, 5 µl samples were injected onto a Phenomenex Kinetex XB-C18 LC column (2.6 µm, 100 mm × 3 mm, 100 Å) and analysed using the following HPLC protocol: buffer A: water with 0.1% (v/v) formic acid; buffer B: MeOH with 0.1% (v/v) formic acid; flow rate: 0.42 ml min−1; 20–72.1% buffer B gradient for 4.5 min, 72.1–95% buffer B gradient for 1.3 min, 95% buffer B for 3 min, 95–20% buffer B gradient for 0.2 min, 20% buffer B for 2.2 min; mass detection range: m/z = 50–400.
For the detection and quantification of amino alcohols, 5 µl samples were injected onto an Agilent ZORBAX Eclipse Plus C18 LC column (3.5 μm, 4.6 mm × 150 mm) and analysed using the following HPLC protocol: buffer A: water with 0.1% (v/v) formic acid; buffer B: acetonitrile with 0.1% (v/v) formic acid; flow rate: 0.40 ml min−1, 2% buffer B for 0.5 min, 2–13% buffer B gradient for 4.5 min, 13–80% buffer B gradient for 0.1 min; flow rate changed to 1.0 ml min−1, 80% buffer B for 2 min, 80–2% buffer B gradient for 3.1 min, 2% buffer B for 1.1 min; flow rate changed to 0.4 ml min−1, 2% buffer B for 1.1 min; mass detection range: m/z = 70–300.
GC–MS sample preparation and chiral analysis
The chiral GC–MS separation method was slightly modified from a previous report67, with an extra step of 1:1 (v/v) ethyl acetate extraction following the derivatization of the 1,3-diols with phenylboronic acid. Thus, 2 μl samples were injected onto an Agilent CycloSil-B GC column (30 m × 0.25 mm × 0.25 μm) with a 1:20 split ratio. The column oven setting was as follows: hold at 50 °C for 1 min, 20 °C min−1 ramp to 170 °C, 10 °C min−1 ramp to 230 °C, hold at 230 °C for 3 min.
Diol extraction and NMR analysis
After cultivation for 7 d, 500 ml QD76 cell culture was centrifuged at 4,000 g for 30 min to collect the soluble fraction. To 100 ml of the QD76 cell culture obtained above in an Erlenmeyer flask, 100 ml dichloromethane was added, followed by 200 g anhydrous sodium sulfate. The resulting slurry was allowed to stand at room temperature for 12 h. Water was removed through the formation of NaSO4·10H2O. The dichloromethane was removed by filtration and concentrated by rotary evaporation. The residue was purified by CombiFlash NexGen 300 to cleanly separate 1,3-hexanediol, 1,3-pentanediol and 1,3-butanediol. NMR spectra were acquired on a Bruker AV 600 MHz spectrometer for 1H NMR and a 150 MHz spectrometer for 13C NMR at the NMR facility of the College of Chemistry, University of California, Berkeley. Chemical shifts are reported in ppm downfield of tetramethylsilane and are referenced to the residual solvent signal (1H NMR: CDCl3 = 7.26 ppm; 13C NMR: CDCl3 = 77.16 ppm).
1,3-Diol/3-hydroxy acid/13C-labelled l-valine feeding
For the 1,3-diol/3-hydroxy acid feed experiments, 50 mg l−1 1,3-diol or 3-hydroxy acid was added to 30 ml R5 + 1% glucose and 1 ml of Streptomyces seed culture was then inoculated into the broth in a baffled shake flask for cultivation at 30 °C and 200 r.p.m. Culture samples were collected every 24 h for LC–MS quantification as previously described. For 13C-labelled l-valine feeding, 5 or 10 mM 13C-labelled l-valine was added to 30 ml R5 + 1% glucose. After Streptomyces seed culture inoculation, samples were collected for LC–MS analysis after cultivation for 3 d.
Cloning of expression plasmids
RimM0, pimS0, TADH2, ACP9, rimM1 ACP, TR1, TR2, TR7 and TR9 genes were cloned into the pHIS vector by ligation-independent cloning. ACP1 was cloned into the pMBP vector. The resulting plasmids (pHIS_rimA, pHIS_pimS0, pHIS_TADH2, pMBP_ACP1, pHIS_ACP9, pHIS_rimM1 ACP, pHIS_TR1, pHIS_TR2, pHIS_TR7 and pHIS_TR9) were transformed into DH5α and mini-prepped using the QIAprep Spin Miniprep Kit. All of the plasmid sequences were validated by whole-plasmid sequencing.
Protein expression and purification
For protein expression, pHIS or pMBP expression plasmid was co-transformed with pG-KJE8 plasmid into E. coli BL21(DE3). For pHIS_rimA or pHIS_pimS0, E. coli BAP1 was used for holo-protein expression. For the protein expression, 10 ml of overnight LB culture was inoculated into 500 ml Terrific Broth + 4% (v/v) glycerol with 50 μg ml−1 kanamycin and 25 μg ml−1 chloramphenicol in a 2 l baffled flask and incubated at 37 °C and 200 r.p.m. until an O.D. value of 0.6 at 600 nm was reached. The flask was then transferred to an ambient temperature of 20 °C, incubated for 1 h at 200 r.p.m. and induced with 1 mg ml−1 l-arabinose, 10 ng ml−1 tetracycline and 0.2 mM isopropyl β-D-1-thiogalactopyranoside (IPTG). After induction for 20 h, the cells were centrifuged at 4,000 g for 30 min and the cell pellet was collected and stored at −20 °C.
For protein purification, the cell pellet was resuspended in 50 ml lysis buffer (10% (v/v) glycerol, 300 mM NaCl, 20 mM imidazole, pH 7.5, 25 mM HEPES buffer, pH 7.5, 0.1 mg ml−1 lysozyme, 0.05 mg ml−1 DNase and 1 mM MgCl2) and vortexed for 30 min. To completely lyse the cells, sonication was applied at 4 °C. The cells were then centrifuged at 20,000 g for 30 min and the lysate supernatant was filtered and subsequently subjected to Nickel nitrilotriacetic acid (Ni-NTA) affinity chromatography at a flow rate of 4 ml min−1 and washed with ten column volumes of Ni-NTA buffer (10% (v/v) glycerol, 300 mM NaCl, 20 mM imidazole, pH 7.5, and 25 mM HEPES buffer, pH 7.5). The His-tagged protein was eluted with an imidazole gradient from 20 mM to 500 mM in 15 min. Fractions containing the target His-tagged protein were analysed by SDS–polyacrylamide gel electrophoresis (PAGE), pooled and incubated with 5 mM ATP (pH 7.0) for 1 h to completely dissociate attached chaperones. After incubation with ATP, the protein solution was concentrated using Amicon Ultra-15 centrifugal filters to a final volume of 4–5 ml. To achieve higher purity and better understanding of the protein oligomeric distribution, the protein solution was further subjected to size-exclusion chromatography (SEC) with a GE Hiload 16/60 Superdex 200 preparative-grade column equilibrated with 10% (v/v) glycerol, 50 mM NaCl and 25 mM HEPES, pH 7.5, at a flow rate of 1 ml min−1. SEC fractions were assessed by SDS–PAGE and ideal fractions were concentrated to 5–40 mg ml−1, aliquoted and flash-cooled in liquid N2, and stored at −80 °C. All proteins had >95% homogeneity, except for PimS0 with ~80% purity.
Crystallization and structural determination of CpkC TR
The CpkC TR sample was concentrated to 10 mg ml−1 in the same SEC buffer. The cofactor NADP+ was added before crystallization trials to a final concentration of 5 mM. The CpkC TR complexed with NADP+ was screened against a set of crystallization solutions: Berkeley Screen68, MCSG-1 (Anatrace), ShotGun (Molecular Dimensions), PEG/Ion, Index, Crystal Screen and PEGRx (Hampton Research). Crystals of CpkC TR were observed in Berkeley Screen condition B3 composed of 0.4 M sodium chloride, 0.1 M BIS-Tris, pH 6.5, and 30% poly(ethylene glycol) 3,350. A crystal of CpkC TR was placed in a reservoir solution containing 20% (v/v) glycerol and then flash-cooled in liquid nitrogen. The X-ray dataset for CpkC TR was collected at the Berkeley Center for Structural Biology beamline 5.0.1 at the Advanced Light Source at Lawrence Berkeley National Laboratory. The diffraction data were processed using the Xia2 program69. The crystal structure of CpkC TR–NADP+ was solved by molecular replacement with the PHASER program70 using the initial coordinates of the CpkC TR model generated by AlphaFold 2 (ref. 71). The atomic positions obtained from the molecular replacement showed two molecules of CpkC TR–NADP+ per asymmetric unit. The two CpkC TR–NADP+ molecules are similar, showing an r.m.s.d. value for the Cα of 0.301 Å with no difference of the active sites. The initial coordinates from the molecular replacement were used to initiate refinement within the Phenix suite72. Structure refinement was performed using the phenix.refine program. Manual rebuilding was conducted using COOT73. We calculated the r.m.s.d. for the ideal geometries for bond lengths, bond angles and dihedral angles using Phenix.refine74. The stereochemical quality of the final model of CpkC TR was assessed using the MolProbity program75. The crystal parameters, data collection and refinement statistics are summarized in Supplementary Table 4. RimM1 ACP-TR models were generated using AlphaFold 3. Structural illustrations were prepared using PyMOL (version 2.5.2).
Proteomics analysis
Streptomyces cultures were collected after 3 d and cells were extracted and stored at −80 °C until further processing. Protein was extracted from cell pellets and tryptic peptides were prepared following an established proteomic sample preparation protocol76. The resulting peptide samples were analysed on an Agilent 1290 UHPLC system coupled to a Thermo Scientific Orbitrap Exploris 480 mass spectrometer for discovery proteomics. Briefly, peptide samples were loaded onto an Ascentis ES-C18 column (Sigma–Aldrich) and eluted from the column using a 10 min gradient from 98% solvent A (0.1 % formic acid in H2O) and 2% solvent B (0.1% formic acid in acetonitrile) to 65% solvent A and 35% solvent B. Eluting peptides were introduced into the mass spectrometer operating in positive-ion mode and were measured in data-independent acquisition (DIA) mode with a duty cycle of 3 survey scans from m/z = 380 to m/z = 985 and 45 tandem MS (MS2) scans with a precursor isolation width of 13.5 m/z to cover the mass range. DIA raw data files were analysed using the DIA-NN integrated software suite77. The databases used in the DIA-NN search (library-free mode) were S. albus and S. coelicolor latest Uniprot proteome FASTA sequences plus the protein sequences of the heterologous proteins and common proteomic contaminants. DIA-NN determines mass tolerances automatically based on first pass analysis of the samples with automated determination of optimal mass accuracies. The retention time extraction window was determined individually for all MS runs analysed via the automated optimization procedure implemented in DIA-NN. Protein inference was enabled and the quantification strategy was set to Robust LC = High accuracy. Output main DIA-NN reports were filtered with a global false discovery rate (FDR) equal or lower than 0.01 on both the precursor level and the protein group level. The Top3 method, which is the average MS signal response of the three most intense tryptic peptides of each identified protein, was used to plot the quantity of the targeted proteins in the samples78,79. The generated MS proteomics data have been deposited in the ProteomeXchange Consortium via the PRIDE partner repository with the dataset identifier PXD055149 (ref. 80).
PimS0 substrate loading for enzymatic assays
PimS0 was added to a 100 μl mixture comprising 10% (v/v) glycerol, 50 mM NaCl, 25 mM HEPES, pH 7.5, 5 mM ATP, 1 mM acetate + CoA/malonate + CoA/acetyl-CoA/malonyl-CoA to a final concentration of 7.5 mg ml−1 to initiate the substrate loading reaction. At 1, 4 and 24 h, 20 μl of the reaction solution was quenched with 1% formic acid, flash-cooled in liquid N2 and stored at −80 °C for subsequent treatment. PimS0 with no substrate added to the reaction mix was taken as a negative control. Proteins in the reaction samples were precipitated by the addition of 1 mM NaCl and a fourfold volume of acetone, followed by two additional washes with 80% acetone in water. Proteins were resuspended with 100 mM ammonium bicarbonate, reduced in 5 mM tris(2-carboxyethyl)phosphine and alkylated in 10 mM iodoacetamide before subjecting to trypsin digestion. The resulting peptides were analysed using an Agilent 1290 Infinity LC system coupled to an Agilent 6460 QQQ mass spectrometer. Peptides (~10 μg) were separated on an Ascentis Express Peptide ES-C18 column (2.7 μm particle size, 160 Å pore size, 50 mm × 2.1 mm) fitted with a guard column (5 mm × 2.1 mm, Sigma Aldrich). The column was heated to 60 °C. The mobile phase consisted of 0.1% formic acid in H2O (solvent A) and 0.1% formic acid in acetonitrile (solvent B). Peptides were eluted from the column using a 3.5 min linear gradient from 95% solvent A and 2% solvent B to 60% solvent A and 40% solvent B. Peptides were ionized using an Agilent Jet Stream ESI source operating in positive-ion mode with the following source parameters: gas temperature = 250 °C, gas flow = 13 l min−1, nebulizer pressure = 35 psi, sheath gas temperature = 250 °C, sheath gas flow = 11 l min−1 and capillary voltage = 3,500 V. Dwell times were set to 18 ms. Data were acquired using Agilent MassHunter Data Acquisition. The multiple reaction monitoring (MRM) method for quantifying phosphopantetheine bearing peptides was built using Skyline. LC–MS raw data were imported and analysed in Skyline. The MRM transitions and their integrated peak areas are available on the LC–MS data sharing platform Panorama Public81 (https://panoramaweb.org/pks_diol_production_Dan_et_al.url).
Enzymatic assays of TR-catalysed reduction
Purified Sfp was purchased from NEB. To form holo-ACPs, Sfp was treated by separately adding purified apo-MBP-ACP1 and apo-ACP9 to a 500 μl reaction mixture comprising 10% (v/v) glycerol, 50 mM NaCl, 50 mM HEPES, pH 7.5, 2.5 mM octanoyl-CoA, 4 μM Sfp and 20 mM MgCl2 and incubated at 30 °C for 3 h. The reaction mixture was then placed in dialysis buffer (10% (v/v) glycerol, 50 mM NaCl and 50 mM HEPES, pH 7.5) at 4 °C for 3 h to remove any remaining free octanoyl-CoA. To study the substrate scope and cofactor preference of TR-catalysed reductions, TR1 and TR9 stored in buffer (10% (v/v) glycerol, 50 mM NaCl and 25 mM HEPES, pH 7.5) were each tested at 20 μM final concentration in a 200 μl reaction mixture containing any of the substrates (0.5 mM octanoyl-ACP, 1 mM octanoyl-CoA, 1 mM octanal, or 0.5 mM 3-hydroxybutyryl-CoA), along with either of the two cofactors (200 μM NADH and 200 μM NADPH). These experiments were conducted in a Corning 96-well clear-bottom black microplate. The absorbance at 340 nm was monitored to detect the elimination of NAD(P)H for a maximum of 16 h. All assays were repeated in duplicate.
Enzymatic assays of 1,3-diol oxidation
First, 300 μl of a reaction mixture comprising 10% (v/v) glycerol, 50 mM NaCl, 25 mM HEPES, pH 7.5, 0.5 mM NAD(P)+ and 20 mM alcohol substrate was added in a Corning 96-well clear-bottom black microplate. To initiate the reaction, TADH2 or TR1/TR2/TR7/TR9 enzyme was added to a final concentration of 0.4 μM. The absorbance at 340 nm was monitored to detect NAD(P)H accumulation for 2 h. All assays were repeated in triplicate.
ITC analysis
All ITC experiments were performed on a NanoITC device (TA Instruments). ACP, TR1 proteins and 3-hydroxybutyryl-CoA were diluted to the indicated concentrations in Protein Buffer (25 mM HEPES, pH 7.4, 50 mM NaCl and 10% glycerol). The sample chamber and syringe were each rinsed extensively with MilliQ water before loading. The sample chamber was filled with 1.2 ml of solution and a 250 µl syringe was filled with the titrant. MilliQ water was used in the reference cell. The sample chamber was allowed to equilibrate for 10 min before starting the experiment. The sample was further equilibrated to ensure that the variance and change in the temperature were minimal. Injections of the titrant were set to 10 µl with a wait time of 300 s. The data were processed using NanoAnalyze software (TA Instruments). The data were integrated to determine the heat of each injection. The values were corrected for dilution at each titration and then fitted to the Independent binding site model.
Intracellular NADP and NAD quantification
Measurements were conducted by following the manufacturer’s guidelines of the NADP/NADPH Quantification Kit and NAD/NADH Quantification Kit (Sigma Aldrich, MAK038 and MAK037, respectively). 1 ml of S. albus cells (relative O.D. is 10 at a wavelength of 600 nm) were collected after culturing in R5 medium for 3 d at 30 °C and 200 r.p.m. Cells were collected by centrifuging at 15,000 g and 4 °C for 5 min, the supernatants were discarded, and the cells were washed with pre-chilled PBS buffer at 15,000 g and 4 °C for 5 min, followed by discarding the PBS and adding 500 µl NADP/NADPH or NAD/NADH extraction buffer. Next, 0.5 mm glass beads (BioSpec Products, 11079105) were added for bead beating by the following process: 3,800 Hz for 30 s, on ice for 1 min, with three cycles in total. The extracted samples were placed on ice for 10 min, then centrifuged at 15,000 g and 4 °C for 10 min and the supernatant was filtered through a 10 kDa cut-off spin filter. The filtered samples were used for measurement using the quantification kits. All assays were repeated at least in duplicate.
Methods statement
No statistical methods were used to predetermine sample sizes, but our sample sizes were similar to those reported in previous publications14,64,66. Data distribution was assumed to be normal, but this was not formally tested. Data collection and analysis were not performed blind to the conditions of the experiments. Data points were not randomized or excluded from the analyses unless specifically described in previous subsections. Finally, the sequences of oligonucleotides used in this study are listed in Supplementary Table 2.
Reporting summary
Further information on research design is available in the Nature Portfolio Reporting Summary linked to this article.
Responses