A positron emission tomography tracer for the imaging of oxidative stress in the central nervous system
Main
Reactive oxygen and nitrogen species (RONS) mediate redox signalling and homeostatic cellular functions, but RONS imbalances also produce oxidative damage and promote ageing, diabetes, acute brain injury and neurodegenerative diseases, such as Alzheimer’s disease (AD)1,2,3. Under normal physiological conditions, RONS are important chemical modulators that provide efficient, essential signal transduction and an electron shuttle pathway for normal metabolism (oxidative eustress). However, when endogenous regulating cellular antioxidant pathways are overwhelmed or saturated (oxidative stress), the normally short-lived, low-concentration RONS initiate a cascade of radical chain reactions with the cellular environment (Fig. 1a). DNA, RNA, lipids and protein are liable to oxidative damage and cause cellular injury. Specifically, oxidative stress is the major cause of DNA damage and RNA polymerase stalling in the ageing process3. Lipids comprise the cellular membrane and are most easily oxidized by excessive RONS4. Hydroxyl radicals (OH•) are short-lived intermediates that react with a lipid or other carbon source to oxidize fatty acids in the plasma membrane and initiate a radical chain reaction in which a single peroxyl radical can generate thousands of molecules of lipid peroxide molecules5. The resultant cascade damages the plasma membrane, causing cell death and potentially impairing the function of surrounding cells, tissue and organ.

a, Under homeostasis, RONS production and elimination are tightly regulated (eustress). Disruption of this balance, oxidative stress, results in high levels of RONS that are damaging to biological systems. b, Scheme of a hypothesized mechanism of intracellular retention of [18F]F-OPB after [18F]FEDV reacts with RONS. We propose that, like its parent chemical edaravone, [18F]FEDV freely diffuses through the plasma membrane, reacts with intracellular RONS at physiological pH and produces unstable intermediates leading to [18F]F-OPB. The [18F]F-OPB cannot pass through the plasma membrane and is retained within the cell, thereby providing a PET signal. c, Scheme of the radiosynthesis of [18F]FEDV, a radiopharmaceutical analogue of edaravone. d, Quantification of the [19F]FEDV-to-[19F]F-OPB conversion after exposure to various oxidants for 5 min, 10 min, 15 min or 20 min. The tested oxidants, arranged in order of increasing reduction potential, included hydrogen peroxide (H2O2), tert-butyl hydroperoxide (t-BuOOH), nitroxyl (NO•), hypochlorite (ClO–), tert-butoxide (t-BuO•), water-soluble lipid peroxyl radicals [LOO•(aq)], and lipid-soluble lipid peroxyl radicals [LOO•(lip)], peroxynitrite (ONOO–) and hydroxide (OH•). Shown are the mean of three replicates. e, Quantification of cellular uptake (Bq per mg protein) of [18F]FEDV in N2a cells after exposure to 3 mM TBHP or TBHP with co-incubation of 100 μM edaravone. Shown are the mean ± s.e.m. of six replicates. f, Stability of [18F]FEDV in the final product reformulation solvent (5% ethanol in saline) and in human plasma. Shown are the mean ± s.e.m.; *P = 0.0386, ***P = 1.2 × 10⁻⁹, two-way ANOVA with Bonferroni post hoc test for significance.
Extensive evidence also supports the importance of peroxyl radicals and peroxynitrite in injury after cerebral ischaemia. Ischaemia (and/or ischaemia followed by reperfusion) substantially increases RONS through peroxyl radical or peroxynitrite chain reactions with cell membranes. The resulting chain reaction leads to ischaemic brain injury, manifested as oedema, infarction and neuronopathy6,7. Considerable evidence also supports a role in oxidative stress in the pathology and progression of AD8,9,10. Oxidative damage to proteins such as the proteosome and key proteins in glycolysis, TCA cycle and ATP synthase has been observed in preclinical AD, amnestic mild cognitive impairment and AD11,12. Increased levels of protein carbonyls are elevated in AD brain regions rich in Aβ plaques9. In addition, increased lipid peroxidation and 3-nitrotyrosine levels are observed in hippocampi of AD and amnestic mild cognitive impairment13,14,15. These observations suggest that RONS are important pathological mediators to monitor in acute brain injury and neurodegeneration and may be attractive targets for antioxidant and radical scavenger drug development in these diseases. However, measuring RONS in vivo is challenging, and past clinical trials evaluating antioxidant efficacy lack evidence that putative treatment reduces RONS in the brain, thereby confounding analyses of negative results16,17. Consequently, the inability to elucidate the optimal therapeutic window(s) for RONS impedes our ability to objectively evaluate treatment outcome, monitor disease progression and predict symptom onset or resolution. Hence, imaging methods or laboratory biomarkers that can quantify central nervous system (CNS)-derived RONS in vivo will facilitate the assessment of disease progression and the design of clinical trials of antioxidants.
Current assessments of RONS in living systems are largely limited to ex vivo measurements of oxidative injury18. Advances towards RONS detection in vivo include positron emission tomography (PET), electron paramagnetic resonance and hyperpolarized [13C] magnetic resonance imaging (MRI)19,20. Among these approaches, PET has superior spatial resolution and is well suited for clinical application, evidenced by many PET probes already used clinically to assess cerebral perfusion, oxygen and glucose metabolism, neuroinflammation and the accumulation of amyloid or tau proteins in the brains of patients with AD. To this end, several radiopharmaceuticals have been developed as potential PET-imaging probes for RONS but are limited by biological instability, poor blood–brain barrier (BBB) permeability or a narrow spectrum of RONS reactivity21,22,23,24,25,26. For example, [11C]ascorbic acid demonstrates limited BBB penetration22. Meanwhile, [18F]ROStrace and [11C]hydromethidine are effectively taken up by the brain, but their reactivity is limited to the short-lived superoxide radical (O2•–, t1/2 = 1–4 μs)24,25. Whether [64Cu]Cu-ATSM-PET detects hypoxia or RONS also remains uncertain26. 4-[18F]Fluoro-1-naphthol ([18F]FN) is a useful probe to image innate immune activation in vivo, since it selectively binds proteins and cells when oxidized by reaction of myeloperoxidase plus H2O2, but not H2O2 alone23.
We hypothesized that an analogue of edaravone (3-methyl-1-phenyl-2-pyrazolin-5-one) could serve as a radiopharmaceutical for PET imaging of RONS27. Edaravone was developed as a scavenger of peroxyl radicals (ROO•), a potent inducer of oxidative injury, and it also reacts with a broad spectrum of RONS, including hydroxyl (OH•), superoxide and peroxynitrite (ONOO–) in the lipid and aqueous phase, which presents a major advantage compared with other antioxidants whose reactivity is limited by phase solubility (for example, α-tocopherol; vitamin E) or impermeability to the BBB (such as disufenton sodium, NXY-059)27,28,29. Edaravone has an appropriate level of lipophilicity to passively diffuse across the BBB and cell membrane27. Intracellular reactions between edaravone and peroxyl radicals generate an unstable intermediate, which rapidly converts to 2-oxo-3-(phenylhydrazono)butanoic acid (OPB), which cannot freely pass through the cell membrane30. Edaravone was approved for treating acute ischaemic stroke in Japan in 2001 and for treating amyotrophic lateral sclerosis by the US Food and Drug Administration in 201731,32. We hypothesized that, like edaravone, [18F]fluoroedaravone ([18F]FEDV) may diffuse through the BBB and cell membrane and produce PET signals indicative of CNS-derived oxidative stress in vivo (Fig. 1b).
In this Article, we report the radiosynthesis of [18F]FEDV and its RONS-reactivity spectrum, stability and utility as a PET-imaging probe of CNS oxidative stress in three mouse models: intrastriatal injection of sodium nitroprusside (SNP), middle cerebral artery (MCA)-targeted photothrombotic stroke and transgenic P301S (PS19) mice, a popular model of AD33. We also investigated whether dynamic PET imaging with parametric mapping can increase the sensitivity of [18F]FEDV to RONS in vivo.
Results
The probe [18F]FEDV was synthesized in a two-pot, three-step radiochemical reaction (Fig. 1c). First, we synthesized the precursor (1), boc-protected diazo trimethylammonium triflate salt, from 4-fluorophenylhydrazine in four straightforward, high-yielding steps34 (Extended Data Fig. 1). In the next step, we performed nucleophilic aromatic substitution of (1) with [18F]fluoride to produce (2), with a nearly complete reaction in 60 s. This reaction was briefly purified via solid-phase extraction and then transferred (2) to a new reactor vial that was previously charged with zinc dust by acetic acid elution. The final product, [18F]FEDV, was generated by concurrent deprotection and condensation after we added ethyl acetoacetate and hydrochloric acid to the reactor vial and heated it for 20 min. The identity of [18F]FEDV was verified by HPLC co-injection with a fully characterized fluorine-19 standard. Overall, [18F]FEDV was synthesized with 12% ± 1% (n = 8) activity yield after HPLC purification and reformulation in 60 min. This straightforward radiosynthesis method produced [18F]FEDV with >99% radiochemical purity.
In vitro characterization of [18F]FEDV
Next, we examined the reactivity spectrum of [19F]FEDV with major oxidants in vitro and tested whether [19F]FEDV would react with both lipid- and water-soluble peroxyl radicals, similar to its parent chemical edaravone27. We found that [19F]FEDV (50 μM) completely converted to [19F]F-OPB within 5 min when incubated with hypochlorite (ClO–), peroxynitrite, hydroxide (OH•), nitroxyl (NO•), tert-butoxide (t-BuO•), or lipid peroxyl radicals in aqueous [LOO•(aq)] or lipid [LOO•(lip)] solutions (Fig. 1d). By contrast, [19F]FEDV demonstrated very low reactivity to hydrogen peroxide (H2O2) and tert-butyl hydroperoxide (t-BuOOH), which is also similar to its parent chemical, edaravone27. These results suggest that [19F]FEDV potently reacts with a broad spectrum of RONS, including both lipid- and aqueous-phase peroxyl radicals across a wide range of reduction potentials.
We then tested whether [18F]FEDV accumulates in t-butyl hydrogen peroxide (TBHP)-treated neuroblast cells (N2a), as TBHP is known to induce lipid peroxidation and protein carbonylation35,36,37, as well as doxorubicin-treated mouse mammary adenocarcinoma EMT6 cells, a popular cell culture model of oxidative stress generally known to produce nitrosative oxidative stress such as nitric oxide and peroxynitrite38. Indeed, when N2a and EMT6 cells were incubated with [18F]FEDV and evaluated 0.5–3 h after TBHP or doxorubicin treatment, the cell-associated radioactivity (Bq per mg protein) increased rapidly up to 2 h post-treatment (Fig. 1e and Extended Data Fig. 2a). Notably, the cellular uptake of [18F]FEDV after TBHP and doxorubicin treatment was blocked in the presence of 0.1–10 mM non-radioactive edaravone, supporting the RONS specificity of [18F]FEDV-associated radioactivity in cells (Extended Data Fig. 2a).
To test the suitability of [18F]FEDV for imaging RONS in vivo, we compared the stability of [18F]FEDV in 5% ethanol/saline (reformulation solution) and human plasma. In the reformulation solution, [18F]FEDV showed remarkable stability, with >99% of [18F]FEDV unchanged after 8 h. The probe also remained >90% intact after 3 h in human plasma, suggesting high stability and minimal radiolysis of [18F]FEDV (Fig. 1f). Together, these results suggest that [18F]FEDV has a broad reactivity spectrum to RONS and favourable stability for in vivo imaging.
Imaging SNP-induced oxidative stress in vivo
To test the potential of [18F]FEDV as a PET-imaging probe for RONS in vivo, we first used intrastriatal injection of SNP, Na2[Fe(CN)5NO], to induce oxidative stress39. Despite being a nitric oxide donor, SNP also produces superoxide and other RONS, leading to the formation of peroxynitrite and lipid peroxidation25,39. We injected the striata of mice with saline or 20 nmol SNP and allowed them to recover for 60 min before [18F]FEDV-PET imaging. In pilot experiments using dihydroethidine (DHE) as a tracer of RONS, SNP-injected mice showed more intense oxidized dihydroethidine (oxHET) labelling than did saline-injected mice on postmortem fluorescence microscopy images (Fig. 2a). Similarly, the SNP-injected mouse brain showed robust ipsilateral [18F]FEDV-PET signals (Fig. 2b). Striatum-focused time activity curves (TACs) revealed significantly stronger mean [18F]FEDV-PET signals in SNP-injected mice than in saline-injected mice (Fig. 2c; P < 0.001, n = 4 for each treatment). Modelling clinical workflow for PET scans, we generated standard uptake values (SUVs) in saline-treated versus SNP-treated mice at 45–60 min after the intravenous injection of [18F]FEDV. Our analysis showed significantly higher maximum SUV in SNP-injected mice than in saline-injected mice (Fig. 2d; P < 0.001, n = 4 for each treatment). To confirm the specificity of [18F]FEDV for RONS in vivo, we performed a blocking study in which SNP-injected mice were pre-treated with 15 mg kg−1 edaravone intravenously 5 min before [18F]FEDV injection and these mice were imaged with PET/computed tomography (CT) from 45 min to 60 min post-injection. Prophylactic edaravone treatment markedly reduced the [18F]FEDV-PET signal in SNP mice, showing no statistically significant differences (P = 0.62) in mice intrastriatally injected with saline. These results further indicate that [18F]FEDV is specific to RONS in vivo.

Adult male C57BL/6 mice were subjected to intrastriatal injections of saline or 20 nmol SNP (Na2[Fe(CN)5NO]), followed by [18F]FEDV-PET/CT imaging 1 h later (n = 4 for each). a, Scheme of SNP injection and activity. SNP not only functions as a nitric oxide donor but also induces peroxynitrite (ONOO–) and causes lipid peroxidation39. Also shown are fluorescence microscopy images of oxidized hydroethidine (oxHET) in the striatum of mice that received either an SNP or saline injection. b, Axial (top) and coronal (bottom) [18F]FEDV-PET/CT images of mice that received intrastriatal injection of saline (left) or SNP (right). c, The TACs of [18F]FEDV in the striatum of SNP- or saline-treated mice (n = 4 for each). d, Summation of [18F]FEDV, [18F]FN and [18F]FDG signals in the striatum 45–60 min post-injection to generate the maximal standardized uptake value (SUVmax) in each condition (n = 4 for each). Note that ‘SNP block’ refers to pre-treatment with 15 mg kg−1 of edaravone 5 min before [18F]FEDV injection. Shown are mean ± s.e.m.; P = 8.1 × 10⁻⁹ (SNP versus saline), P = 3.8 × 10⁻⁹ (SNP versus SNP block), one-way ANOVA with Bonferroni post hoc test for significance.
For comparison, we applied [18F]FN, the redox-tuned PET probe for innate immune activation23, and found no evidence of increased PET signal at 60 min in SNP mice. Likewise, SUV of [18F]FN showed no significant differences (Fig. 2d; P = 0.921, n = 4 for each treatment) between SNP-treated versus saline-injected mice at 45–60 min post-[18F]FN injection. These results suggest that the SNP-induced [18F]FEDV-PET signal is not due to innate immune activation, rather edaravone-specific RONS. We also tested whether [18F]FDG could differentiate SNP-treated versus saline-treated mouse brain. We observed robust PET signal in both SNP-treated and saline-treated mice (Extended Data Fig. 3); however, no significant differences in SUV were observed (Fig. 2d; P = 0.168, n = 4 for each treatment) between saline-treated and SNP-treated mice. These results indicated that [18F]FEDV-PET imaging is sufficient to detect SNP-induced oxidative stress in vivo.
Imaging post-stroke oxidative stress with [18F]FEDV-PET
Next, we induced unilateral photothrombosis (PT) stroke in mice to test whether [18F]FEDV detects RONS in vivo in a clinically relevant model40. Mice were injected with rose bengal dye retro-orbitally, exposed to 543 nm laser beam illumination at the proximal branch of the MCA and then imaged via [18F]FEDV-PET 4 h or 24 h later. Mice in the sham group also received MCA-focused laser illumination but without rose bengal dye injection.
At 4 h post-PT, we detected no significant difference in the PET signal between the sham-treated or stroke-injured mouse brains, but at 24 h post-PT, the [18F]FEDV-PET signal was markedly increased in the ipsilateral cerebral cortex of the stroke-injured mice (Fig. 3a; n = 3 for each group). Focused [18F]FEDV TACs at the ipsilateral cerebral cortex showed a steadily increased and sustained [18F]FEDV-derived PET signal at 24 h post-PT but rapid wash-in/wash-out kinetics in the sham-treated or 4 h post-PT brains (Fig. 3b). Focused TACs also revealed no difference between the sham and contralateral cerebral cortex of post-PT mice (Fig. 3b). Accordingly, static PET imaging at 45–60 min post-[18F]FEDV injection showed a higher average SUV at 24 h post-PT than at 4 h post-PT (Fig. 3c; P < 0.001). Notably, the ipsilateral cerebral cortex of stroke-injured mice showed more malondialdehyde (MDA), a marker of lipid peroxidation41, than did the contralateral cortex at 24 h but not at 4 h post-PT (Fig. 3d; n = 4 for each). We also studied [18F]FN in the PT model; however, no differences were observed in the PET signal or SUV in ipsilateral–contralateral regions of interest (ROIs) drawn in the PT mouse brain, which was also verified ex vivo with gamma counting of collected brain tissue (Extended Data Fig. 4; P = 0.913, n = 3). These results, corroborated by SUV analysis and gamma counting of brain tissue ex vivo (Extended Data Fig. 4b–d), suggest that induction of oxidative stress (positive [18F]FEDV-PET signal) occurs without increased innate immune activation (negative [18F]FN) 24 h post-PT.
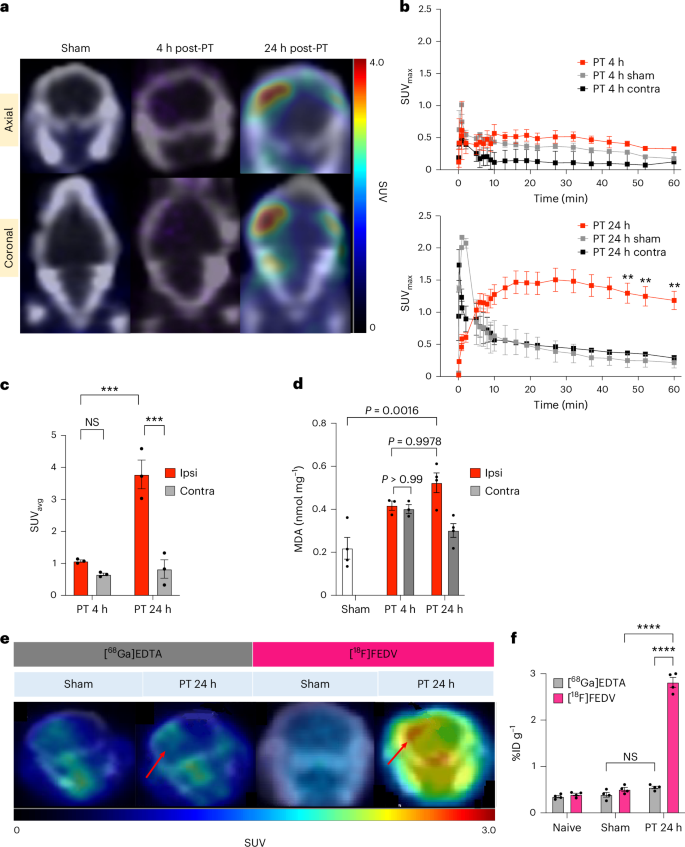
Adult male C57BL/6 mice were subjected to unilateral MCA-targeted PT, followed by [18F]FEDV-PET/CT imaging at 4 h or 24 h later to detect stroke-induced RONS in vivo (n = 4 for each time point). a, Axial (top) and coronal (bottom) PET/CT images of [18F]FEDV in mice treated with saline (left) or rose bengal dye (middle, right), followed by 543 nm laser stimulation at the proximal MCA branch. Mice were imaged at 4 h (middle) or 24 h (right) post-PT. Note the robust [18F]FEDV signals in the ipsilateral cortex at 24 h, but not at 4 h, post-stroke. b, The SUVmax curves and quantifications showed significant retention of the [18F]FEDV-PET signal in the ipsilateral (ipsi) cortex at 24 h (bottom) but not at 4 h (top) or in the contralateral (contra) cortex after stroke (n = 3 each; **P = 0.0011; shown are the mean ± s.e.m.; two-way ANOVA with Bonferroni post hoc test for significance). c, Mouse PET data were summed 45–60 min post-injection to generate SUVavg (n = 3 each; ***P = 0.00045 (24 h ipsi versus 4 h ipsi), ***P = 0.00025 (24 h ipsi versus 24 h contra), not significant (NS) (P = 0.70); one-way ANOVA with Tukey post hoc test for significance; shown are the mean ± s.e.m.). d, Ex vivo quantification of MDA in brain extracts showed a rise of lipid peroxidation in the ipsilateral cortex at 24 h but not at 4 h post-stroke (n = 4 for the sham group, n = 3 for each time point in the PT group; two-way ANOVA). e, Representative PET imaging of [68Ga]EDTA and [18F]FEDV at 24 h after saline (sham) or rose bengal injection (PT), followed by laser illumination at the proximal MCA branch (n = 3 for each group). Note the robust rise of the [18F]FEDV signal in the ipsilateral site of the infarction (red arrows), as [68Ga]EDTA signal, when compared with the contralateral cortex or in sham-treated brains. f, Ex vivo gamma counting of [68Ga]EDTA or [18F]FEDV radioactivity in naive mice and the ipsilateral cortex of sham-treated versus PT mice at 24 h (n = 4 each; ****P = 2.7 × 10⁻¹⁴ (PT 24 h FEDV versus PT 24 h GaEDTA), ****P = 2.8 × 10⁻¹⁴ (PT 24 h FEDV versus sham FEDV), NS (P = 0.367), two-way ANOVA with Tukey post hoc test for significance; shown are mean ± s.e.m.). Note the significant increase of [18F]FEDV but not [68Ga]EDTA radioactivity in the PT group, suggesting that the rise of post-stroke [18F]FEDV signals is not due to BBB breakdown.
Ischaemic stroke compromises the BBB40; thus, we sought to ensure that the observed increase in the [18F]FEDV-PET signal was not merely due to BBB leakage at 24 h post-PT. We injected [18F]FEDV or [68Ga]EDTA, a non-specific radiopharmaceutical that accumulates in the CNS when the BBB is compromised42, in sham-treated and at 24 h post-PT mice and compared the levels (n = 3 for each group).
Again, the 24 h post-PT mouse brain showed a large increase of the [18F]FEDV signal in the ipsilateral cortex (red arrows, Fig. 3e) and a higher baseline in both hemispheres than those in the sham-treated mouse brains. By contrast, 24 h post-PT mouse brains showed only a very small increase of [68Ga]EDTA-associated radioactivity in the ipsilateral cortex, compared with contralateral cortex or sham-treated brains (Fig. 3e). This finding was corroborated by total radioactivity counts in the ipsilateral hemisphere of postmortem brains after PET scan (Fig. 3f; P < 0.001, n = 4 for each group). Together, these results suggest that the increased [18F]FEDV-PET signal at 24 h post-PT is not caused by extravasation alone.
Dynamic [18F]FEDV-PET imaging of oxidative stress
The MDA assay is an indirect measure of RONS as it quantifies oxidative damage (lipid peroxidation, although its specificity is suboptimal18), rather than a specific reaction with RONS5. Thus, we used the fluorescence of oxHET in postmortem brains to test the timing of oxidative stress onset in the PT stroke model. This experiment showed a significant increase of oxHET signals in the ipsilateral cerebral cortex at 4 h and 24 h post-PT, suggesting rapid onset of oxidative stress (Fig. 4a; P < 0.001, n = 4 for each condition). Similarly, ex vivo brain autoradiography after [18F]FEDV-PET imaging also showed retention of radioactivity in the ipsilateral cortex at both 4 h and 24 h post-PT (red arrows, Fig. 4b). These results suggest that static SUV analysis, although common in clinical workflow, may underestimate the uptake of [18F]FEDV in small rodent brains, because it does not discern PET signal from the blood pool versus that from tissue43,44.

Adult male C57BL/6 mice were injured by MCA-targeted PT, followed by dynamic [18F]FEDV-PET imaging for 60 min at 4 h or 24 h post-stroke (n = 4 for each time point). After PET imaging, mice were immediately transferred and imaged by 9.4 T MRI to detect stroke injury by T2-weighted images and differentiate VOIs. The PET/MRI images were then co-registered to calculate the rate of tracer uptake (Ki) in VOIs. a, Top: representative confocal microscopic images of oxidized hydroethidine (oxHET, red) and DAPI (blue) in sham-treated versus stroke-injured mouse brains at 4 h post-PT. Bottom: the fluorescence of oxHET+ cells increased significantly at both 4 h and 24 h post-PT (n = 4 each, one-way ANOVA with Tukey post hoc correction for significance; shown are mean ± s.e.m.). b, Representative autoradiography of [18F]FEDV-injected mouse brains collected after PET/MRI imaging at 4 h or 24 h post-PT. Note the increase of [18F]FEDV signals (red arrows) in ex vivo autoradiography at both time points. c, Dynamic PET/MRI imaging with parametric mapping shows enhanced uptake of [18F]FEDV at the sites of T2-indicated stroke injury (yellow arrows) at both 4 (left) and 24 h (right) post-PT. d, Quantification of the Ki of [18F]FEDV uptake at the ipsilateral side or cortical infarction (blue), compared with that of the contralateral VOI (orange) or sham (grey and yellow), at both 4 h and 24 h post-PT (n = 4 for each group). Shown are mean ± s.e.m. ****P = 5.6 × 10⁻⁷ (PT 4 h right stroke versus PT 4 h left stroke), ****P = 1.4 × 10⁻⁶ (PT 4 h left stroke versus PT 4 h left sham), ****P = 9.9 × 10⁻⁵ (PT 24 h right stroke versus PT 24 h left stroke), ****P = 1.02 × 10⁻⁹ (PT 24 h left stroke versus PT 24 h left sham), two-way ANOVA with Tukey post hoc correction for significance.
We tested whether dynamic [18F]FEDV-PET imaging with parametric mapping would enhance the probe’s sensitivity to detect RONS in the post-PT mouse brain43,45,46. Mice received [18F]FEDV intravenously and were dynamically imaged by PET at 4 h or 24 h post-PT for 60 min. After completion of the PET scan, mice were immediately imaged by T2 MRI to determine the ischaemic area from which we delineated volumes of interest (VOIs) to quantify the rate of [18F]FEDV uptake in tissue (Ki) between ipsilateral and contralateral hemispheres in post-PT or sham-treated animals (n = 4 for each group). This analysis showed enhanced [18F]FEDV uptake in the ipsilateral cortex at both 4 h and 24 h post-PT, co-localized with T2 MRI signal (yellow arrows, Fig. 4c). Accordingly, parametric mapping showed significantly greater Ki within VOIs at both 4 h and 24 h post-PT, compared with that in VOIs in the contralateral hemisphere or both hemispheres of sham-treated mouse brains (Fig. 4d; P < 0.001, n = 4 per group). These results suggest that dynamic PET imaging with parametric mapping markedly enhanced the sensitivity of [18F]FEDV to detect RONS in vivo.
[18F]FEDV-PET imaging of PS19 tauopathy mice
Lastly, we used [18F]FEDV-PET to compare the brains of heterozygous PS19 and wild-type (WT) mice, because oxidative stress has been implicated as a pathogenic mechanism of AD2. PS19 mice express the human P301S mutant tau with evident protein carbonyls in the cortical mitochondrial fraction from 10 months of age, but so far, no in vivo imaging studies quantifying RONS in PS19 mice have been reported33,47.
In our study, [18F]FEDV-PET/MRI imaging showed markedly increased PET signal in 12-month-old male heterozygous PS19 mice, when compared with age-matched male WT mice (Fig. 5a; n = 6 for each group). SUV analysis showed a marked increase of [18F]FEDV uptake in most brain regions, including the hippocampus, striatum, thalamus, hypothalamus, amygdala, midbrain, cerebellum and brainstem (Fig. 5b; n = 6; *P < 0.05, **P < 0.01, ***P < 0.001). We also studied whether [18F]FDG reveals differences between PS19 and WT mouse brains, since impaired glucose metabolism is a hallmark of advanced AD pathology16.

[18F]FEDV-PET/MRI was used to compare male P301S (PS19) mice and WT mice (both at 12 months of age, n = 6 for each group). Dynamic imaging of the mice was performed with [18F]FEDV-PET for 60 min and then immediately transferred and imaged by 9.4 T MRI for anatomical identification. a, Summed [18F]FEDV-PET/MRIs (45–60 min) reveal widespread enhanced uptake in PS19 mice, compared with that in age-matched WT mice. b, SUV analysis shows significantly higher [18F]FEDV-PET signal in nearly all ROIs in PS19 mice (red) than in age-matched WT mice (grey). ROIs were generated using the Ma–Benveniste–Mirrione atlas on MRI, and PET signal in ROIs was quantified (n = 6 for each group; ***P = 0.00073 (midbrain PS19 versus midbrain WT), one-way ANOVA). c, Representative microscopy images of oxHET fluorescence and quantification of oxHET+ cells in the hippocampus of PS19 mice and age-matched WT mice (n = 4 for each group, two-way ANOVA). d, Representative immunohistochemical staining and quantification of phosphorylated tau (AT8) in the hippocampus of PS19 mice and WT mice (n = 4 for each group, two-way ANOVA). Shown are mean ± s.e.m.
Yet, no significant reduction in [18F]FDG-PET SUV analysis was observed in 12-month-old PS19 mice compared with age-matched WT mice (Extended Data Fig. 5; n = 4 for each group), suggesting high sensitivity of [18F]FEDV-PET compared with [18F]FDG-PET in detecting AD-like abnormalities in PS19 mice.
Finally, we performed oxHET labelling after [18F]FEDV-PET/MRI imaging to validate RONS-PET signal ex vivo. This analysis showed a significant increase of oxHET+ cells in the hippocampus of PS19 mice compared with WT mice on postmortem fluorescence microscopy (Fig. 5c; P < 0.01, n = 4 per group). Similarly, PS19 mice showed a higher level of phosphorylated tau (AT8) staining in the hippocampus than did WT mice (Fig. 5d; P < 0.05, n = 4 per group). These results suggest that [18F]FEDV imaging via the clinical standard static PET is sufficient to detect greater oxidative stress in the brains of 12-month-old PS19 tauopathy mice.
Discussion
The pathology underlying neurodegenerative diseases, including amyotrophic lateral sclerosis, Huntington’s disease, AD and AD-related dementia (ADRD), starts years before symptoms appear, and the rate of progression varies individually. For example, the dementia stage of AD is preceded by the preclinical stage (normal cognitive behaviour, but biochemical evidence of change) and prodromal period (mild cognitive impairment). Hence, molecular and imaging biomarkers that can detect the onset of CNS-derived pathology would be of great value in evaluating disease progression and patient selection for early intervention48,49,50. The current tools used to diagnose AD/ADRD include measuring amyloid-β peptides (Aβ), tau protein (total or AT8) and protein panels in the blood or cerebrospinal fluid49,51. Amyloid-PET and tau-PET scans are the two most commonly used imaging biomarkers for AD, since they directly assess the accretion and regional spreading of amyloid plaque and tau fibrils in the brain. MRI and FDG-PET are also useful for detecting brain atrophy and impaired glucose metabolism, respectively, in advanced AD and frontotemporal dementia52. However, a glaring deficiency in AD-related and neurodegenerative disease imaging biomarkers is our inability to detect CNS oxidative stress in vivo.
Growing evidence indicates that excessive oxidative stress (beyond eustress) contributes to both acute brain injury and chronic neurodegeneration, such as AD and ADRD1,2,3. Oxidative stress in AD/ADRD arise from dysfunctional mitochondrial oxidative phosphorylation, reduction of antioxidants, and amyloid-β or tau oligomer-induced neurotoxicity or microglia-secreted RONS, which accelerate ageing or provoke neurodegeneration2,53. Consistent with this view, genetic depletion of Nrf2, a master regulator of cellular antioxidant responses, exacerbates cognitive deficits and amyloid-β deposition in a mouse model of AD54. As such, oxidative stress may be a promising therapeutic target in AD/ADRD, but several practical challenges limit the ultimate objective to longitudinally quantify oxidative stress in a clinical research setting.
First, direct measurement of RONS in vivo is challenging, owing to their unstable nature and short half-life. Current approaches rely on indirect measurements of oxidative damage in postmortem brains or measuring surrogate biomarkers in blood or urine (for example, 8-OHdG, isoprostane 8 and 12-iso-iPF2α-IV)49, which may or may not represent the microenvironment of the brain in living patients. Second, as there are no clinical-imaging tools to measure oxidative stress in the brain in vivo, our ability to objectively evaluate the efficacy of antioxidants is substantially limited. For example, a previous clinical trial using vitamin E (a lipid phase-only antioxidant) showed negative results in preventing patients with mild cognitive impairment to progress into dementia17. However, it remains uncertain whether RONS are a poor therapeutic target for AD, whether vitamin E is an inefficient antioxidant limited to lipid-phase RONS reactivity, or the dose of vitamin E administered is simply inadequate to reduce RONS in the brain.
In view of these unmet clinical needs, we developed an in vivo PET-imaging probe to detect RONS levels in the CNS based on the well-characterized, clinically used antioxidant edaravone27. We showed that adding fluorine-18 to edaravone, a Food and Drug Administration-approved antioxidant, retained a broad reaction spectrum to multiple RONS, including lipid- and water-soluble peroxyl radicals and peroxynitrite. Importantly, [18F]FEDV readily crossed the BBB and plasma membrane, a prerequisite for successful RONS-PET imaging. The radiosynthesis of [18F]FEDV was a straightforward nucleophilic aromatic substitution reaction, followed by reduction, deprotection and condensation. This robust synthesis afforded [18F]FEDV in high radiochemical yield, purity and molar activity (Extended Data Figs. 6–9). In addition, [18F]FEDV has a high solution stability, despite 18F-labelled radiopharmaceuticals often suffering from radiolytic decomposition that hinders the development of PET-imaging probes55,56. Finally, we quantified the biodistribution of [18F]FEDV in mouse organs ex vivo and showed that [18F]FEDV distribution and clearance is in agreement with previously characterized data for edaravone in humans (Extended Data Fig. 10). Thus, [18F]FEDV has the chemical reactivity and biological compatibility that is essential to study a myriad of disorders in which RONS contribute to disease pathology.
We assessed [18F]FEDV-PET imaging in three in vivo models of acute and chronic neurodegeneration and compared correlative biomarkers and quantification methods in this study. First, [18F]FEDV demonstrated markedly increased PET signals in the ipsilateral hemisphere after intrastriatal injection of SNP, a popular model for chemical-induced CNS oxidative stress25. By contrast, neither [18F]FDG nor [18F]FN was able to differentiate sites of oxidative stress from the contralateral hemisphere or saline-injected brains. As [18F]FDG measures glucose uptake in cells, high non-specific signal in the mammalian brain often limits the biological specificity in which [18F]FDG can be applied for disease interpretation. Indeed, intrastriatal injection of SNP elevated [18F]FDG signals without differentiating the injection site from the contralateral hemisphere. [18F]FN is a redox-tuned PET-imaging probe that selectively binds proteins and cells when oxidized by products of myeloperoxidase and H2O2, making it ideal and specific for detecting innate immune activation23. Consequently, intrastriatal injection of SNP failed to show elevated [18F]FN-PET signals, despite readily induced oxHET-labelling and [18F]FEDV-PET signals. These findings underscore the differences and complementary nature between [18F]FEDV and [18F]FN as radiopharmaceuticals: [18F]FN-PET detects a context-specific process, while [18F]FEDV may be more suited for broad-spectrum RONS detection.
The differing properties of [18F]FEDV and [18F]FN were also evident in our experimental stroke model. Many investigations have shown that cerebral ischaemia induces RONS that contributes to infarction and secondary thrombosis57,58; edaravone has been used to treat patients with acute ischaemic stroke in Japan for over 20 years and was recently shown to improve National Institutes of Health Stroke Scale scores after an ischaemic stroke31. Although edaravone is approved for use within 24 h of stroke onset, it is most effective if administered within 3 h (ref. 59). Accordingly, our stroke model (MCA-aimed PT) readily increased [18F]FEDV signals (Fig. 3), which correlated with biochemical evidence of lipid peroxidation (as shown in the MDA assay), but failed to show increased [18F]FN-PET signal (Extended Data Fig. 4). These results again suggest that [18F]FEDV is more suitable for detecting a broad spectrum of oxidative stress, when compared with [18F]FN. We also compared the measurement of [18F]FEDV-PET signals using semi-quantitative SUV and dynamic imaging45,46,60. Similar to Statistical Parametric Mapping61, graph-based dynamic imaging uses a VOI-based method to calculate the blood-to-tissue uptake (Ki) of a radiopharmaceutical and can improve the sensitivity of [18F]FDG-PET in humans45. Likewise, dynamic imaging greatly increased the sensitivity of [18F]FEDV-PET imaging to RONS at 4 h post-stroke, which was more sensitive than the biochemical MDA assay but similar to the sensitivity of oxHET labelling and ex vivo autoradiography in postmortem brains. Together, these results suggested that [18F]FEDV-PET, with or without dynamic imaging, is a promising imaging biomarker for RONS in vivo.
We suggest that [18F]FEDV may have greater impact as an imaging biomarker in neurodegenerative disease (for example, AD/ADRD, frontotemporal dementia, amyotrophic lateral sclerosis and chronic traumatic encephalopathy) compared with acute brain injury such as stroke, as the latter often presents anatomic alterations apparent on MRI or other imaging modalities. Thus, we used [18F]FEDV-PET imaging to test the purported CNS oxidative stress in the PS19 mouse model of AD33. A previous study reported increased protein carbonyls despite normal MDA levels in the brains of PS19 mice, compared with that of age-matched WT mice47. In addition, oxidative stress and mitochondrial dysfunction preceded abnormal tau accumulation and cognitive deficits in PS19 mice. Here we showed that at 12 months, PS19 mice manifested a pervasive increase of [18F]FEDV signals in the brain, correlated with greater oxHET and phosphorylated tau labelling, compared with age-matched WT mice. Region-focused SUV analysis revealed a significant increase of [18F]FEDV uptake in multiple subcortical areas than the cerebral cortex, consistent with the topographic progression of neuropathology in AD (Braak staging)48. [18F]FEDV can thus detect a clear increase in CNS oxidative stress in PS19 mice based on SUV analysis. While [18F]FDG is reimbursable by the Centers for Medicare and Medicaid Services for the differential diagnosis of frontotemporal dementia52 and AD and is the most routinely used PET radiopharmaceutical used in nuclear medicine, [18F]FDG-PET imaging was unable to demonstrate SUV difference in any brain area that we analysed (Extended Data Fig. 5) in PS19 mice. A recent study of [18F]ROStrace also detected CNS oxidative stress in the APP/PS1 mouse model of AD; however, those results require validation with ex vivo autoradiography and parametric mapping62. Future studies are also warranted to compare the sensitivity of [18F]FEDV and [18F]ROStrace in the same mouse model of AD. Longitudinal correlations of [18F]FEDV-PET with cognitive function in PS19 mice may also provide insights on the role of RONS in pathogenesis and provide a basis for interventional studies with antioxidants.
In summary, we have developed a PET agent, [18F]FEDV, for imaging oxidative stress in vivo. [18F]FEDV demonstrated rapid reactivity to a broad spectrum of RONS in vitro, BBB permeability and high solution stability. [18F]FEDV quantified oxidative stress resulting from SNP- or stroke-induced injury and in the PS19 mouse model of AD. Dynamic imaging further increased the sensitivity of [18F]FEDV-PET to detect oxidative stress in vivo. The availability of [18F]FEDV should facilitate research into important clinically focused research questions, such as identifying therapeutic windows to attenuate oxidative stress, evaluating target engagement of antioxidant therapies and identifying patients who are most suited for antioxidant therapy. The availability of [18F]FEDV will enhance our understanding of the relationship between oxidative stress and other pathological processes in AD/ADRD, such as amyloid and tau fibril accumulation, or differentiate normal ageing from preclinical AD in the presence or absence of amyloid PET signals in the brain. The ease of production, in vivo sensitivity and nearly identical chemical structure to the Food and Drug Administration-approved drug, edaravone, warrant further development of [18F]FEDV in clinical studies to delineate disease aetiology rooted in oxidative stress.
Methods
All experiments were conducted following the relevant ethical and safety guidelines. All animal protocols were approved by the University of Virginia and St. Jude Children’s Research Hospital Animal Care and Use Committee, Radiation Safety Committee and Biosafety Committee. EMT6 (CRL-2755) and N2a (CCL-131) cells were commercially available from ATCC. Cell lines were received with a certificate of analysis to support authenticity. All mice were acquired from the same source; all husbandry was identical across cohorts; and each mouse was randomly assigned to its respective study cohort (injured versus sham). Mice were housed in a 12 h (7 AM to 7 PM) dark/light cycle under ambient temperature and humidity with unfettered access to food and water. Construction of VOIs from PET/CT images and subsequent analyses of these VOIs were performed by multiple individuals to maximize rigour.
Radiosynthesis of [18F]FEDV
To synthesize the [18F]fluoride ion, a Siemens RDS 11 cyclotron (Siemens) was used to complete the nuclear reaction of 18O(p,n)18F in a target of [18O]OH2. An anion-exchange resin (Myja Scientific) preconditioned with 12 ml deionized water was used to capture [18F]fluoride, which was then eluted with a 1 ml solution of 9:1 acetonitrile–water containing 1 mg potassium carbonate and 6 mg Kryptofix 222 (Sigma-Aldrich). Argon flow with reduced pressure and heating (90 °C) was performed to remove the solvents. The residue was then dried via azeotropic distillation that included two aliquots (1 ml) of anhydrous acetonitrile under argon flow, with reduced pressure and heating (90 °C). Next, 2.5 mg 4-((tert-butoxycarbonyl)diazenyl)-N,N,N-trimethylbenzenaminium trifluoromethanesulfonate34 was dissolved in 400 μl anhydrous acetonitrile and then added to the reactor vial. The vial was sealed and heated to 85 °C for 60 s. The solvent was then diluted in 3 ml deionized water and passed through a tC18 Plus Light Sep Pak (Waters). The cartridge was washed with 3 ml water, followed by >6 ml nitrogen gas to purge it. Next, the product was eluted from the cartridge with 1 ml glacial acetic acid into a clean reactor vial that was previously charged with 20 mg zinc dust and a Teflon-coated magnetic stir bar. The reactor vial was sealed and heated to 85 °C for 60 s with stirring. The vial was then removed from the heat and 100 μl ethyl acetoacetate was added, followed by 100 μl concentrated HCl. The vial was left to stand uncapped for 60 s, until the evolution of hydrogen gas had ceased. Next, the vial was sealed and heated at 85 °C for 20 min with stirring and then cooled for 60 s. A 2 ml solution of water containing 200 mg sodium acetate was then added to the vial, and the solution was transferred through a 13 mm, 0.45 μm PVDF syringe filter and purified by semi-prep HPLC using a Synergi Hydro-RP C18 column (10 μm, 250 × 10 mm, 80 Å) (Phenomenex) under isocratic flow of a mobile phase consisting of 35:65 ethanol/acetate buffer (0.2 M acetic acid/0.05 M sodium acetate) at 4.7 ml min−1. The product was collected from 11 min to 13 min into 20 ml deionized water. The entire solution was transferred through an Oasis HLB Plus light cartridge (Waters), which was subsequently washed with 5 ml deionized water. Finally, 500 μl ethanol was passed through the HLB cartridge and diluted with 9.5 ml saline to yield 2-(4-[18F]fluorophenyl)-5-methyl-2,4-dihydro-3H-pyrazol-3-one in a 12% ± 1% radiochemical yield (end of synthesis) with an estimated molar activity of 8 ± 1.2 Ci μmol−1 (n = 8). Chemical and radiochemical purity were determined by analytical HPLC using a Synergi Hydro-RP C18 column (4 μm, 4.6 × 250 mm, 80 Å) under isocratic flow of a mobile phase consisting of 30:70 ethanol/acetate buffer (0.2 M acetic acid/0.05 M sodium acetate) at 1.5 ml min−1 ([18F]FEDV Rt = 12 ± 0.5 min).
[19F]FEDV chemical reactivity assays with various RONS in solution
All RONS chemical reactivity assays were performed as previously described22,63. All RONS species were tested with specific concentrations of each RONS, as indicated, and reacted with 50 μM [19F]FEDV. All samples were quenched with 15 μl 500 mM ascorbic acid before HPLC analysis at each indicated time point. Concentrations of [19F]FEDV were calculated by integrating areas and comparing them with a standard mass curve of [19F]FEDV.
[18F]FEDV in vitro assays
In vitro assays of [18F]FEDV were performed using EMT6 cells, as previously described38,64. In brief, EMT6 cells were maintained in DMEM/F12 and seeded in 96-well culture plates 48 h before the uptake assays to achieve log-growth phase with approximately 70% confluence at the time of the uptake assay (~10,000 cells per well). Cell culture medium was removed, and freshly prepared cell culture medium containing 5.6 ± 1.8 × 10⁻² MBq of [18F]FEDV was added to each well. After 30 min, 60 min, 120 min or 180 min incubation at 37 °C, cells were rinsed twice with 1 ml ice-cold 1× PBS. Then the cells were lysed by incubating them in 100 μl 2 M KOH at 37 °C for 10 min. The cell-associated radioactivity was measured by transferring 80 μl of the supernatant from each well into 1.5 ml microcentrifuge tubes and assaying radioactive counts using a Hidex AMG automated gamma counter (Hidex).
Alternatively, N2a cells were maintained in DMEM/F12 and seeded in 96-well culture plates 24 h before the uptake assays (~100,000 cells per well). Cell culture medium was removed, and freshly prepared cell culture medium containing 100 μM TBHP was added to each well and incubated for 3 h at 37 °C. Next, cells were aspirated and washed with 500 μl of 1× PBS. Then, 500 μl of 1× PBS containing 5.6 ± 1.8 × 10⁻² MBq of [18F]FEDV was added to each well. After 30 min, 60 min, 90 min or 120 min incubation at 37 °C, cells were rinsed twice with 1 ml ice-cold 1× PBS. Cells were detached with 500 μl of Accutase by incubating for 15 min at 37 °C. Then the cells were lysed by incubating them in 100 μl Tris-hydrochloride at 37 °C for 10 min. The cell-associated radioactivity was measured by transferring 480 μl of the supernatant from each well into 1.5 ml microcentrifuge tubes and assaying radioactive counts using a Hidex AMG automated gamma counter (Hidex). Then, 20 μl of cell lysate was added to 1 ml of Bradford reagent and incubated at room temperature for 5 min. Protein concentration was calculated by measuring absorbance at 594 nm on a Spectronic 200 spectrophotometer (ThermoFisher), and cell-associated radioactivity was normalized to protein concentrations.
SNP model of cerebral oxidative stress
Cerebral oxidative stress was induced by intrastriatal microinjection of SNP (Sigma-Aldrich), as previously described65. In brief, mice (n = 4 each; an equal number of male and female were used at 8–10 weeks of age) were anaesthetized with 2% isoflurane and placed in a stereotactic apparatus. A scalp incision was made along the midline of the skull. A hole was drilled for the intrastriatal microinjection at the coordinates: anterior–posterior +0.5 mm, medial–lateral −2 mm and dorsal–ventral −3.5 mm from the bregma. A 1 μl solution of 20 nM SNP in saline was injected into the left striatum at a speed of 0.2 μl min−1 for 5 min by using a microinjection syringe pump (MICRO2T SMARTouch, World Precision Instruments). After the microinjection, the glass micropipette was kept in place for an additional 5 min, thereby allowing the maximal volume of SNP diffusion. Subsequently, the animals were subjected to PET/CT imaging or oxHET measurement 1 h after SNP injection.
PT stroke model
The PT stroke model was performed as previously described40. In brief, mice (n = 4 each; an equal number of male and female were used at 10–12 weeks of age) were anaesthetized with 2% isoflurane, and fur was shaved above the temporalis muscle to visualize the ipsilateral common carotid artery. Mice underwent permanent ligation of the ipsilateral common carotid artery, and the chest opening was closed. An incision in the skin was made from the corner of the eye to the ear, exposing the temporalis muscle, followed by a 50 μl injection of bupivacaine (0.25%) into the temporalis muscle. After 1 min, an incision was made in the temporalis muscle, along the temporal line, and the temporalis muscle was gently retracted to expose the skull. A 1 mm area of skull, over the proximal branch of the MCA, was thinned using an electric drill. Next, an intravenous injection of rose bengal dye (50 mg kg−1; Sigma-Aldrich) was delivered into the retro-orbital sinus, and the 1 mm window was illuminated by a 543 nm laser beam (5 mW) for 20 min.
PET/CT imaging
A tail vein catheter was placed in mice under isoflurane anaesthesia. For all studies, approximately 150 μCi was injected via the catheter. Two types of PET scan, dynamic and static, were used for this study. For dynamic-scan studies, a Bruker AlbiraSi PET–CT system (Bruker) was used. Immediately after the radiotracer was injected, a 60 min PET scan was initiated. Dynamic frames were binned as follows (frames × time(s)): 15 × 5 s, 5 × 15 s, 5 × 30 s, 3 × 60 s, 4 × 180 s and 8 × 300 s. For static-scan studies, animals were allowed to recover and micturate after the radiotracer was injected. At 35 min post-injection, they were anaesthetized again with isoflurane. At 45 min post-injection, the mice were transferred to the PET/CT system for 15 min to acquire a single PET image. Both types of PET scan were immediately followed by a 10 min CT scan to ensure attenuation correction and anatomical co-registration. Anaesthesia was maintained during imaging by using isoflurane. Upon completion of the study, mice were euthanized for biodistribution, where applicable, and γ counting of collected tissue was performed using a Hidex AMG automatic gamma counter (Hidex).
Computation of parametric PET maps
To generate the parametric total-brain PET maps, a model-corrected blood input function (MCIF) was computed by optimizing image-derived input function derived from the left ventricular blood pool, the interior carotid artery or the inferior vena cava developed for rodent and human hearts and brains, as previously described43,46,66,67,68. The methods of computing the MCIF are more quantitative, as it accounts for partial volume recovery of the blood input. The computed MCIF and whole-body dynamic PET data (160 × 160 pixels × 300 slices) were fed into a graphical Patlak model60 (written in MATLAB, MathWorks). The model performed a linear regression on the data (starting at 6.5–8 min and beyond, for which the image data are linear), where the slope gives a measure of the rate of [18F]FEDV uptake (Ki) at that voxel. By analysing millions of voxels across the entire PET volume, a parametric Ki map was computed.
PET/CT/MR image registration and quantification
For a specific rodent PET dataset, the Ki maps were computed using the same image dimensions as one frame of the raw PET 4D volume and were written as NIfTIs by using the same header information, that is, voxel size and centring transform as the raw image by using MATLAB. Next, their respective CT images, simultaneously obtained during the scan, are centre-padded until dimensions become consistent with that of their Ki map image. Finally, by overwriting header information to that of the Ki maps obtained, the CT is brought to the same image space, thereby ensuring a direct registration. To better visualize structural information and localize VOIs in stroke-damaged tissue regions, MR imaging can be used. However, the corresponding MRIs for these rodent datasets were not automatically obtained in the same space as the CT or PET images, as it is not feasible to directly register Ki maps to MR space because of the lack of structural information. Hence, PMOD’s Image Registration and Fusion Tool or PFUS (version 3.9, PMOD Technologies) is used to first register a CT to MR image by using a manual linear-registration process involving affine transformations with 9 degrees of freedom (rotation, scaling and translation), generating a transformation matrix for each dataset. Because the CT and Ki maps were registered in the same image space, the same transformation matrix could be applied to the corresponding Ki map to register it to the MRI. On the MRI, the stroke-damaged tissue is commonly observed as a blob of higher signal intensity inside the rodent brain, specifically on the left side of the axial view. A single VOI is drawn by manual annotation over several slices, approximately encompassing the observed structure with appropriate window levelling. This VOI is then cloned and mirrored horizontally to the contralateral side for each dataset. Because the Ki map and MRI are aligned, the same annotations can be used to generate the average volumetric Ki values for quantification of the stroke tissue VOI and its mirrored VOI for a contralateral comparison.
Autoradiography
After completion of PET scans, mice were intracardially perfused with 10 ml of saline, followed by 10 ml of PFA (4%). Mouse whole brains were carefully removed and flash frozen in a 15 ml snap tube in liquid nitrogen for 120 s. Once frozen, the brains were removed from the snap vial and mounted in Optimal Cutting Temperature mounting medium for cryosectioning at −25 °C. Embedded brains were sliced at 20 μm thickness and tissue slices were placed on glass microscope slides. The slides were placed into cassettes fitted with BAS-IP-TR 2025 imaging plates (Cytiva) for 12 h and autoradiographic images were acquired using a Typhoon FLA 9500 laser scanner. All images were analysed using ImageQuant or ImageJ.
Confocal microscopic imaging of oxidized hydroethidine in mouse brain
To prepare a 1 mg ml−1 solution of dihydroethidium (DHE D11347; ThermoFisher Scientific), 1 mg DHE was dissolved in 100 μl DMSO and diluted with 900 μl warm PBS. Each mouse received 300 μl of the resultant DHE solution via tail vein injection. After 60 min, mice were perfused with 10 ml saline followed by 10 ml PFA (4%). Brains were carefully removed and postfixed overnight in 4% PFA at 4 °C in the dark. The next day, the PFA was discarded, and brains were placed in 15 ml sucrose (30%) at 4 °C in the dark overnight. After 24 h, the first round of sucrose was discarded, and brains were placed in 15 ml fresh sucrose (30%) at 4 °C in the dark overnight. After 24 h, the second round of sucrose was discarded, and brains were embedded for cryosectioning. Embedded brains were stored at –80 °C and sectioned at 20 μm thickness at –25 °C. Tissue slices were placed on glass microscope slides. Oxidized DHE (oxHET) was excited at 514 nm and detected at an emission of 590–620 nm. Quantification of oxidative stress was calculated as the ratio of oxHET to DAPI+ nuclei in four randomly selected visual fields (40×).
Pathology
Tissues were fixed in 10% neutral-buffered formalin and processed as paraffin-embedded samples. Tissues were sectioned at a 4 μm thickness and mounted onto positively charged glass slides (Superfrost Plus; ThermoFisher Scientific) and then H&E stained and cover-slipped using the HistoCore SPECTRA Workstation (Leica Biosystems). Serial sections were immunolabelled with a Phospho-Tau (Ser202, Thr205) monoclonal antibody (clone AT8, Invitrogen, MN1020, 1:20,000 dilution) using a Ventana Discovery Ultra autostainer (Roche) and the following conditions: heat-induced epitope retrieval, cell conditioning solution ULTRA CC1 (950-224, Roche) and visualization with DISCOVERY OmniMap anti-Rb HRP (760-4311, Roche), Haematoxylin II (790-2208, Roche) and Bluing reagent (760-2021, Roche) for 1.5 h at room temperature at a 1:500 dilution. Morphologic assessments and interpretation of immunohistochemistry were conducted by a board-certified veterinary pathologist and in a manner that was blinded to the experimental condition of each mouse. Whole slide images to a 20× scalable magnification were created using a PANNORAMIC 250 Flash III digital slide scanner (3DHISTECH). Images were taken using the HALO v3.6.4134.137 software programme (Indica Labs).
Statistical analyses
Quantitative data are expressed as the mean ± s.e.m., unless otherwise indicated. One-way or two-way analysis of variance (ANOVA) was used to compare means for single or multiple comparisons, respectively. The Mann–Whitney U test was used to assess dynamic-scan PET data, specifically the differences in SUV comparisons over time. P values smaller than 0.05 were considered statistically significant.
Reporting summary
Further information on research design is available in the Nature Portfolio Reporting Summary linked to this article.
Responses