A review of micro-resolved crystochemical and mechanical probes for sustainable cement-based material studies

Introduction
Cement and concrete are ubiquitously used for modern construction. The most widely used cement—the ordinary Portland cement (OPC)—leaves a carbon footprint of ~0.8 kg CO2 /kg of cement1,2, and accounts for nearly half of the embodied carbon in concrete3. At a global production of nearly 30 giga tones per year, the manufacturing of concrete solely accounts for ~8% of global anthropogenic CO2 emissions4. This pressing issue has driven a recent trend in exploring innovative approaches to enhance the sustainability of cementitious materials.
Researchers and engineers have explored multiple sustainability approaches5,6,7. In the life cycle sequence of concrete manufacturing, these approaches include: (1) producing cement at less CO2 emission8, (2) developing low-carbon cement (including blending with new supplementary cementitious materials (SCM))9; (3) utilizing waste and low-grade materials as concrete constituents10 ; (4) design optimization to use less cement11, (5) CO2 utilization (in preprocessing wastes and curing of concrete)12, and (6) elongating the durability of concrete structures13.
For example, limestone combined with calcined kaolinitic clay are intensively studied as a new SCM14. The utilization of low-grade materials (marine clay, municipal waste incineration ash, steel slag, sea sand, seawater) and recycled materials (e.g., recycled aggregate, glass powder, fiber, and rubber) have gained attention, offering promising alternatives to conventional resources. Studies focusing on the carbon capture usage and storage (CCUS) processes within cementitious materials have emerged as another significant area of interest. By sequestering carbon dioxide during concrete production (whether through the pre-treatment of recycled cement paste with accelerated carbonation or the application of early-age carbonation curing to cement-based composites after mixing), these approaches contribute to reducing the carbon footprint of concrete, aligning with global efforts to combat climate change.
Extending the service life of concrete serves as another straightforward pathway to reduce environmental impact and achieve sustainable development of cementitious materials. To achieve this, the first step is to understand the mechanisms underlying concrete degradation, e.g. chloride-induced corrosion of steel bars, sulfate attack, alkali-silica reaction (ASR). In recent years, durability research has made great progress, offering valuable insights that guide the development of sustainable materials in concrete.
Despite these promising prospects for sustainable construction, there exist considerable challenges in optimizing these materials/techniques effectively, where microscale probes play as a vital role in charactering the structure/composition of raw materials and blended cement paste at the nano- and micro- level. Moreover, these probes offer valuable insights into the fundamental mechanisms governing the performance of these materials, thereby facilitating a more comprehensive understanding that can steer the development of robust and durable sustainable construction materials. Taking cement carbonation as an example, although the chemical reaction itself is simple, its kinetic process and the morphological changes of the reactants and reaction products involved, as well as the possible durability issues coupled by changes in the chemical environment of the cement paste are very complex. The introduction of other materials, such as sea sand, further complicates this process.
This review aims to provide a survey of the characterization tools that are able to provide micro-resolved chemical, mineralogical and morphological information. Their advantages will be discussed through examples of application in studying the abovementioned sustainability related work. We will focus less on conventional topics such as OPC hydration and high-performance concrete development. We aim to provide a comprehensive review of the sample conditions and measurement procedure, to enable readers to plan for their own measurements using these methods. The manuscript is structured in three main sections:
-
I.
A review of widely accepted laboratory-based morphological & crystochemical probes, detailing essential sample preparation and interpretation methods. It also discusses recent developments in concrete technology using these techniques, analyzing the microstructural and chemical changes resulting from sustainable material modifications to explain the underlying mechanisms.
-
II.
A review of synchrotron radiation-based morphological & crystochemical probes, including micro-resolved spectroscope, diffractometer and imaging methods. Details of sample preparation, especially for cementitious materials are provided. Examples of these methods applied in studying low-carbon cement/aggregate alternatives and concrete degradations are provided and discussed. Compared with conventional laboratory methods, the advantages and disadvantages of synchrotron-based methods are analyzed.
-
III.
A review of commonly used micro- and nanoscale mechanical testing methods, outlining the necessary sample preparation requirements to assist readers in conducting experiments. The latest progress in sustainable materials for concrete is evaluated, examining how modifications impact mechanical properties after material modification to explain the underlying mechanisms.
At the end of each session, we critically analyzed the strengths and weaknesses of the discussed characterization methods. Finally, we concluded the paper by summarizing the advancements in micro-resolved characterization tools and their impact on understanding sustainable cement-based materials, highlighting the integration of advanced techniques and AI-algorithms to enhance data analysis and suggesting future directions for exploring the microscale processes and mechanical behaviors.
Laboratory-based morphological and crystochemical micro-probes
Concrete is an inherently complex and heterogeneous system, which could be further complicated by the addition of sustainable materials. To gain a comprehensive understanding of the viability of these sustainable materials and to mitigate their potential adverse effects on concrete properties, it is necessary to quantitatively characterize the raw materials and evaluate their influence on the microstructure development and long-term performance of blended cement paste. In this section, we explored advancements in several lab-based nano-microprobes that have gained widespread acceptance, including scanning electron microscopy (SEM), transmission electron microscopy (TEM), X-ray computed tomography (X-CT), micro-Raman imaging, and micro-XRF (µXRF). These techniques offer a wide range of image resolution capabilities, spanning from ~1 Å to several micrometers, enabling the acquisition of structural and chemical information about cementitious materials. The sample preparation and result interpretation methods, together with their pioneering applications in sustainable materials within the concrete technology domain are discussed. Notably, this section also recognized the rapid evolution of artificial intelligence, with a particular focus on deep learning-based image analysis techniques. These advancements offer the potential for more robust and quantitative data processing, further enhancing our understanding of the complex relationship between sustainable materials and concrete.
Principles of application
As shown in Fig. 1, most imaging techniques work with focused electron beam or electromagnetic waves, whose wavelength determines the spatial scale of the observation15,16. The theoretical resolution reduces along the increase of wavelength of the applied radiation. As can be seen from Table 1, the resolution of the abovementioned imaging techniques are as follows: TEM > SEM > X-CT > micro-Raman ≈ µXRF.

Images adapted from refs. 15,16,26,29,64,103,209.
For SEM, three signals induced by electron collisions, including secondary electrons (SE), backscattered electrons (BSE) and characteristic X-rays, are most widely used to comprehensively analyze the target material. Correspondingly, the near-surface topography information, phase assemblage and chemical composition can be visually illustrated by scanning the electron beam over the specimen’s surface in a raster and using the signal detected at each point to give the intensity of the corresponding pixel in the image16.
In comparison, with the utilization of much thinner sample and electron beam with higher energy, the most important signal of TEM is the transmitted beam of electrons which have undergone minimal energy loss as they traverse the sample. Compared to SEM, the resolution of TEM is an order of magnitude higher. TEM operates in two primary modes: bright field and dark field. In the bright field mode, the image is formed by the unscattered (transmitted) electron beam, highlighting containing crystalline or high-mass materials by rendering them darker. Dark-field mode, on the other hand, selectively captures scattered electrons, rendering areas without scattering black and materials brighter. Beyond imaging capabilities, TEM offers a multifaceted toolkit for probing crystallinity, elemental composition, and chemical state with selected area electron diffraction (SAED), energy-dispersive X-ray spectroscopy (EDS), and electron energy loss spectroscopy (EELS).
X-ray CT is a powerful tool that enables researchers to quantitatively explore the internal structures (e.g., shape, size, orientation, and connectivity) of cementitious materials in a non-destructive, three-dimensional manner. X-ray CT’s operation involves projecting X-ray beams through the target, depending on the linear attenuation coefficient (LAC) of the sample, from multiple angles. Then, hundreds (or even thousands) of 2D attenuation maps are reconstructed into 3D volume with the help of image reconstruction algorithms. To further improve the resolution of X-ray CT and minimize the effect of unevenly distributed X-ray in space and polychromatic X-ray signals, synchrotron-based X-ray CT, or the so-called nXCT, has achieved a remarkable improvement over the past decade17. More detailed features at resolution of ~20 nm inside hydrated cement paste can be captured by nXCT.
Micro-Raman imaging is a high-precision application of Raman spectroscopy that allows the mapping of different phases in heterogeneous materials and has been extensively used to characterize cement clinker phases, study cement hydration and durability. The working principle of Micro-Raman microscopy is grounded in the Raman effect. When a monochromatic light source, typically a laser, illuminates a sample, a small fraction of the incident photons undergoes inelastic scattering. This scattering process causes a shift in the energy levels of these photons, and this energy shift reveals crucial information about the chemical composition and molecular structure of the material under examination. By analyzing the positions, intensities, and shapes of these peaks, researchers can identify the chemical compounds present, study molecular interactions, and gain insights into crystallography and material quality. Compared to the SEM-EDS that can also map the chemical composition of target material, Micro-Raman microscopy is suitable for a wider range of sample types, including liquids, gases, and solids. Moreover, it can be used to easily visualize larger mm-scale maps at micron-scale resolution18.
μXRF is a non-destructive X-ray based imaging technique that simultaneously provides chemical composition and position within concrete samples. It works by utilizing the principle of X-ray fluorescence, which occurs when a sample is irradiated with high-energy X-rays. By scanning the X-ray beam across the sample and measuring the emitted X-rays at each point, a spatial map of elemental distribution can be generated. This provides information, on a wide range of sample sizes from hundreds of micrometers to several centimeters, about the distribution and concentration of various elements within the sample. μXRF can be used to analyze a variety of large specimens (>10 cm2) without many of the limitations found in electron-excitation sources, such as the ability to work at atmospheric pressure and lower limits of detection19.
Sample preparation
Prior to imaging acquisition, proper sample preparation is necessary to align the sample with the specific testing requirements and improve the quality of the resulting images. Broadly speaking, the sample type can be classified as dry sample and wet sample depending on whether free water is removed. All the imaging techniques we discussed here can be applied for in situ testing. While for SEM and TEM, specialized chamber and/or detector are needed. Here, we focus mainly on the most commonly used ex-situ testing conditions, where dehydrated or dried samples are tested.
Compared to conventional oven drying, the substitution of water with isopropanol has been identified as a method that can minimize the damage to C-S-H, and has been widely adopted for the preparation of SEM/TEM samples20. Besides, supercritical drying (SCD) method21 and freeze-drying method22 have also demonstrated their suitability for SEM/TEM sample preparation, effectively mitigating the impact of dehydration on the microstructure of cementitious materials.
SEM
Two types of SEM samples, i.e., fracture sample and polished sample, have been utilized to analyze the morphology and phase distribution of the hydrated cement paste. The corresponding image resolution differs significantly, due to the different beam sources, as <1 nm for fractured sample (secondary electron) and >500 nm for polished sample (backscatter electron). Generally, fractured samples are suitable for unhardened systems. By immersing cement powder in excess isopropanol for a few minutes, subsequently filtering the isopropanol and repeating this process for three to four times, the hydration reaction can be quickly terminated. This approach proves effective in preserving the sample’s state at a specific hydration stage, enabling detailed analysis of the microstructure. At later age, fracture surface of hardened cement paste exists low representative for the overall microstructure since the sampling process could induce man-made damage and break the fragile structure. In that case, backscattered electron imaging of polished surfaces over a wide range of magnifications can be used for phase assemblage and defect analysis23. Considering the relatively big volume of bulk paste, a protocol of immersing the sample in isopropanol for 5–7 days typically proves sufficient16. In addition to isopropanol replacement, other methods, e.g., supercritical drying (SCD)21, freeze-drying24, have also been reported and applied in microstructure sample preparation. A detailed sample preparation procedure is illustrated in Fig. 2, involving sample cutting, vacuum impregnation, polishing, cleaning, drying, etc. Considering the significant resolution difference between fractured and polished samples, the most critical question that needs to be answered prior to SEM sample preparation is: what is the target research object? For morphology study of specific hydration product (for example, C-S-H gel), SE mode of SEM with fractured sample should be prepared. For statistical analysis of the overall hydration products, BSE mode of SEM with polished sample should be prepared. To further improve the image quality and minimize the charging effect, a thin layer of conductive material (e.g., carbon, gold, and iridium) is finally coated before SEM observation. The coating quality is closely related to the sputter target materials, vacuum level, layer thickness, etc. According to previous research25, the grain size of frequently used sputter materials is as follows: Au>Pt>Ir>W. Therefore, for high-resolution morphology observation, Pt and Ir coating with ~5-nm thickness is suggested. As for BSE image acquisition, a thicker layer of Au and C (~15 nm) can be coated.

a Fracture sample29, b Polished sample210.
TEM
For TEM observation, there are also two types of samples, powder sample and lame sample respectively. For the previous one, suitable for powdered samples (e.g., raw materials, unhardened cement/C3S slurry, synthetic C-S-H), sample preparation is relatively easy and straightforward. A fine grind of the cementitious material to a few hundred nanometers allows electron beam to go through the powder sample. Subsequently, disperse a small quantity of powder sample in a solvent (e.g., water, isopropanol). Following ultrasonic treatment to ensure proper dispersion, a mere drop of the suspension is transferred onto a copper grid. The sample is then dried, with freeze-drying being a preferred method when feasible, and ready for TEM observation. For the preparation of TEM lamellae of bulk cementitious materials, due to the need for an ultra-thin sample that permits electron transmission, more extensive experimental efforts are needed. Generally, ion milling, and focused ion beam (FIB) are employed to create TEM lamellae. The detailed sample preparation procedure is illustrated in Fig. 3. Unlike SEM, where the sample surface accumulates excess electrons (known as the charging effect), TEM testing typically allows most electrons to penetrate the sample without charging the surface. Consequently, TEM samples require no additional coating.

Top: grid preparation (for carbonation study)98; middle: ion milling for TEM lamellae (from the website of MESA + INSTITUTE, https://www.utwente.nl/en/mesaplus/nanolab/); bottom: focused ion beam for TEM lamellae60.
X-CT
The foremost advantage of the X-CT test lies in its capacity to non-invasively capture the in situ 3D structure of materials, eliminating the need for special sampling processes. However, it is important to note that, the resolution of X-CT is directly related to the size of the test sample. For example, to achieve a voxel resolution below 100 nm, the diameter of the sample was approximately 100 μm17. As the sample size increases, the resolution decreases accordingly. In practice, the sample size is normally two to three orders of magnitude larger than the anticipated resolutions. Hence, before conducting the test, careful consideration must be taken to calibrate the sample size so as to balance the resolution with field of view, while aligning with the capabilities of the equipment in use.
Depending on the purpose of the experiment, X-CT sample can be prepared by casting in a certain shape for direct measurement (mm size samples for microresolution, samples in capillary for sub-microresolution), drop-casting of powders on sample holder (coper grid or film transparent to x-ray), cutting (macro-cutting using a high-precision cutting machine, micro-cutting using FIB). Moreover, except ambient condition, controlled environmental conditions26 (e.g., temperature, relative humidity, and gas) and loading27 can be applied to the sample, which enables researchers to monitor the 3D structural changes in real-time, facilitating in situ investigations of the sample’s response over time.
Micro-Raman and micro-XRF
Both micro-Raman and μXRF tests offer the advantage of being applicable to freshly cut cementitious samples without extensive human intervention. However, the signal quality can be notably improved by subjecting the samples to gentle drying and surface grinding/polishing prior to analysis28. This process closely resembles the sample preparation method employed for SEM polished samples, involving epoxy resin impregnation and a step-by-step polishing procedure.
It’s worth noting that both micro-Raman and μXRF techniques demonstrate a lower sensitivity to surface roughness when compared to SEM-BSE imaging. Consequently, a comparatively lower degree of precision in the polishing process (normally hand polishing with sandpaper) is acceptable, implying a higher tolerance for sample preparation in these techniques. This attribute simplifies the sample preparation process and contributes to the efficiency and practicality of these analytical methods.
Result interpretation
Image processing plays a pivotal role in extracting valuable qualitative or quantitative information from the original image. In many cases, the analysis of the images could be more time-consuming than the image acquisition itself because of the huge size of the dataset intricacies involved in imaging processing procedures.
For SE-SEM, the output is mainly surface topography information, readily discernible to the naked eye. Though point-specific analysis with SE-SEM provides high-resolution and detailed morphological information, it has limitations in providing a comprehensive statistical overview of bulk paste. As emphasized by Scrivener et al.16 the inherent limitation of SE images lies in their predominantly qualitative nature, often demanding subjective interpretation. To facilitate statistical analysis, it is necessary to compare multiple SE images with specific targets29,30. Similarly, 2D TEM images provide insights into the internal structures and morphologies of specimens. However, to mitigate the subjectivity in observations, it is essential to compare multiple TEM images.
For BSE image, the greyscale value of each pixel is determined by the average atomic number of phases within the interaction volume, which helps to distinguish hydration products and blended materials in the cement paste. Note that the size of the interaction volume in BSE is directly related to the accelerating voltage. To ensure a robust electron signal intensity for imaging, the recommended setting is 15 kV. Consequently, the resolution of the BSE image is no higher than 500 nm. Therefore, for fine particles and phases that are heavily intermixed with calcium silicate hydrate (e.g., ettringite) on a scale smaller than the interaction volume, it is impossible to visually differentiate and segment them31,32. For the other phases present in hydrated cement paste, e.g. anhydrous cement, portlandite, C-S-H gel and pore, the corresponding areas can be segmented from BSE image based on the greyscale histogram. Then, the critical question is, how to set the threshold value for a specific phase? The most widely used method is the tangent-slope thresholding method proposed by Scrivener et al.33, which can effectively segment anhydrous cement particle and pores (Fig. 4 top). Yet, the introduction of Supplementary cementitious materials (SCMs) complicates matters as the greyscale characteristic peaks tend to overlap significantly, blurring or fully eliminating phase distinctions. In such cases, the tangent-slope thresholding method is no longer applicable (Fig. 4 middle). Recently, thanks to the development of computer vision techniques, especially deep learning-based image analysis methods, a range of phase segmentation algorisms have been developed to quantitatively analyze the BSE images of cementitious materials. By manually labeling the target phase in the BSE image and feeding the well-labeled image pairs, including both the raw image and labeled mask, to deep learning algorisms (e.g., ResNet34, VGG35, and DenseNet36), the features of the target phase can be captured over the training process (Fig. 4 bottom). These methods offer more robust and statistical phase assemblage analysis, often yielding results comparable to those obtained through quantitative X-ray diffraction (QXRD)37,38,39,40,41,42,43.
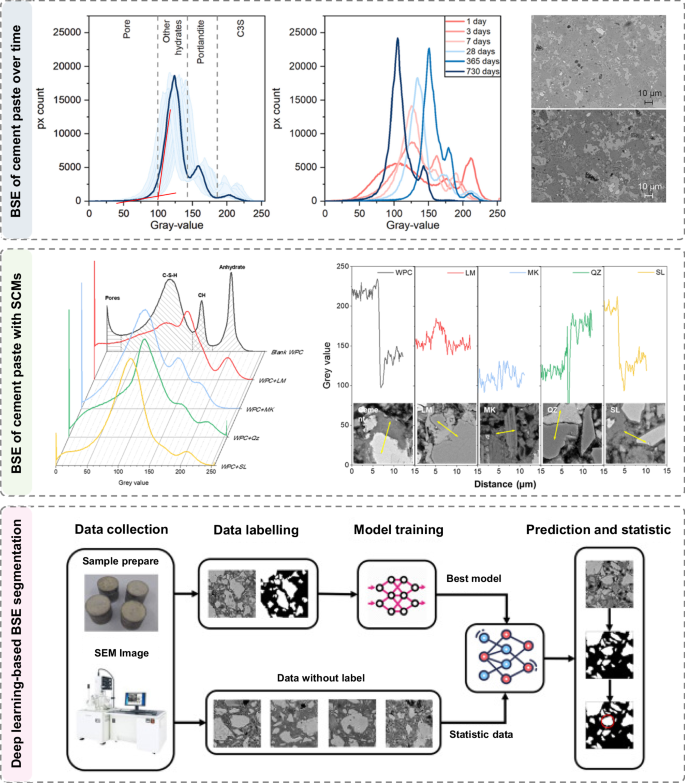
Tangent-slope thresholding method can be used to segment anhydrous cement and pores in blank cement paste, while deep learning-based image segmentation method shows great potential in segmenting heterogeneous cement paste. Images adapted from refs. 37,43.
For SEM/TEM EDS, micro-Raman, and μXRF images, the source of image contrast originates from different chemical compositions. Hypermaps of individual elements can be created according to the element distribution in the sample and overlapped with the original image to illustrate the distribution of different phases in the heterogeneous matrix. Recently, Georget et al.44 developed a user-friendly image analysis framework Edxia to identify phases and quantify the microstructure of cementitious materials from SEM-EDS hypermaps. In addition to individual element maps, element ratios (e.g., Si/Ca, Al/Ca, S/Ca, Cl/Ca) can be easily calculated and treated as extra feature maps for phase segmentation.
Like the process used for SEM-BSE image analysis, a parallel approach is employed for interpreting X-CT data before reconstructing the 2D slices into 3D volumes. Depending on the number of target phases (e.g., aggregate, hydrates, pores, and cracks) inside the sample, the raw 2D slices need to be converted into multiple masks plus the background. Due to the low contrast of phases in X-CT images, remember in situ X-CT test without stopping hydration, and relatively low beam powder as lab-based micro-CT, the image analysis can provide differing results based on the procedures followed without careful evaluation45. Moreover, considering the hundreds or even thousands of 2D images for one sample, the traditional CT scanning image segmentation methods cannot effectively identify and segment phases autonomously, which further lowers the accuracy of X-CT reconstruction. To mitigate this challenge, employing a limited number of annotated CT images for neural network training proves to be a promising solution. The neural network autonomously learns and adapts to recognize distinct features, enabling automatic segmentation of the remaining images based on these extracted features. This method can not only avoid the fluctuations and errors that may exist in manually adjusting the threshold parameters of many images, but also greatly save time and cost, making the processing of CT data accurate and efficient. Deep learning analysis has been used for CT analysis including identification and reconstruction of concrete mesostructure46,47, identifying the micro and meso-damage of concrete48,49, and multi-mineral segmentation of rock micro-CT images50.
Applications in sustainable materials in concrete technology
Supplementary cementitious materials
The utilization of SCMs as a partial replacement for cement stands out as a highly effective and straightforward approach for mitigating the carbon footprint of the cement industry51. Nevertheless, SCMs typically originate as by-products of industrial processes, often featuring multiple impurities and exhibiting variable physical and chemical properties. In this context, SEM and TEM have emerged as essential tools for characterizing the surface morphology of SCMs (e.g., fly ash52,53, slag54,55,56, calcined clays57,58,59), as well as investigating their reaction mechanisms55,60,61,62,63. Polavaram et al.64, conducted comprehensive testing on eight secondary phases present in cement clinkers (gypsum, anhydrite, bassanite, syngenite, dolomite, calcite, quartz, and portlandite) and four principal phases in cement using Raman imaging. Their work demonstrated that Raman imaging is also a highly versatile tool for anhydrous phase quantification in a broad variety of cements. Even though, accurately estimating the reaction degree of amorphous SCMs within hydrated cement paste has long posed a significant challenge. In this regard, as illustrated in Fig. 5, the combined use of BSE image analysis, EDS mapping, X-CT, and micro-Raman has made it possible to quantify the DoH (degree of hydration) of slag42,65,66,67 and fly ash68. Generally, the chemical composition of SCM is significantly different from that of cement clinkers and hydration products. By determining the characteristic element of SCMs (e.g., Mg for slag) and overlapping the elemental map with the BSE image, it will be much easier to set the threshold value of the target phase and calculate DoH according to the segmentation result than that of greyscale value-based BSE image analysis. While it should be noted that a relatively big error still exists.

For slag, fly ash and AFm respectively65,68,78.
Generally, within a certain threshold of substitution rate for SCMs, the presence of intermixed hydrate gels that incorporate foreign ions from SCMs (e.g., Na+, Mg2+, Al3+, K+, and Fe3+) has proven to be advantageous for fostering the development of a more compact microstructure55,56,60,69. This enhanced microstructure, despite an increasing number of pores, results in the refinement of the pore network70,71. Consequently, a reduction in the permeability and ionic diffusion of the concrete can be achieved. However, in specific instances, such as alkali-activated slag cement doped with Zn-rich electric arc furnace dust (EAFD)54, where only 5% of the slag is replaced with EAFD, a more porous and heterogeneous structure can be formed. Despite this porosity, it is noteworthy that heavy metal ions, such as Zn, Cr, and Pb, can be chemically incorporated into the reaction products, offering a viable solution for the disposal of these hazardous materials.
Such good performance in solidifying hazardous industrial by-products, including heavy metals and radioactive wastes, is mainly due to the porous structure and highly charged surface of C-S-H gel, where heavy metals (e.g., Cu, Co, Cr, and Zn) can be incorporated on the surface or within the defective layered structure at nanoscale44,54,72,73. Specifically, Baldermann et al.73,74 systematically studied the immobilization mechanism of heavy metals (e.g., Co, Cr, and Zn) with TEM images and EDS spectra, revealing that the immobilization mechanism of heavy metals in the C-A-S-H system is based on a combination of isomorphous substitution, interlayer cation exchange, surface (ad)sorption, and surface precipitation. Furthermore, in the case of municipal solid waste incineration fly ash (MSWIFA) with high chlorine (Cl) and lead (Pb) content, HAADF-STEM (High-angle annular dark-field scanning transmission electron microscopy) imaging and element mapping, confirm not only a simple ion-exchange behavior between Pb and Ca but also a complex Pb-Cl synergistic immobilization process75,76.
In recent years, limestone calcined clay cement (LC3) has been developed as a promising blended cement with comparable performance as OPC but a much lower carbon footprint. With up to 50% replacement of OPC – a substitution rate significantly higher than that of traditional SCM—by limestone and calcined clay, LC3 exhibits similar compressive strength to the blank cement system after 7 days and offers improved durability in terms of chloride and ASR resistance77. Calcined clay is considered the critical material determining the overall properties of this ternary system. The interaction of metakaolin with limestone in LC3 results in the formation of more hemicarboaluminate and monocarboaluminate, a phenomenon observed through SEM-EDS mapping. This reaction leads to a space-filling effect that significantly refines the porosity, aids in strength development, and provides superior resistance to chloride ion penetration compared to other blended cements78. Interestingly, except for kaolinite content, the calcite impurities in a kaolinitic clay can also affect the mineralogy and reactivity of calcined clay. SEM observations by ref. 58 demonstrated that a granular deposit originated from calcite impurities can partially cover the kaolinite particles to reduce the specific surface area of calcined clay, which increases with the amount of calcite that is intermixed in the raw clay. To optimize the performance of LC3, multiple factors, including clay quality, particle size, and calcination conditions, must be thoroughly considered.
Unconventional concrete constituents
The growing demand for sustainability and green concrete has driven the exploration of novel SCMs and some unconventional materials, especially recycled ones. In contrast to traditional SCMs, the physical and chemical composition of these materials are even more complicated, yet they remain relatively underexplored in terms of their potential impacts on the properties of hydrated cement paste.
Sea sand and seawater are increasingly used to mitigate the shortage of natural river sand and freshwater. Dhondy et al.79 highlighted that the chemical (e.g., impurities with foreign ions like Mg, Al, K, and Fe) and physical (e.g., mineralogy and particle size distribution) properties of sea sand is highly variable, as shown in Fig. 6 top. This variability has contributed to fluctuating and, in some cases, contradictory findings in studies investigating the impact of sea sand on concrete properties. Instead of directly using the raw sea sand, using desalinated sea sand, with less impurities and reduced chloride content, to produce desalinated sea sand concrete (DSSC) has been a viable solution, particularly in coastal areas and remote islands. Even though, as certain amount of chloride still exists in the DSSC, the risk of chloride-induced corrosion of the steel reinforcement cannot be ignored80. Regarding seawater-mixed concrete, SEM and TEM observations suggested that the seawater-hydrated cement matrix was enriched with more cement hydrates, finer microstructure, and higher crystallinity compared to the DI water-hydrated cement matrix (Fig. 6 bottom), leading to a 50% increase of 28 d compressive strength and highly reduced autogenous shrinkage81.

Bottom: impact of seawater on the microstructure of hydration products characterized by SEM and TEM81.
Multiple recycled materials, e.g., recycled aggregates82,83,84, glass powder85, carbon fibers61,86, rubbers87,88, biochar89,90, have been utilized to prepare concrete. Due to the rough and/or inert surface, a more distinct interfacial transition zone (ITZ) can be found in systems mixed with recycled materials, which could bring a negative impact on the overall property of blended concrete91,92. As summarized in Fig. 7, X-CT has demonstrated its suitability as an imaging technique for the quantitative analysis of the mesostructure of cement paste/mortar, with a particular focus on the ITZ that interfaces between the recycled materials and the fresh paste/mortar. Furthermore, the application of X-CT, in conjunction with BSE imaging and EDS mapping analysis, allows for the detailed examination of the chemical composition and porosity of the ITZ93.

a Recycled aggregate concrete84, b Biochar blended cement paste90, c Opalinus clay (OPA) and concrete93. Images adapted from refs. 84,90,93.
Chen et al.84 discovered that the interface region thickness between recycled aggregate (RA) and new mortar is about 200 μm, and the crack width in recycled aggregate is about 300–400 μm. For the microstructure, ref. 94 observed that the surface area of recycled aggregate exhibited characteristics of slurry, loose, porous structure, and could not effectively bear loads owing to its poor mechanical properties. However, the application of carbonation treatment to RCA has been found to enhance the properties of the weak ITZs in RAC, consequently improving the overall behavior of RAC95. Specifically, it can be seen from SEM images that there are many lamellar Ca(OH)2 crystals in ITZ before carbonation, which show an accumulation distribution. However, lamellar Ca(OH)2 and flocculent C-S-H can hardly be found in ITZ after carbonation, and ITZ is filled with small particles of CaCO3 after carbonation, which contributes to a more compact microstructure and an increase in the elastic modulus.
Zhao et al.85 conducted a quantitative analysis of the porosity and chemical composition of the ITZ in recycled concrete enhanced with waste glass powder (WGP). Their research revealed that WGP effectively reduced the volume fraction of pores and cracks through a reaction with calcium hydroxide (CH) within the new ITZ and the adjacent old mortar. This reaction generated a significant quantity of C-S-H gel with a Si/Ca ratio of ~1.5. Similarly, with the addition of biochar, a higher compressive strength than the estimated values based solely on the increased porosity can be achieved89. The main reason for this phenomenon, as revealed by EDS mapping and X-CT, is the bonding of biochar particles with hardened cement matrix via a layer of Ca-rich hydration products (~50 um) mainly composed of AFm phases, CH and C–S–H gels90.
Rubber-cement composites are composed of elastic rubber particles and brittle cement-based materials, and their internal structures and ITZ are more complicated than the abovementioned systems. Analysis of the BSE images clearly reveals the weakness in the interfacial bonding between rubber particles and mortar, resulting in a notable reduction in compressive strength. With certain surface treatments (e.g., silica fume coating), low Ca/Si gels, as confirmed by SEM-EDS analysis, can be formed at the rubber-mortar interface, which improves the mechanical strength of rubber concrete88. Yet, when attempting to characterize rubber-cement composites using X-CT, a unique challenge arises. Since the pores and the rubber particles have very similar gray values in the X-CT image, grayscale thresholding alone is insufficient for distinguishing between the two phases. To address this issue, the incorporation of additional shape-based characteristics, such as size, shape, and roughness, becomes necessary to accurately identify the rubber particles27.
For recycled carbon fiber, reduced pullout and higher tensile strength, indicating improved bonding due to compatible sizing and rough surface morphology compared to the new carbon fiber, can be found61,86. The main issue for recycled carbon fiber is the reduced workability of the reinforced mix compositions. Moreover, pore formation and poor fiber distribution, as can be clearly visualized by X-CT61, can significantly affect the mechanical properties.
CO2 mineralization mechanism
Carbonation of cementitious systems is a phenomenon, significant from both durability, with implications for rebar corrosion, and environmental perspectives, given its potential for greenhouse gas emission reduction through CO2 sequestration18. All of these activities involve complex physical and chemical changes that are accompanied by dynamic microstructural changes, which extend beyond what can be adequately elucidated through bulk measurements, such as pH variation or calcite content alone.
The morphological changes occurring in cementitious materials during the carbonation process are directly observable through electron microscopy, as illustrated in Fig. 8. Combined with SEM-EDS analysis, the carbonation process of recycled cement paste fine powder (RP) was found to involve two distinct steps83: step 1 featured the presence of Ca-rich residue, manifesting as rhombohedron-shaped calcite crystals, while step 2 was marked by Si-rich gel with agglomerated particles. The particles in the gel products, initially appearing to be of nano size, were significantly affected by agglomeration, leading to changes in their final size. In addition, Zajac et al.96 found that Al and Si from the hydrates do not diffuse out of the grains, instead remaining within the space initially occupied by the hydrates. A significant part of the Al from the carbonation of the ettringite and AFm phases is incorporated into the alumina-silica gel, rather than precipitating as a separate alumina hydroxide gel.

Image adapted from refs. 82,83,97,98.
In the synthetic C-S-H system, similarly, a large amount of calcium carbonate, mainly vaterite, is formed with the generation of modified silica gel after exposure to CO297. Zheng et al.98 employed SEM and TEM to investigate the carbonation process of alite hydrates, revealing that calcite is the dominant phase of carbonate crystals throughout the entire carbonation period in the alite system. These crystals initially formed as spindle carbonates on a C-S-H substrate but eventually evolved into rhombohedron shapes. The growth rate of calcite particles was estimated to be ~0.2 μm/day, potentially influenced by the relative concentration of calcium ions and the CO2 source: A gradual increase in c(CO32−)/c(Ca2+), mainly caused by the variable CO2 migration speed over time, leads to a tendency for calcite to transform from spindle to polyhedron.
Regarding the microstructure of hydrated cement paste blended with carbonated recycled cement paste powder (CRP), Ouyang, et al.82 discovered that strong chemical interactions between CaCO3 and C-S-H facilitated the perpendicular and uniform growth of C-S-H on the surface of CRP. In addition, the alumina-silica gels in the carbonated paste are highly reactive, achieving a complete reaction within 28 days of hydration. These attributes make CRP a promising candidate for clinker replacement in composite cements12.
Raman spectroscopy stands out as a highly effective method for the accurate detection and monitoring of the carbonation process in cementitious materials, as demonstrated in Fig. 9. When subjected to a CO2-enriched atmosphere, Raman spectra analysis consistently revealed a prominent peak near 1090 cm−1, which is a reliable indicator of the presence of calcite18,99. By utilizing standard specimens pre-mixed with defined quantities of CO32−, researchers can initially establish a robust correlation between CO32− content and Raman peak intensity. This correlation enables a quantitative investigation into CO2 ingress and the extent of carbonation within the cement paste100. When considering the temporal aspect, a series of calcium carbonate polymorphs, including disordered calcium carbonate, ikaite, vaterite, and calcite, can be formed at different stages of elite carbonation ref. 101. It is worth highlighting that carbonation can induce chloride redistribution within the paste and accelerate the corrosion of steel reinforcement80. This effect results from the gradual release of bound chloride ions, leading to an increase in the concentration of free chloride ions. In contrast, the carbonation-induced drop in pH value was found not to be the direct cause of the corrosion of the steel reinforcement.

Images adapted from refs. 80,100,101,211.
Long-term durability problems
Compared to the blank cement paste, pastes blended with sustainable materials often pose more significant durability challenges due to the complex hydration kinetics and the emergence of a more heterogeneous microstructure. In this section, we reviewed the long-term performance issues associated with blended cement-based materials.
Degradation of cement paste usually involves ion transport through the cement matrix, changes in the microstructure of hydration products, and the formation of new products, which can be tracked through SEM/TEM imaging and element mapping (EDS, μXRF, and micro-Raman) techniques, as shown in Fig. 10. Traditional methods for assessing chloride profiles in concrete, such as profile grinding, are known to be labor-intensive and time-consuming. To address these challenges, ref. 102 used μXRF to measure chloride penetration depth and calculate the apparent diffusion coefficient. Their findings highlighted the potential of μXRF for efficiently and rapidly evaluating chloride profiles in both laboratory and field concrete over a wide range of chloride penetration depths. Notably, the information obtained through μXRF was found to be equivalent to or even superior to that derived from profile grinding methods. Similarly, with μXRF, Sudbrink et al.103 imaged the change of sulfur and potassium distribution in the cement paste with and without silane coatings in a large scale (cm-level).

The causes are chloride permeation (by uXRF)212, sulfate attack (by SEM-EDS)104, ASR (by SEM)26,105, and chloride-induced corrosion (by SEM)106.
To better reveal the micro-degradation in sulfate attack, ref. 104 developed a novel method to investigate sulfate ion ingress under unidirectional capillary action using BSE imaging and EDS mapping. Operating at a 5 mm-depth scale, this approach allowed for the comprehensive analysis of both phase assemblage and element distribution information. It revealed that physical and chemical sulfate attack occur in different areas of the same sample. Leemann, et al.105 observed the morphology of amorphous and crystalline ASR products with SEM, revealing that the amorphous ASR products are formed initially, leading to aggregate cracking. Subsequently, crystalline ASR products began to fill the open cracks in the aggregates. Comparative observations through a steel-concrete interface and corrosion products from reinforcing steel into concrete revealed that only a small amount of corrosion was needed to induce visible cracking106. Moreover, both BSE imaging and element maps (e.g., Fe, Ca, and O) clearly illustrated a distinct boundary between the affected and unaffected paste areas, providing a visual representation of the extent of the penetration front.
Strength and limitations
As micro and nanoscale experimental probes continue to advance rapidly, the attainment of high-resolution morphological and chemical data from target materials in laboratory settings has become more accessible. The combined utilization of two or more testing methods has the potential to expand the range of measurable information. However, as highlighted by ref. 107, there exists an inherent trade-off between the achievable resolution and image volume, or more succinctly, the statistical robustness of results. Take X-CT as an example, on the one hand, imaging at the millimeter scale enables the capture of microcracks, but may exclude larger cracks, lacking the representativeness necessary for comprehensive analysis. On the other hand, a large proportion of fine microcracks (<10 μm), such as those induced by drying shrinkage, will be excluded if imaging is carried out at cm scale. Similarly, in element mapping, opting for a larger testing area in μXRF conditions necessitates accepting a lower resolution, resulting in the potential loss of localized information. Until now, no single technique exists that can capture the full-size range of features, from nanometers to tens of micrometers, within a sampling volume that is sufficiently representative.
Moreover, the quantitative interpretation of informative imaging data is another crucial aspect demanding greater attention. While a substantial number of BSE images of cementitious materials have been generated, most of them lack detailed quantitative information. Without a standardized protocol for sampling and imaging, considering also the wide variety of sample types and test conditions, cross-comparison between different methods, or even the same method performed by different research groups, is difficult. This lack of standardization leads to underutilization of the generated data, limiting the potential for comprehensive insights, especially the training and application of deep learning models that rely on substantial quantities of high-quality images for effective training. Addressing these challenges is crucial for advancing the field and enhancing the reliability and interpretability of imaging data in concrete research.
Synchrotron radiation-based morphological and crystochemical micro-probes
The phenomenon of synchrotron radiation was first discovered in the 1940s. In brief, it is the generation of electron magnetic waves (e.g., X-ray) when charged particles are radially accelerated108. Synchrotron radiation X-ray is often characterized by extremely high brightness, tunable energy, and high coherence, making it an ideal beam source to develop characterization probes of physical and chemical processes at multiple temporal and spatial scales. After extensive development in the past half century, more than 50 synchrotron facilities (third generation) are now in operation world-wide, serving a broad categories of research fields such as life science, material science, chemical science, geoscience, physics, applied science.
The readers are referred to published books for the basic knowledge of synchrotron radiation108,109. In this chapter, we aim to provide a landscape picture of several synchrotron radiation-based methods that are widely used in the study of cementitious materials. Echoing the theme of this review paper, we only focus on methods with microscale spatial resolution, in particular micro-X-ray Absorption Spectroscopy (micro-XAS), micro-X-ray Diffraction (micro-XRD), micro-X-ray 2D&3D imaging methods. These methods have been extensively used to provide microscale chemical, mineralogical, and morphological information of cementitious system in the past decade. We notice that similar review works have been reported previously110,111,112, yet we differentiate ourselves with a focus on sustainable-related studies (such as waste utilization, durability enhancement, carbon sequestration), and the update in the past 5 years.
Principles of application
X-ray interacts with a solid volume in multiple ways (Fig. 11a). It is either transmitted, scattered/diffracted, or absorbed by the solid. Characteristic absorption of x-ray takes place when the incident beam energy is close to the difference between inner orbital electrons and the vacant outer orbitals. Recording the beam intensity loss or the number of emitted electrons yields the absorption spectrum. The x-ray absorption spectrum (XAS) features of an element depend strongly on its chemical environment, making it a fingerprint information for phases either crystalline or amorphous. In a synchrotron XAS beamline the incident x-ray could be focused to micron-size spot which, coupled with a multi-direction sample stage, enables examining the microscale chemical heterogeneity of a solid samples113. This is extremely useful for concrete samples, which are often composed of multiple phases at micronscale. With incident beam energy ranging from 1500 to 4500 eV, elements like Si, Al, S, Cl, K, and Ca could be studied114,115, yielding useful microscale information during concrete degradation. At higher beam energy from 4500 to 10,000 eV, a list of heavy metal elements (Zn, Cu, Co, Cr, etc.) can be studied to track their long-term fate in concrete, which are crucial in the utilization of waste for sustainable concreting116. The XAS of Fe (7000–8000 eV) also provides invaluable data on the microscale formation of transformation of Fe (hydr)oxide species during the corrosion degradation117.

a Illustration of x-ray interacting with a solid sample. Explanation of the ptychographic imaging scheme: b Phase relationship of two overlapped scattering spots; c The overlapping of multiple scattering spots provides robust solution to the phase problem.
XRD is a widely adopted material characterization tool. Benefiting from the high brightness of synchrotron x-ray, micro-focused beam generates XRD data of high signal-to-noise ratio even at single-minute exposure, enabling reliable quantitative analysis from Rietveld refinement118. Debye-Scherer rings recorded on 2D panel detector allow probing the local crystal orientation118,119. Such a micro-XRD probe is a power tool to study localized interaction between crystals.
X-CT is ubiquitously used to probe the 3D structure of cement-based specimens120. In either scanning or full-field projection mode, the transmitted x-ray carries the information of attenuation coefficient. With Fourier Transform-based iterative algorithms, the recorded projection data reproduce attenuation-contrast images, where contrast is more pronounced between regions with different attenuation to x-ray. For cement-based specimens, less porosity and/or higher content of heavy atoms usually result in higher attention. While currently, the most advanced laboratory X-CT provides a 1-μm resolution (usually requiring several hours of scan), focused synchrotron X-ray allows a resolution as high as 20 nm, thanks to the much brighter beam source and smaller beam spot size. The scanning of synchrotron X-CT is also more rapid, e.g., several to tens min per sample, enabling in situ observation of fast-evolving systems.
The limitation of X-ray image resolution is ultimately determined by the spot size of the beam, which can hardly be focused below 10 nm. In the past decade, a new imaging approach named ptychography has been developed in multiple synchrotron facilities. The fundamental of ptychography is to solve the ‘phase problem’: x-ray detectors only record the intensity (amplitude) of the X-ray; hence, its phase information is lost. An X-ray beam is described by a complex number Z since it has both phase and amplitude. When it passes through two overlapped regions, it yields the individual scattering Z1 and Z2, and an overlapped scattering Z1 + Z2. The angle φ between Z1 and Z2 can be solved as it is determined by the edge length of the triangle in Fig. 11b, i.e. the amplitude |Z1|, |Z2|, and |Z1 + Z2|, which are recorded on the detector. What is left unknown is the sign of φ. In a ptychographic scanning, an extensive overlapping between scanning regions is conducted (example shown in Fig. 11c), providing sufficient overlapping intensities to solve the relative phases between adjacent scatterings. Therefore, the limit of resolution is determined by the step size of the sample stage movement, which could be 1–2 nm.
The mathematics behind ptychography was proposed several decades ago121. Due to the limitations of computing power and scanning devices, only until recently, it was extensively developed in several synchrotron facilities122,123. It is also straightforward to conduct a ptychographic-CT scan. Its advantage is not only the improved resolution, but also the capability of phase-contrast imaging, which helps differentiate hydrates in cement paste that have similar attention coefficient and cannot be distinguished using normal x-ray imaging124.
Sample preparation
Samples used for synchrotron microprobes should be prepared at minimal alternation to the microstructure. Drop-cast powder samples and natural (fracture) surfaces can be directly used for observation. Polished surfaces and thin sections are also often used but with careful impregnation of resin to preserve the microstructure during polishing. The samples cannot be too thick if a transmitted X-ray is recorded. For tomographic scanning, the samples need to be thin in the planar direction perpendicular to the rotation axis. Examples are given as follows.
Micro-XAS and micro-XRD
Both micro-XAS and micro-XRD require a relatively flat surface to interact with the incident X-ray. This could be achieved via a polished cross section or a thin section (Fig. 12a, b). To protect the microstructure during polishing, the samples are often impregnated with resin. The process is comparable to the preparation of SEM-BSE samples as introduced in the previous section. The epoxy used should have very low viscosity such that it impregnates into the fine porous structure of cement-based materials. The heat release from the resin hardening should also be low to minimize thermal expansion damage to the microstructure. Figure 12a displays an example of a polished cross section of an ASR production vein125. The heat map is the concentration of K (potassium) measured by the XRF detector in the micro-XAS beamline. In comparison with SEM images of the same area, a region with high K content (red color) has a crystalline feature, while the region with low K content (green color) has an amorphous feature. The focused beam measures the Ca K-edge XAS of multiple points inside each region. The distinct peak features suggest different molecular structures.

a Polished surface125, b thin section118, c drop cast of powders115, and d thin rod/cuboid26,131.
When the detector and beam source are on the same side of the sample, the recorded signal is reflective of the incident beam, hence the thickness of the sample is not critical. Whereas when detector and incident beam are on opposite sides, the sample needs to be sufficiently thin to allow the transmission of x-ray (Fig. 12b). The required thickness is typically in the range of 100–101 µm, and thinner when the incident beam energy is lower. The transmission makes sample preparation more difficult but usually benefits the spatial resolution, as the incident beam interacts with a smaller volume of solid in transmission compared to reflection mode126.
An example of a thin section sample is given in Fig. 12b118. It was extracted from aged concrete, impregnated with resin, and mounted to a handling tool for polishing. When polished to ~80 µm thick, the thin section was dismounted from the handle by dissolving the glue between them using a special solvent. The thin section was then placed on the sample stage of a micro-XRD beamline in the Spring-8 synchrotron facility. The incident beam was focused to scan the area of interest on the thin section, yielding Debye-Scherrer rings on a plate detector. Integration of the rings will yield normal x-ray diffractogram that allows qualitative/quantitative analysis of the crystallography of the scanned area.
Drop cast is another common way to prepare powder samples for transmission measurement (Fig. 12c). Both dry127 and liquid-suspended114 powders can be dopped to a thin substrate that are transparent to x-ray, such as a silicon nitrite window. This is useful in studying particles undergoing reactions, such as hydration128, carbonation129, and convention115, since the alternation to particle morphology is negligible during the drop cast. This setup works for micro-XRD, micro-XAS, and imaging techniques such as ptychography.
Micro-X-CT and ptychography
A tomography scan requires the sample to always stay within the field-of-view during rotation, i.e. the sample dimensions need to be small along the planar direction perpendicular to the rotation axis (Fig. 12d). The sample should be either originally in that geometry, or carefully extracted from a solid bulk without modifying the microstructure. For example, cement paste can be cast into capillary tubes and subject to micro-X-CT scan in both fresh and hardened conditions in an in situ manner130. When coupled with SEM, a focused ion beam (FIB) enables extracting specific sub-volume of interest. The extracted cuboid can be readily tens of microns in size, suitable for micro-X-CT measurement. A micro cuboid from an ASR-damaged concrete and a micropillar from a hydrated cement are shown in Fig. 12d, both cut with FIB. They were subjected to micro-XRD scan afterwards26,131 The ASR cuboid reported26 was further subjected to an atmosphere of controlled RH, enabling the in situ observation of moisture uptake into ASR.
Ptychography scan is in transmission mode, hence sample must be sufficiently thin. Thin sections, drop cast115,128, capillary tube casting130,132,133, and FIB cutting131 are all suitable ways to prepare samples for ptychographic imaging. Ptychography data can be readily used for computed tomography. Compared with micro-X-CT, ptychographic-CT usually takes a much longer time to collect the projections (up to several hours). It is critical to ensure the samples are not affected by dehydration/carbonation during the scanning. Samples encapsulated in capillary tubes or impregnated in resin are usually stable during long-term scanning.
Applications in sustainable materials in concrete technology
The application of the above synchrotron microprobes in sustainable cement and concrete study is introduced in this section. Focus is given to micro-resolved studies, thus synchrotron powder XRD is not included here, though there is a large quantity of work in this field.
Supplementary cementitious materials
SCM has been extensively studied using conventional lab-based methods. The micro-heterogeneous and amorphous nature of SCM is hard to capture using conventional methods, yet the combined used synchrotron microprobes have provided unique insights in the property of raw SCM particles and their hydration.
The fly ash particles are known to contain multiple components with distinct chemical composition and crystallinity. The Al and Si species are crucial to its pozzolanic reactivity. Li et al. used ptychographic imaging coupled with micro-XAS and nuclear magnetic resonance (NMR) to study such micro/nano heterogeneity134. As shown in Fig. 13a, the ~10 nm resolving power in transmission mode unveils the uneven distribution of matter in a fly ash particle. The micro-XAS data at Si and Al K-edge suggest three components that contain both Si and Al (Fig. 13b). The Si K-edge of SiO4 tetrahedra connected with four-fold coordinated Al (AlIV) is higher than SiO4 tetrahedra sharing oxygen with six-fold coordinated Al (AlVI). Through spectrum comparison with reference minerals, it was found that AlIV exists in homogeneous mullite particles (red particle in Fig. 13c), while disordered AlIV and AlVI may co-exist in some particles (green and blue, respectively, in Fig. 13c). Hu et al. combined micro-X-CT with nano X-ray fluorescence (XRF) to investigate the 3D chemical heterogeneity of a fly ash particle135 (Fig. 13c). Element distributions were rendered with the 3D structure, suggesting that soluble elements such as Ca and K are more on the surface and may contribute to early hydration, while Fe is inside the particle may have negligible influence on the hydration system.

a Ptychographic imaging of fly ash particles and c the heterogeneous distribution of different Al species based on b the K-edge XAS features of Al and Si134; micro-X-CT results of d a fly ash particle (with Au ball marker attached)135, e a hydrated OPC-silica fume-volcanic ash paste136, and f an LC3 paste at various ages137.
Micro-CT was also reported to study the microstructure of hardened OPC paste containing silica fume + volcanic ash136 (Fig. 13e). The resolved 3D pore structure suggests that substituting OPC with these SCMs helps refine the pore space. The benefit effect is maximized at 10% silica fume + 10% volcanic ash substitution, and vanishes when volcanic ash is above 50%. This finding guides the environmentally friendly usage of volcanic ash disposals. A similar micro-CT work was reported for OPC paste containing limestone + calcined clay137 (Fig. 13f). Four components were resolved by the phase-contrasting mode at 10−1–100 µm resolution: porosity, hydrates, unhydrated cement and calcite. It provides direct evidence that the calcite particles has reacted from 28 to 60 days, accompanied by a significant drop of pore connectivity. The finding adds novel knowledge to the hotly studied LC3 cement.
Other low-carbon approaches
Strength-boosting admixture may reduce the demand for cement in the mix design, hence reducing the embodied carbon in concrete. Li et al. studied the influence of C-S-H138. Quantified analysis of the 3D images suggests that C-S-H seeding increases the hydration product by 10–15% in the first few hours of hydration, hence densifies the pore structure (Fig. 14a). This effect is more pronounced when the Ca/Si ratio of the seed is lower. Artioli et al. monitored the hydration of OPC with and without PCE using micro-X-CT139. Radial distribution functions were calculated between the unhydrated cement and the hydration products at 7 days of hydration. A much better spatial correlation is observed between them in the absence of PCE, suggesting that the hydration product tends to nucleate and grow on cement surfaces when PCE is not used. In the presence of PCE, hydration products tend to nucleate and grow in the solution.

a Hardened paste modified by C-S-H seeding138; b fly ash geopolymer in comparison with c mercury intrusion porosimetry (MIP) date140; d ITZ of recycled aggregated149; e Roman concrete from relics of Pompei141.
Geopolymer has been extensively studied as a low-carbon binder in the past decades. Das et al. used micro-X-CT to study the microstructure of alkali-activated fly ash (AAFA)140 (Fig. 14b, c). In the activated AAFA paste, 10–20 μm pores contribute the most to the total porosity. Permeability can be reasonably predicted from 3D images, while tortuosity is found to be a critical factor to permeability and may drastically change in the later age of hydration.
Recycling aggregates from demolished concrete is an important pathway towards sustainable concreting. The interface between recycled aggregate (RA) and new cement matrix is usually a weak zone both in mechanical and transport behavior. Leite and Monteiro studied such interface in concrete containing RA from different sources and in distinct initial moisture conditions (Fig. 14d). Micro-X-CT data reveals the release of air bubbles at the interface when RA is initially dry, whereas the ITZ is much denser when RA is in saturated-surface-dry (SSD) condition. A pronounced portion of large bubbles (equivalent diameter >100 µm) is found in ITZ near dry RA, whereas the ITZ near SSD RA contains mainly 20–40 µm bubbles. Ancient Roman concrete was also studied by the same team141 (Fig. 14e). A cuboid sample collected from Pompei relics was scanned by micro-X-CT to study its permeability. Compared to OPC concrete, the studied Roman concrete sample has relatively high porosity, low connectivity, and similar water permeability. A novel improvement reported in this study is the usage of a machine learning (ML) algorithm to segment the pores, aggregates, and paste matrix142. This has been challenging since a global gray value threshold between low-density hydrate products and porosity is hard to determine. The applied ML algorithm conducts segmentation based on multiple features alongside the gray value.
Long-term behavior
Many papers were published to explore the interaction of heavy metals in cementitious materials, by researchers who study concrete as a shielding material for underground repository of radioactive waste133,134,135. A review can be found in ref. 143. The methodology is consistent, i.e., soluble forms of metal elements were added to cement paste, which were subjected to storge for an extended period. Combined synchrotron microprobes, such as micro-XAS and micro-XRF, are used to detect the micro-concentrating of the elements and to understand their local chemical environment. An example is given in Fig. 15a, where Co speciation was found to largely depend on the availability of oxygen. The extended X-ray absorption fine structure (EXAFS, a unique type of XAS) data collected from micro-XAS setup was Fourier transformed to radial structure function (Fig. 15b), where the peak positions correspond to the distance between the center atom (Co) with the atoms shells surrounding it. By comparing with the measured data of reference phases with known structure (e.g., Co(III)-asbolane, Co(III)-buserite, Co(III)OOH, and Co(II)OH in Fig. 15b), the chemical condition of the measured Co area can be interpreted. In the absence of oxygen Co(II) mainly exists in a Co-hydroxide-like phase, while in the presence of oxygen Co(III) is more dominant and tends to be incorporated into a CoOOH-like phase.

a Speciation of cobalt (Co) in hardened cement paste and b Phase assignment by comparing the radial structure functions obtained from micro-XAS213; c Micro-XRD of the vicinity of rebar undergoing corrosion and d the Fe speciation from quantitative XRD analysis144; e 3D distribution of various alkali-silica-reaction products from tomographic micro-XRD scan26.
Micro-XRD is also used to study the corrosion process of iron in concrete, e.g. the rebar144 or iron particles from GGBS145. In the example in Fig. 15c, a rebar embedded in concrete underwent fast corrosion via accelerated ingress of chloride. The cross section was subject to micro-XRD scanning at a spatial resolution of 101 um. The obtained 2D diffraction pattern of each scanned pixel (Fig. 15d) was integrated into the diffractogram and analyzed to yield the quantify of the crystalline component, e.g., green rust, akageneite, goethite, and iron. The finding suggests a 1 mm spreading distance of iron (hydr)oxide in the binder after 44 h of corrosion. The initially formed green rust that contains Fe(II) and Fe(III) tends to become ferric oxyhydroxides during the spreading. The different corrosion behavior of stainless steel was reported by another micro-XRD study, suggesting that goethite and akaganeite are the main (hydr)oxide product of stainless steel in concrete containing chloride146,147,148. Goethite forms closer to the surface of the steel where Cr is richer, whereas akageneite forms at a distance where Cl is rich. A combined micro-XRD and micro-XAS study of aged GGBS concrete shows that the particular Fe(0) was no longer visible in a seawater condition, proving the micro-accelerated corrosion in Cl-rich environment145.
ASR is a threat to concrete containing alkali and reactive silica. A lot is unknown about the expansive ASR product as it resides in small cracks inside concrete. Geng et al.115 used micro-XRD in tomographic model and obtained 3D data of the diffractogram of a product vein, under in situ varied RH condition (Fig. 15e). Two ASR products with similar layered structure but distinct water-absorbing behavior were identified. The long-accepted theory that ASR product swells when in contact with moisture was challenged as the in situ CT scans revealed no volume change of the product agglomerates when the product absorbed water.
Bossa140 and Tan149 used micro-CT to monitor the concrete microstructure change during water leaching. The high resolution and non-destructive approach allow a direct comparison at 10−2–101 µm scale140. The size and the connectivity of the pore structure were quantified from the 3D images. Using random walk simulation, the diffusion coefficient of were revealed to increase by 50 and 100 times higher when leaching at 20 and 80 °C occurred, respectively. The Ca(OH)2 dissolution is faster when the aggregate is close to the dissolution front, likely due to the presence of ITZ on the aggregate surface149.
Strength and limitations
Synchrotron radiation facilities offer a set of micro-resolved probes. Attributing to the high brightness and tunable energy, these probes often come with high resolution in both space and time, making them powerful tools for studying systems that evolve rapidly and/or with high spatial heterogeneity. Without the need for a vacuum condition, synchrotron probes can be in situ for hydrated systems, which is impossible for electron microscopies. The element-sensitive methods such as micro-XAS allow tracking the speciation of elements-of-interest, providing valuable information to understand the fate of heavy metals in wastes when using them in concrete. These are all advantages of synchrotron-based methods over conventional laboratory methods.
Meanwhile, synchrotron probes obviously are not easily accessible. The application-approval-experiment cycle can be as long as a year. One must have sufficient understanding of the samples using conventional probes, and use synchrotron probes primarily for problems that can only be solved by these unique methods. The researchers must have sufficient experience with synchrotron facilities, since there are not too many chances for try-and-error. Last but not least, traveling to a synchrotron facility can be costly, especially when it is overseas.
Micro- and nanoscale mechanical testing methods
Principles of application
Atomic force microscopy (AFM), nanoindentation, and nano scratch are the predominant methods for examining the mechanical characteristics of cementitious materials on a micro or nanoscale. These techniques enable researchers to investigate the micro/nanostructure and mechanical properties of materials. They facilitate the measurement of mechanical properties like elastic modulus, hardness, and fracture toughness at the nano-sized regions of tested materials. AFM can generate force-distance curves when in contact with the sample surface, offering valuable insights into stiffness and adhesion force150. The nanoindentation technique was pioneered by Nix in 1986151 and subsequently by Pharr in 1992152. Initially employed for the examination of homogeneous materials, it has since found broad application in the analysis of heterogeneous materials, such as cement-based materials. Nano scratch has gained growing popularity as a technique for nanoscale assessment and profiling of thin films, coatings, and bulk materials. This method is invaluable for evaluating adhesion strength, scratch hardness, wear resistance, fracture strength properties153,154, fracture toughness155, and interface bond strength156,157 across a diverse range of materials. The coefficient of friction can be determined by the ratio of lateral force to normal force between the indenter and the test material. These parameters effectively capture the nano-tribological behavior exhibited by the materials under examination.
In terms of testing principles, ref. 158 have noted that there is no substantial distinction between AFM indentation and traditional nanoindentation. Despite the shared objective of extracting mechanical information, their operational methodologies differ significantly.
AFM
Figure 16 depicts a schematic representation of a typical AFM utilizing a laser beam deflection system. This AFM system comprises essential components, including a probe (a microcantilever with a sharp tip), a focused laser beam, and a photodetector. Additionally, a scanner and a feedback loop are integral parts of the setup. The fundamental concept behind AFM design is to measure the atomic forces at play between the probe and the test sample159. When the distance between the sharp tip and the sample reaches critical proximity, the interatomic interactions become significant, allowing the sensitive cantilever to detect minute variations in these forces. The curve depicting the relationship between force and tip-sample separation during a single-cycle AFM test is shown in Fig. 16.

The tests include nanoindentation, nanoscratch, and AFM test.
Taking the example of the contact mode, during the testing process, the flexible cantilever undergoes deflection as the relative distance between the sharp tip and the sample changes while scanning. The cantilever’s deflection is continuously fed into a feedback loop, which in turn adjusts the height of the probe support to maintain a constant cantilever deflection. This procedure allows for the acquisition of force signals through the feedback output.
Nanoindentation
The nanoindentation testing process is relatively straightforward. In a nanoindentation test, a known indenter with specific geometric and mechanical attributes is progressively pressed into the test material as the applied load steadily increases until it reaches a predefined threshold. Subsequently, the load is held constant for a period to mitigate creep effects and then gradually withdrawn. Throughout the test, the applied load (P) and the depth (h) to which the indenter penetrates are meticulously recorded.
Nanoindentation offers more advanced capabilities, including grid nanoindentation analysis. In this approach, an extensive grid is superimposed onto a designated area of interest within a material, with nanoindentation tests performed at each grid point. Through the integration of statistical analysis, the mechanical properties of individual phases are deduced. The application of the Statistical Nanoindentation Technique (SNT) has yielded a wealth of research findings and theories160. Building on this foundation, more advanced data acquisition methods, such as modulus mapping, have been introduced to expedite scanning and gather additional data.
Nano scratch
In contrast, nano scratch serves a different purpose. Rather than providing detailed point-by-point information on material modulus and hardness, nano scratch is employed to investigate the continuous region of material, specifically focusing on the study of nano-tribological behaviors161.
In a nano scratch test, an indenter is first applied to the specimen by exerting force upon it (Fig. 16). Subsequently, the indenter is drawn in a straight line across the surface of the tested specimen at a predefined velocity. The nano scratch testing system comprises two transducers: one for monitoring the control force (normal force) and displacement in the pressing direction, and the other for recording the force (lateral force) and displacement in the direction of movement162. Additionally, it is customary to perform a pre scratch scan and a post scratch scan with minimal load in conjunction with the nano scratch test. These scans serve to establish the initial surface topography and determine the residual scratch depth163,164. The penetration depth values can be computed by subtracting the data from the pre scratch scan from that of the scratch test itself.
Nano scratch testing encompasses several modes, including constant load nano scratch tests, ramped load nano scratch tests, and multi-pass repetitive unidirectional constant load nano scratch tests, commonly referred to as “nanowear”161. The distinguishing feature of nano scratch testing is the continuous monitoring of mechanical parameters throughout the test. Consequently, it is anticipated that this method will yield a more extensive dataset in the specified test area compared to other discrete point measurement techniques.
When considering the application scope of each testing method, it’s important to consider the resolution ratio and measuring range. Studies have reported AFM tip radii as small as 8165, 5, and even 2 nm166. Notably, in research focused on cement-paste materials, the typical contact depth has been reported to be in the range of only 2 to 10 nm167. In nanoindentation, the commonly used Berkovich probe typically features a nominal radius of curvature of 150 nm, although some tests have reported larger values, such as 600 nm168,169. The appropriate maximum indentation depth for studying C-S-H in cement-based materials falls within the range of 100 to 300 nm170. It’s worth noting that research indicates that the actual volume of interaction between the indenter and the material in a nanoindentation test can be greater than the volume penetrated by the indenter, extending up to 1 μm³158.In current cement-based material research, the constant load nano scratch test is a standard method with loads typically ranging from 2 to 8 mN and scratch lengths varying from 10 to 200 μm162,163,164. For example, a Berkovich indenter with a 600 nm radius was employed in a nano scratch test162. Under a normal force of 4 mN, the average penetration depth in the C-S-H phase was approximately 466 nm. In certain specialized cases, maximum loads of 50 mN and corresponding depths exceeding 1 μm were observed171. Additionally, it’s important to maintain significant spacing between each nano scratch test. Hence, AFM offers distinct advantages in examining the local mechanical properties of individual phases due to its capacity to characterize smaller interaction volumes and higher resolution. In the case of nanoindentation and nano scratch, their capability for quantitative nanomechanical mapping at the microscale presents clear benefits for the investigation of nanomechanical properties in multiphase materials.
Sample preparation
The theory behind nanoindentation testing relies on the infinite half-space model and presupposes that the surface is ideally flat and smooth172. It has been observed that elevated surface roughness can adversely affect results obtained by other modern techniques such as AFM and nano scratch. To meet the necessary criteria, grinding and polishing are necessary.
The polishing process generally aligns with the techniques used to prepare samples for BSE observation. The distinction lies in the resin impregnation process. For nano mechanical testing, it’s crucial to avoid a vacuum environment after applying the resin to coat the samples, ensuring the resin does not penetrate the sample pores. If the pores are filled with solidified resin, it can alter the mechanical properties.
Several studies have highlighted the sensitivity of the nanoindentation test to the sample’s surface roughness. In certain investigations, it was observed that an escalation in surface roughness is correlated with a higher level of scattering in indentation outcomes173. Correspondingly, a reduction in nanomechanical properties with an increase in roughness was noted by other researchers174. Howind et al.175 suggested that the AFM test, owing to its minute and pointed tip, is minimally influenced by surface roughness and primarily affected by nanoscale defects in determining the modulus results. Nevertheless, there exist divergent perspectives regarding the impact of surface roughness on nanomechanical testing outcomes facilitated by novel techniques.
Once the sample is ground and polished, it is typically subjected to examination using AFM. Through an assessment of the surface topography, the surface roughness of the tested sample can be computed. A widely utilized method for this calculation is the root-mean-square (RMS) method176. The RMS roughness criterion, put forth by ref. 172, has gained widespread acceptance. This criterion stipulates that the scanning size should be a minimum of 200 times greater than the average depth “h” of the initial phase, ensuring the measurement size surpasses the length scale of the largest material heterogeneity. Moreover, “h” should exceed five times the RMS roughness to guarantee the self-similar properties of indentation analysis. To meet the requirement, a polishing duration of 2–4 h with 1 μm diamond paste on a hard, perforated pad would be necessary.
It’s important to highlight that whether the assessment of the surface is conducted via AFM or virtual topographic experiments, only a few positions within dozens of microns are selected. Therefore, measuring roughness across numerous positions is crucial to accurately represent the overall characteristics of heterogeneous, porous cement-based materials.
Interpretation of data
The mechanical properties, namely the indentation modulus (M) and hardness (H) of the indented region, were determined using the Oliver–Pharr method by examining the initial portion of the unloading curve152.
Here, ({rm{S}}={left(frac{{rm{dP}}}{{rm{dh}}}right)}_{{rm{h}}={{rm{h}}}_{max }}) represents the contact stiffness at the initial slope of the unloading curve, with ({{rm{h}}}_{max }) denoting the maximum penetration depth. The geometrical correction factor, ({rm{beta }}), is assigned a value of 1.034 for the Berkovich tip. The projected contact area, ({{rm{A}}}_{{rm{c}}}), is determined using Eq. (3), while ({{rm{P}}}_{max }) signifies the peak load.
The contact depth, ({{rm{h}}}_{{rm{c}}}), can be computed as Eq. (3)(4) from the reference152. The half cone angle ({rm{theta }}), is established at 70.32° for the Berkovich tip.
Where ({{rm{a}}}_{{rm{u}}}) is the radius of the projected area of contact between the indenter and the indented material at the onset of unloading.
Data acquired through nanoindentation can undergo statistical analysis. The deconvolution process, as described in reference177, enables the determination of volume fractions and mechanical properties for each phase within a tested composite material. The calculation model for AFM indentation varies slightly due to differences in tip shapes. When determining the commonly studied elastic modulus, a Derjaguin–Muller–Toporov (DMT) model is described in Eq. (6). This model is employed to fit the retract curve (indicated by the blue line in Fig. 16, and it allows us to derive the indentation modulus ({{rm{E}}}^{* }). Subsequently, the elastic modulus of the sample, ({{rm{E}}}_{{rm{s}}}), can be determined using Eq. (7).
In this context, ({{rm{F}}}_{{rm{tip}}}) and ({{rm{F}}}_{{rm{adh}}}) represent the force acting on the AFM tip and the adhesion force between the tip and the sample, respectively. ({rm{R}}) stands for the radius of interaction of the tip, while ({rm{delta }}) denotes the deformation of the sample. ({{rm{E}}}^{* }) corresponds to the indentation modulus of the sample. Additionally, ({{rm{v}}}_{{rm{s}}}) and(,{{rm{v}}}_{{rm{tip}}}) are the Poisson’s ratios of the sample and the tip, respectively, whereas ({{rm{E}}}_{{rm{s}}}) and ({{rm{E}}}_{{rm{tip}}}) stand for the Young’s moduli of the sample and the tip, respectively.
Applications in sustainable materials in concrete technology
Supplementary cementitious materials
SCMs play a pivotal role in altering the mechanical properties of cement and concrete by inducing changes in both microstructure and chemical composition. Nanoindentation serves as a valuable tool to assess the dispersion of SCMs within the cement matrix, given their distinct modulus and strength characteristics. Wei et al.178 conducted dynamic modulus mapping to identify and quantify phases in OPC and slag-blended cement paste. This technique additionally offers insights into ITZ between SCMs and cement, enriching our understanding of these materials (Fig. 17). Figure 17c presents distinct modulus values for various phases, with the distribution of these phases depicted according to their sizes. When combined with SEM-EDX results, the modulus mapping can identify different phases based on elemental data and offer insights into the microstructure of these phases according to their modulus values.
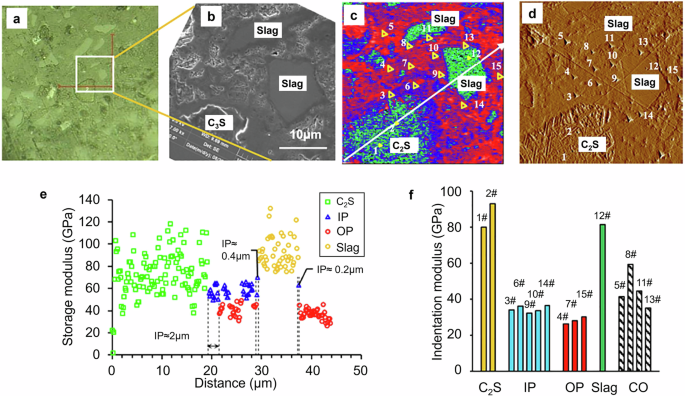
a Optical image displaying the selected area. b Scanning electron microscope image of the designated area. c Scanning probe microscope image revealing the location of indents. d Gradient image displaying the indents. e Chart illustrating the variation of storage modulus along the line in the image (c). f Data showing the measured indentation modulus for each individual phase, with “CO” representing the composite of hydration products and unreacted slag clinkers178.
The results of the nanoindentation test179 reveal that, in concrete with the inclusion of nano silica and nano calcium carbonate, the modulus of the ITZ around coarse aggregates is higher compared to control concrete. This suggests the formation of additional C-S-H due to pozzolanic reactions and the filling of pores by the nano materials. Furthermore, the width of the ITZ around coarse aggregates in high-volume slag-fly ash concretes is reduced due to the incorporation of nano silica and nano calcium carbonate.
Xu et al.163 highlighted the potential of the nano scratch technique as a valuable means to quantitatively assess the heterogeneous phases in cement composites. In a laboratory investigation180, the impact of incorporating graphene oxide (GO) into high-volume fly ash concrete was examined, with particular emphasis on its surface abrasion resistance. The introduction of GO, up to 0.1% by weight of cementitious materials, resulted in enhanced macro-level compressive strength and micro-level friction coefficient. These improvements are believed to contribute to the overall surface abrasion resistance of the concrete. The enhancement of the surface abrasion resistance has great engineering significance. For instance, it is largely beneficial to pavement design as road surface is subjected to frequent scratches.
The enhancements in the mechanical properties of high-volume fly ash concrete, which has been modified with GO, can be attributed to two main factors. Firstly, the increased hydration degree of fly ash particles is a result of the nucleation effect induced by GO. Secondly, the concrete exhibits a denser microstructure owing to the beneficial role of GO in crack resistance. Importantly, no significant chemical alterations were observed in the GO-modified high-volume fly ash mixture, as confirmed by X-ray diffraction and scanning electron microscope/energy-dispersive X-ray spectroscopy analyses.
When seeking to elucidate the variations in bonding strength among phases, relying solely on resolution ratios in microscale experiments such as nanoindentation and nano scratch may prove inadequate. Here, AFM offers a solution for assessing the properties of individual phases. For instance, ref. 150 employed AFM to examine the Hamaker constants of cementitious materials. Their findings revealed that Portland cement possesses a higher Hamaker constant compared to ground granulated blast furnace slag. In addition, SCMs incorporation may influence the chemical composition like Ca/Si ratio, some most recent papers explore the influence of Ca/Si on the surface forces181 and modulus182 of C-S-H by AFM.
To delve deeper into understanding the relationship between surface properties, like Hamaker constants, and bulk properties such as bonding strength, additional pertinent studies are warranted.
Unconventional concrete constituents
In addition to SCMs, which have been found extensive use in concrete technology, there is significant potential for the incorporation of new materials like geopolymer, recycled concrete, glass powder (GP), and carbon fiber in the field of concrete technology.
AFM plays a crucial role in gaining insights into the geopolymer hydration process. Researchers have delved into the influence of aluminum reactions on the nanoscale structural evolution of geopolymers and the ultimate properties of the binder183. In geopolymer mixtures containing aluminum powder, the initiation of the reaction leads to an initial consumption of alkali, followed by its release into the solution at a high alumina concentration. This sequence triggers the formation of polymeric Al(OH)3 species. The precipitation of aluminum hydroxide gel on fly ash particles serves to impede the further dissolution of the ash, resulting in reduced participation in the reaction and gel formation. The findings from AFM analysis affirm that the significant gel formation observed during the early hours of this sample is primarily associated with the products of the aluminum reaction, rather than the formation of robust geopolymer gels considering significant difference in modulus of Al(OH)3 and geopolymer gels.
Khedmati et al.184 employed nanoindentation to investigate ITZs between aggregates and the cement matrix in both ordinary Portland cement concrete and fly ash-based geopolymer concrete. They observed that in ordinary Portland cement concrete, the nanomechanical properties of the ITZ did not significantly differ from those of the surrounding matrix. In contrast, in geopolymer concrete, there was a more noticeable variation in modulus and hardness from the ITZ to the bulk paste.
Pelisser et al.185 aimed to prepare and evaluate the mechanical properties of metakaolin-based geopolymers and mortars. Their findings revealed that the concentration and composition of the alkaline activator were the most influential factors affecting the mechanical properties of these materials. Specifically, samples exhibited optimal performance when a Na2OSiO2/NaOH ratio of 1.6 was employed. Subsequently, this geopolymer was utilized in mortar production, with the highest level of performance attained when combined with sand at a ratio of 1:3 by mass.
The heterogeneity within ITZs constitutes a pivotal determinant of the properties and failure mechanisms observed in geopolymer concrete186. Nano scratch testing has been employed to confirm this assertion. The study further delves into the properties of ITZs that encompass various boundaries, including those at the top, bottom, and lateral sides of individual aggregates within a simulated geopolymer concrete. This comprehensive investigation is carried out using a combination of micro/nanomechanical techniques and image analysis. Scratch result deconvolution reveals that the nano/micromechanical properties of the gel-related phases within ITZs at the upper and lower boundaries surpass those observed at the lateral boundaries and within the bulk paste187.
Regarding the incorporation of recycled solid wastes into concrete, the primary cause of strength reduction can be attributed to the weaker bond formed with the cement matrix. Figure 18 displays the ITZ thicknesses determined through nanoindentation in RAC. The measurements indicate that ITZ thicknesses were approximately 40–50 μm and 55–65 μm for the aged ITZ and the newly formed ITZ, respectively, in RAC188. It also shows that the modulus of older mortar matrix as aggregates is much lower than natural aggregate. The porous microstructure of the old mortar matrix absorbs more water, which could explain the larger area of ITZs. Subsequently, Xiao et al.188 conducted additional investigations to explore the properties of both new and aged ITZs, examining factors such as aggregate types, hydration age, and mix proportions.

a Old ITZs, b new ITZs.
In a separate study, Sidorova et al.189 examined the area surrounding various types of aggregates with different water-to-cement (w/c) ratios. The application of nanoindentation in this research revealed the presence of ITZ around the limestone aggregate, while no discernible ITZ was detected around ceramic aggregates and recycled concrete aggregates. Zhang et al.190 explored the impact of nano silica on the nanomechanical properties of both new and aged ITZs in RAC. Their findings indicated that nano silica has the capacity to enhance the nanomechanical properties of the new ITZ and the surface of the aged mortar. However, no substantial improvement was observed for the aged ITZ.
In addition to RAC, GP serves as an inert filler in concrete as well. Notably, incorporating GP at levels below 20% demonstrates a clear reduction in creep, and an optimal reduction in creep is achieved with a 20% GP content191. The judicious use of GP content effectively enhances the internal microstructure of concrete and promotes higher concentrations of high-density calcium silicate hydrate in the later stages of concrete aging, which aids in creep reduction. This effect can be attributed to the pozzolanic reaction and the microfiller properties of GP.
In contrast to diminishing strength, as observed in the research conducted by ref. 171, the nanomechanical properties of cement composites modified with carbon nanofibers (CNFs) exhibit improvement. This enhancement was assessed through both nano scratch and nanoindentation techniques. Notably, nano scratch testing revealed that CNFs functioned as stiff fillers within the cement paste, rendering the resulting composites more resistant to penetration. Nanoindentation testing uncovered that the inclusion of CNFs resulted in an increased proportion of high-density C-S-H gel. These findings align with prior research outcomes involving multiwall carbon nanotubes192.
Ultrahigh-performance concrete (UHPC) offers an alternative to steel fiber reinforcement, employing carbon fiber (CF) to eliminate the risk of steel fiber corrosion. The effectiveness of this composite relies significantly on the properties of the CF/matrix interface. However, the characteristics of the interface between CFs with varying surface treatments and the UHPC matrix remain unclear. The denser UHPC matrix presents a notably distinct CF/matrix interface compared to conventional concrete, making quantitative characterization more challenging. Pelisser et al.193 conducted a quantitative investigation of the micromechanical properties of the CF/matrix interface in UHPC, employing the nano scratch technique.
The fracture toughness of the interface between the UHPC matrix and CFs, which were subjected to electrochemical oxidation modification, surpassed that of unmodified CFs by ~51%. Additionally, the thickness of the interface transition zone decreased by more than 50%. Furthermore, in comparison to the UHPC matrix without silica fume, the addition of 15% (by weight of cement) silica fume to the UHPC matrix resulted in a 17% increase in the fracture toughness of the CF/matrix interface, accompanied by a 37% reduction in interfacial thickness.
Both oxidation treatments and the application of hydrophilic epoxy coatings led to a decrease in the percentage of C–C bonds and an increase in the percentage of O–C bonds, rendering the surface of CFs more hydrophilic. Consequently, hydration products could form more readily on the CFs’ surface, resulting in a denser ITZ. This densification contributed to higher fracture toughness values and a reduced thickness of the ITZ between the fiber and the matrix.
CO2 mineralization mechanism
AFM is well-suited for investigating the carbonation process by tracking changes in mechanical properties during carbonation. In a study by Yang et al.194, the surface carbonation process of the initial calcium hydroxide crystals was observed. In a pure N2 atmosphere, the surface of Ca(OH)2 appears flat at the nanometer scale. However, with an increase in moisture content, this surface becomes progressively softer. Notably, an instability emerges at approximately 40% relative humidity (RH), signifying the dissolution of the crystal surface. The transformation of Ca(OH)2 into CaCO3 (and potentially Ca(HCO3)2) only occurs when both CO2 and H2O are present simultaneously. The creation of nano-droplets of water is a prerequisite for gaseous CO2 to react with Ca(OH)2. Over prolonged exposure to ambient air, a spherical layer of CaCO3 gradually forms. The use of AFM enables the direct and real-time monitoring of the surface carbonation process (Fig. 19).

a In an atmosphere comprising N2 + CO2 + H2O at around 30% relative humidity (RH) for a duration of 6 days, b during exposure to the ambient air for a period exceeding 1 year, c initial surface of cement with no carbonation and d surface with RH 30% in N2 + H2O atmosphere194.
Additionally, Zheng et al.195 discovered that the morphological changes in calcite crystals during carbonation could be attributed to variations in the surface energy of different facets. This research introduces a novel method for tracking carbonation kinetics and offers fresh insights into the underlying carbonation mechanisms at the nanoscale. In this work, a novel sample preparation technique was devised to examine the carbonation of alite hydrates on a nanoscale level. Alite hydration was carefully managed with a high water-to-solid (w/s) ratio of 100:1. Subsequently, hydration was halted using the freeze-drying method. The prepared sample was then introduced into a carbonation chamber under ambient conditions. Following carbonation for a specific duration, AFM was employed to assess the Young’s modulus of calcite crystals at various stages of carbonation, providing insight into the carbonation process.
In addition to facet development in calcite, its Young’s modulus increases with longer exposure to carbonation (Fig. 20). In summary, this study has established a clear connection between the microstructure and mechanical properties of calcite crystals, offering possibilities to influence the mechanical characteristics of carbonates through the control of their microstructure and chemical reactions. When the carbonation time reaches 30 days, the surface is fully covered by carbonation products, and the modulus reaches 68.7 GPa, which is close to the theoretical value of calcite crystal.

a An illustration of the AFM setup used to measure the Young’s modulus. b An AFM topographical image depicting the morphology of the AFM tip employed. c A representative force versus separation distance curve for a single measurement cycle, using the sample after 30 days of carbonation. d Force versus separation distance curves for calcite at different carbonation times, accompanied by corresponding AFM topographical images. e The calculated Young’s modulus of calcite crystals at various points in the carbonation process195.
Nanoindentation serves as a tool to assess the overall mechanical responses of carbonated hydrate, aiding in the comprehension of the impact of carbonation. In a study by ref. 196, calcium carbonate binders were created by subjecting paste specimens cast with steel slag alone, or steel slag blends incorporating 20% of Portland cement, to CO2 curing under 0.1 MPa gas pressure for a duration of up to 14 days.
The combined calcium carbonates displayed favorable micromechanical characteristics, boasting an average nanoindentation modulus of 38.9 GPa and an average hardness of 1.79 GPa. The enhancements in mechanical strength primarily stemmed from the creation of calcium carbonate, leading to the densification of the microstructure, which, in turn, reduced both pore size and pore volume in the carbonated pastes. To gain deeper insights into the impact of SCMs on the carbonation process, an additional study197 delved into the effects of natural carbonation on the pore structure and elastic modulus of alkali-activated fly ash and ground granulated blast furnace slag pastes after a year of exposure to natural environmental conditions in a laboratory setting. It was found that the dependence of chemical degradation in alkali-activated pastes due to natural carbonation was demonstrated to rely on both the content of GBFS and the development of their pore structure. It was observed that the alkali-activated GBFS paste, with a fine gel pore structure, exhibited no carbonation within the tested period. In addition, the significant reduction in gel decalcification became evident through a notable rise in nanoporosity. As a result, the elastic modulus of the carbonated pastes, in the absence of SCMs, decreased. This phenomenon was further corroborated by nano scratch experiments198, which indicated that the cement pastes had absorbed carbon dioxide prior to decalcification, resulting in a certain micromechanical enhancement throughout the entire carbonation process. However, the decalcification due to carbonation caused the skeletal structure to become more porous and the surface to exhibit increased roughness, featuring a greater number of cracks and pores. Another adverse consequence of carbonation on cement hydrate likely stems from the ITZ. As per findings from experiments199, the penetration of carbonation into the ITZ surpassed that in the cement matrix by several folds, leading to the formation of an interfacial effect zone (IEZ).
Following carbonation, the thickness of ITZ diminished from the range of 50–60 to 20–30 μm. Nevertheless, its porosity remained higher than that of the surrounding cement matrix. Consequently, even after carbonation, the ITZ retained its status as a vulnerable region, leading to a higher rate of CO2 diffusion within the ITZ compared to the cement matrix.
Regarding the carbonated pastes that incorporated SCMs197, the findings indicate that the alkali-activated fly ash, except its pore solution, did not undergo carbonation under the examined conditions. Likewise, the alkali-activated ground granulated blast furnace slag exhibited a high level of density, preventing CO2 diffusion within the sample. This underscores the potential benefits of employing GBFS-rich binders, as they can extend the service life of alkali-activated materials.
To gain a more insight into the carbonation process of the hydrated product in cement pastes, an accelerated carbonation experiment was conducted on C-(A-)S-H powders until equilibrium, involving exposure to 20% CO2 at 80% relative humidity200. This experiment unveiled a notable decrease in the indentation elastic modulus in compacts formed with carbonated powders. Conversely, compacts that underwent carbonation exhibited enhanced micromechanical properties, which were ascribed to the reinforcing effects of embedded CaCO3 nanocrystals and pore-filling mechanisms. The carbonated C-(A-)S-H powders displayed a reduced overall pore volume and featured a fibrous morphology, characterized by thin silica gel foils intertwined with CaCO3 crystals, forming agglomerates.
Long-term durability problems
Despite the widespread use of epoxy in material repairs, there has been a notable lack of fundamental research concerning the mechanisms underlying the bond formation between the adhesive and the concrete substrate. This knowledge gap hinders our understanding of the deterioration mechanisms in bonded joints. When an epoxy adhesive is applied to a concrete substrate, it gives rise to a transitional zone referred to as the interphase, positioned between the bulk epoxy and the bulk cement paste or aggregate. It is believed that the properties of this interphase govern the macroscopic behavior and long-term durability of epoxy-concrete bonded systems. To address this, ref. 201 has introduced an elastic multiscale model for the interphase region, which builds upon the existing body of knowledge. Nanoindentation experiments were performed to provide experimental validation for this proposed model.
The low-density (LD) and high-density (HD) phases of cement hydrates experienced a reduction in modulus and hardness near the interface due to the dissolving effect of the epoxy hardener on the hydration products of the cement paste. This resulted in a stiffening of the cement paste in the interphase region, occurring approximately at distances of 55 and 77.5 μm from the interface, primarily manifesting as an increase in the indentation modulus of the HD phase. Examination of the volume fractions of the interphase material phases revealed a gradual rise in the volume fraction of the LD phase at the expense of the HD phase. Utilizing continuum micromechanics models, it was demonstrated that this behavior can be attributed to the formation of a nanocomposite consisting of LD C–S–H and epoxy. The Mori-Tanaka homogenization scheme elucidated the observed alterations in volume fractions as a function of distance from the interface, showing that the volume fraction of the LD phase decreases while that of the HD phase increases. However, the volume fraction changes of the clinker and UHD phases do not show a consistent pattern with respect to the distance from the interface. It indicates that the permeation of epoxy into the pores of the cement paste led to a notable 50% increase in the effective indentation modulus of LD C–S–H (Fig. 21).

a Light reflection from the surface of a cement paste-epoxy sandwich sample. b The volume fractions of material phases, concerning distance from the interface, in the “Control” group, the material phases from top to bottom correspond to LD C–S–H, HD C–S–H, UHD C–S–H, and clinker201.
Additionally, nano scratch tests202 were conducted to investigate the adhesion of epoxy on both cement paste and limestone surfaces. The results revealed a robust bond between epoxy and cement paste, whereas a comparatively weaker bond was observed between epoxy and limestone. This outcome provides validation for the applicability of the nano scratch test on porous and heterogeneous substrates.
In addition, recent studies203,204 have expanded measurement techniques beyond nanoindentation and nanoscratch to assess the bonding strength between cement and repair materials. Some investigations have included the evaluation of splitting tensile strength at the interface between epoxy and C-S-H. Combining this method with nanoindentation or nanoscratch allows for exploring the correlation between results obtained at these two length scales.
Other less-reported micro mechanical testing methods
Apart from the three techniques mentioned above, some other micro mechanical testing methods are also reported to evaluate the bulk properties of cementitious materials like compressive, tensile, and flexural strength instead of local properties like modulus and hardness.
Shahrin and Bobko introduced a resilient experimental method205 capable of acquiring quantitative insights into compressive failure behavior. This method involves employing uniaxial compression tests on focused ion beam (FIB) milled micropillars. Previously, this technique has proven valuable in exploring size effects in metals.
Upon selecting the area of interest using BSE imaging and confirming its composition via EDS analysis, the FIB milling process for micro-pillar fabrication commenced. Through exploration of various beam currents, dwelling times, energy levels, and milling depths, suitable parameters were identified for crafting micropillars on cement paste.
Employing the annular milling technique involved milling a set of concentric annular rings with diminishing diameters. As the rings approached the precise pillar geometry, smaller currents were utilized to reduce the tapering of pillar walls, minimize Ga-ion implantation within the pillar surface, and finely adjust the specimen into the intended cylindrical micropillar shape. Figure 22 illustrates the step-by-step process of the sequential annular milling method. Using the annular milling method, a series of concentric annular rings with decreasing diameters were milled using a focused Ga-ion beam. The initial steps were performed with relatively high beam currents to rapidly remove material from the surrounding area. As the milling approached the actual pillar geometry, smaller currents were selected to minimize tapering of the pillar walls, reduce Ga-ion implantation within the pillar surface, and finely tune the specimen into the desired cylindrical micropillar shape. A significant downside of this method is the extensive time required for specimen preparation. As a result, only a limited number of specimens can be readied and analyzed.

a At the beginning, b in the process, and c at the end of annular milling of micropillar. Crushing failure was observed for d 2 μm and e 0.5 μm diameter micropillar206.
An alternative method follows a two-step process to prepare the specimens. Initially, 2-mm-thick slices of cement paste were cut from the cylinder and affixed to a glass substrate. Subsequent steps involved repetitive grinding and polishing until the slices reached a thickness equivalent to the height of the intended cubic specimens, ensuring a flat surface. Ultimately, a micro-dicing saw was employed to create an array of micro cubes on the glass substrate by cutting through the slice from two perpendicular directions. The spacing between parallel cuts was determined as the combined value of the blade thickness (260 μm) and the length of the desired cubic specimens. Figure 23 displays SEM images of the 200 and 100 μm cube arrays. This novel sampling method provides a way to obtain a large number of samples for statistical analysis. These samples can be used to do a one-sided splitting tensile test on a microscale.

a SEM image of a sample size of 200 μm. b The one-sided splitting test. c Test configurations for the one-sided splitting test: a cracked 100 μm cement paste cube observed by SEM207.
FIB technique can also be utilized to create cantilever micro-beam specimens from samples of cement paste. This method enables precise shaping of the material at the microscale, overcoming limitations imposed by certain surfaces’ inaccessibility to the ion beam and potential re-deposition of sputtered material in confined spaces. Due to these constraints, rectangular cross-sections for the beams are not technically viable. Therefore, a triangular cross section was deemed the most suitable geometry for FIB micro-machining. The characteristic cross-sectional depth of the beams was set at ~3 to 4 mm, while the cantilever length measured about 20 mm. These dimensions facilitate accurate fabrication without defects or FIB artifacts yet remain sufficiently small to be produced within a single material phase. The length-to-transverse dimensions ratio is ~5, aiming to minimize shear effects and enable the cantilever to deform primarily under pure bending. Figure 24 illustrates the configuration of the beam geometry and the direction of loading.

a Scheme of a cantilever micro-beam. An arrow shows the loading direction. b Location before FIB milling labeled by the yellow rectangle. The red arrow indicates the fixed end position. c Front view of the cantilever after FIB milling. SEM micrograph of the fracture surface on d CH and e outer product micro-beams208.
Utilizing FIB, micropillars can be created to examine the stress-strain behavior of C-S-H in uniaxial micro-compression. Failure predominantly transpired through one of three primary deformation mechanisms: axial splitting, plastic crushing, and shearing206. Occasionally, instances involved multiple deformation modes or were influenced by local geometric irregularities, impacting the failure. The compressive strength of C-S-H varied between 181 to 1145 MPa. Micro-compression experiments on C-S-H micropillars of different diameters unveiled a prominent size effect. A notable increase in strength was evident as the pillar diameter reduced within the range of 2.5 to 0.5 μm. Notably, average compressive strengths observed were 465, 660, 704, and 838 MPa for diameters of ~2, 1.5, 1, and 0.5 μm, respectively.
This size effect can be elucidated by the existence of pre-existing weak links such as large pores, micro-cracks, and distinct phase boundaries within the C-S-H microstructure. The interplay of strength and failure mode results in underscores that for larger micropillars, micro-cracks, pores, interphases, or other discontinuities act as pre-existing cracks. The observed splitting failure is likely associated with the interaction, merging, and growth of these cracks.
The micro cubes produced using a micro-dicing saw were employed to investigate the size effect on the splitting tensile strength of cement paste207. The findings revealed a substantial increase in strength at the microscale compared to measurements taken at the laboratory scale (centimeter-sized). The smallest specimen, measuring 100 μm, displayed a notably elevated nominal splitting strength of 18.81 MPa—roughly an order of magnitude greater than the measured strength of the 40 mm specimen, which was 1.8 MPa.
The micro-beam was utilized to assess the tensile strength of various phases through bending tests, ranging from 264 MPa (for the outer product) to 700 MPa (for the inner product and Portlandite). At the micrometer scale, the tensile deformation of hydrated cement phases is primarily elastic, extending nearly to their brittle failure208.
Current experiments aimed at measuring the bulk properties primarily concentrate on simple systems like OPC. Future research endeavors could involve the creation of micropillars on more complicated cementitious composites like geopolymer, the addition of supplementary cementitious materials, carbonation, etc. This approach would facilitate the measurement and comprehension of the diverse compressive strength and failure tendencies among various hydrated phases. Expanding this method to more complex conditions can offer insights into how these variations impact the microscale strength of C-S-H and other hydrated phases.
Strength and limitations
The mechanical properties of concrete are significantly influenced by the sustainable materials incorporated, which alter both the microstructure and chemical composition. Investigating the microscale attributes, including strength, deformation, and failure mechanisms, provides researchers with a comprehensive insight into how these materials respond to stress. This knowledge helps with optimized mix designs and fabrication techniques, thus enhancing the overall durability and longevity of structures. By adjusting the microstructure or composition based on these findings, tailored materials suitable for specific applications or environments can be developed.
The abovementioned microscale mechanical probes, including nanoindentation, AFM, nano scratch testing, and micro-pillar testing, offer valuable insights into the mechanical properties of materials at small scales. However, these techniques come with certain limitations. Nanoindentation, AFM, and nano scratch tests provide statistically significant amounts of data. However, the measured hardness and elastic modulus can be influenced by surface roughness, defects, and microstructural heterogeneity due to the small test area. The sample surface must be very smooth and clean to ensure good contact between the probe and sample, posing high demands on sample preparation. Measurements primarily reflect surface mechanical properties and may not represent the bulk properties of the sample. Meanwhile, homogenization schemes are needed to interpret bulk mechanical properties from micro measurement, which is model-dependent.
Micro-pillar testing presents its own challenges. Fabricating micropillars with precise dimensions and geometry can be difficult and time-consuming. High-resolution instruments are required to accurately apply and measure forces on micropillars, which can be costly and require specialized maintenance. While micro-pillar testing can provide bulk mechanical properties, including compressive strength and tensile strength, the difficulty of preparing samples and measuring results leads to inefficiency, preventing the collection of large amounts of data for statistical analysis. This is a trade-off between the microresolution and statistical significance of experimental data. Exploring new characterization techniques that can satisfy both aspects simultaneously is worthwhile in future research work.
Concluding remarks
This paper is a comprehensive review of the micro-resolved characterization tools reported in the study of sustainable cement-based materials in the past decade. The exploration of lab-based nano-microprobes, such as SEM, TEM, X-CT, micro-Raman imaging, and µXRF, has significantly advanced our understanding of the microscale processes. Meanwhile, synchrotron radiation-based microprobes, such as micro-XAS, micro-XRD, micro-X-CT, and phytography have been extensively used to unveil the micro/nano heterogeneity of SCM materials, the sub-micron 3D structure evolution of concrete in interaction with the environment, and the long-term fate of chemicals such as heavy metals. The synchrotron methods often provide a much higher resolution, faster data acquisition, and the capability of in situ observation. Though not as accessible as lab-based methods, synchrotron methods are gaining interest from an increasing number of researchers. Micro-resolved mechanical characterization methods like nanoindentation and nanoscratch serve as powerful tools for elucidating the diverse mechanical behaviors exhibited by sustainable cement-based materials, encompassing fracture, creep, shrinkage, modulus, and hardness. These findings elucidate the impact of various sustainable supplementary materials on the ultimate behavior of cement and concrete, pinpointing reasons for strengthening or weakening, and offering insights for performance enhancement. Furthermore, advanced techniques such as AFM at a smaller scale enable the exploration of initial reaction processes, making them suitable for investigating carbonation and durability issues. AFM provides a means to directly observe and manipulate chemical processes, facilitating interventions like acceleration or delay.
Sample preparation is also critical to the fidelity of results. Many methods require proper pre-conditioning of samples so that the features of interest are not artificially altered. This sets a high demand on the experience of the researchers. Analyzing the data also relies on experience, meanwhile the integration of AI-algorithms significantly improves the efficiency of data analysis, for example the quantitative assessment of SEM images.


Responses