A single-cell network approach to decode metabolic regulation in gynecologic and breast cancers

Introduction
Gynecologic malignancies, primarily encompassing endometrial, ovarian, and cervical cancers, significantly impact women’s health on a global scale1. These cancers originate from the Müllerian ducts, sharing similar embryonic origins. Additionally, breast cancer is the most commonly diagnosed cancer among women and the leading cause of cancer deaths in women worldwide2. Breast cancer is categorized into four subtypes based on the expression of hormone receptors: estrogen receptor positive (ER + ), progesterone receptor positive (PR + ), human epidermal growth factor receptor positive (HER2 + ), and triple-negative breast cancer (TNBC). ER+ breast cancer expresses the estrogen receptor, while TNBC lacks expression of ER, PR, and HER2, making it unresponsive to hormonal therapies. Recent TCGA pan-cancer studies have revealed molecular similarities across gynecologic and breast cancers, highlighting both common pathways and unique molecular features3,4. These cancers pose significant health challenges due to their prevalence and the complexity of their diagnosis and treatment. Despite advancements in medical research, gynecologic cancers are often diagnosed at advanced stages, resulting in poor prognoses and high mortality rates1. In particular, ovarian cancer is frequently diagnosed at a late stage, contributing to its high mortality rate and poor survival outcomes5.
Single-cell RNA sequencing (scRNA-seq) has revolutionized cancer research by allowing the examination of gene expression at the individual cell level. This technology provides insights into the heterogeneity of cancer cells within a tumor, revealing distinct cellular subpopulations and their functional states. Differential expression analysis of scRNA-seq data can reveal genes unique to specific cell types and states. However, deciphering cellular functions based solely on lists of upregulated or downregulated genes is challenging6. The functional roles of genes and the impact of disease-associated variants are significantly influenced by their interaction partners within the cellular context. Network modeling of gene interactions helps elucidate the functional organization of key regulators and the pathways they govern in each cell state6. This approach has shifted our perception of cellular mechanisms from linear pathways to a complex web of molecular interactions6. A recent study analyzed cell type-specific gene expression changes to identify potential drug targets and genetic biomarkers associated with Alzheimer’s disease using single network biology7. By constructing and analyzing networks of genes, we can elucidate the regulatory circuits that drive cancer progression.
Cancer metabolism has gained significant attention in the last decade due to its crucial role in supporting tumor growth and survival. Cancer cells often reprogram their metabolic pathways to meet the demands of rapid proliferation and adaptation to the tumor microenvironment. A hallmark of this metabolic reprogramming is the Warburg effect, where cancer cells preferentially utilize aerobic glycolysis over oxidative phosphorylation, even in the presence of adequate oxygen. This metabolic shift not only provides energy but also supplies the building blocks necessary for macromolecule biosynthesis. The transcriptional regulation of metabolism in cancer involves complex networks of transcription factors that control the expression of genes related to various metabolic pathways. Investigating the intricate regulation of metabolic pathways in cancer cells can uncover novel targets for cancer therapy and deepen our understanding of tumor biology.
Earlier studies on metabolism focused on analyzing the tissue-level changes. The field of single-cell transcriptomics provides the opportunity to study metabolism at the single-cell level and it is an emerging area of research. Few studies have utilized scRNA-seq to investigate metabolic changes during developmental processes8. Different computational modeling approaches such as pathway-level analysis, constraint-based modeling, and kinetic modeling can be adopted to study single-cell metabolism9. Pathway-level analysis focuses on identifying metabolic pathways and their activity levels within individual cells by integrating transcriptomic data with prior knowledge of metabolic networks. In constraint-based modeling, cellular metabolism is represented as a network of reactions with constraints based on known biochemical principles to predict metabolic fluxes and identify active pathways. Kinetic models describe the dynamics of individual reactions and enzyme kinetics. A recent study adopted a pathway-based approach to establish a computational framework for characterizing metabolism using scRNA-seq data, shedding light on the unique metabolic demands of different cell types within the tumor microenvironment10.
In this work, we employed a scRNA-seq network biology approach to investigate the metabolic landscape and its regulation in gynecologic and breast cancers. Figure 1 illustrates the workflow of our study. We examined the crosstalk between different cellular networks to uncover the coregulatory networks involved in metabolic reprogramming. We have created a comprehensive resource on single-cell cancer metabolism. This resource offers valuable insights into regulatory mechanisms at play and contributes to the advancement of personalized medicine for treating gynecologic and breast cancers.

This pipeline utilizes scRNA-seq data combined with network analysis to uncover key regulatory interactions, enabling a comprehensive understanding of cancer-specific metabolic landscapes (see methods for details).
Results
Heterogeneity of metabolic pathway in cancer cells
The metabolic pathways from the Human-GEM model were scored based on scRNA-seq data to characterize malignant heterogeneity in gynecologic and breast cancers. This study analyzed scRNA-seq datasets from endometrial (3 patients, 6296 malignant cells), ovarian (2 patients, 6051 cells), cervical (2 patients, 13,443 cells), TNBC (5 patients, 9596 cells), and ER+ breast cancers (4 patients, 10,343 cells). We identified significantly overdispersed pathways that formed the basis for clustering malignant cells into distinct clusters (Fig. 2A). We obtained 5 clusters of endometrial cancer, ovarian cancer, cervical cancer, ER+ breast cancer, and 6 clusters of TNBC (Figs. 2 and 3). The chi-square test reveals a significant correlation between these clusters and patient information.
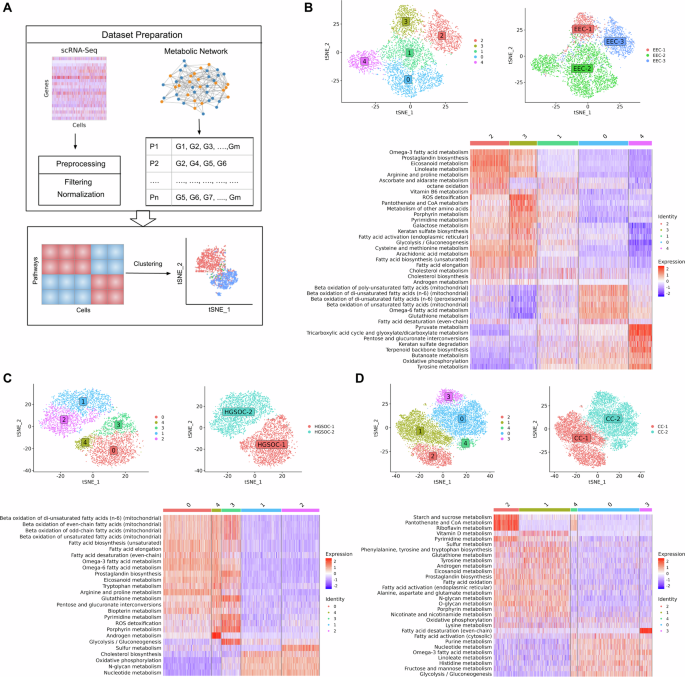
A Overview of the single-cell approach used to characterize metabolic heterogeneity, integrating the Human-GEM model with scRNA-seq data. The metabolic landscape of (B) endometrial cancer, (C) ovarian cancer and (D) cervical cancer, showing clustering of malignant cells, distribution of clusters across patients, and heatmap of metabolic pathway activity score.
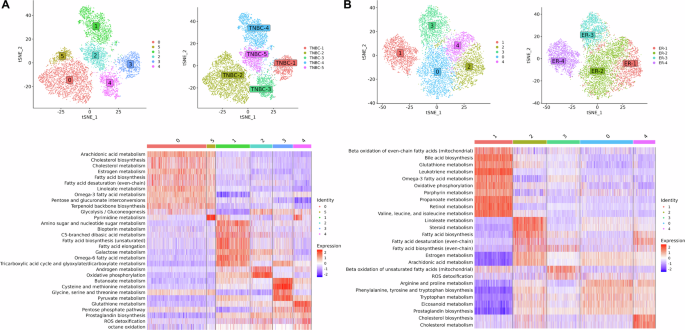
The metabolic landscape of (A) TNBC and (B) ER+ breast cancer, showing clustering of malignant cells, distribution of clusters across patients, and heatmap of metabolic pathway activity score.
In endometrial cancer, we observed a single cluster for patient EEC-1 (cluster 3) and EEC-3 (cluster 2), while EEC-2 displays three heterogeneous populations (cluster 0, 1, and 4) (Fig. 2B). EEC-1 and EEC-3 share similar metabolic profiles with upregulation of glycolysis, fatty acid biosynthesis, androgen and cholesterol metabolism. However, differences in expression levels of some pathways were observed. EEC-1 exhibits elevated expression in pathways such as galactose metabolism, pantothenate and CoA metabolism, pyrimidine metabolism, and ROS detoxification. In contrast, EEC-3 shows high expression in pathways such as omega-3 fatty acid metabolism, prostaglandin biosynthesis, linoleate metabolism, and eicosanoid metabolism. In the case of EEC-2, we observed distinct metabolic profiles within its respective clusters. Cluster 0 displays high activity in fatty acid beta-oxidation pathways. Cluster 4 exhibits upregulation in energy metabolism pathways such as pyruvate metabolism, TCA cycle, and oxidative phosphorylation. Cluster 1 represents an intermediate state with mixed expression patterns across metabolic pathways.
In ovarian cancer, three heterogeneous clusters (cluster 0, 3, and 4) emerged within HGSOC-1 and two clusters (cluster 1 and 2) in HGSOC-2 (Fig. 2C). Surprisingly, we observed a high expression of fatty acid metabolism, with simultaneous upregulation of both fatty acid synthesis and oxidation in HGSOC-1, suggesting a possible complex interplay. Omega-3 and omega-6 metabolism is also highly expressed in HGSOC-1. In HGSOC-2, we observed oxidative phosphorylation, nucleotide metabolism, N-glycan metabolism, and cholesterol biosynthesis to be upregulated. Our findings align with recent studies indicating metabolic heterogeneity in ovarian cancer, particularly favoring oxidative phosphorylation in invasive migratory and cancer stem cells11,12. Cholesterol biosynthesis has been associated with enhancing the stemness properties of cancer cells, a crucial factor in initiating the metastatic cascade13. Both ovarian cancer patients are characterized by intra-malignant heterogeneity. In HGSOC-1, cluster 0 shows high expression of arginine and proline metabolism. Cluster 3 has increased activity for pathways such as glycolysis, pyrimidine metabolism, glutathione metabolism, and ROS detoxification. Cluster 4 demonstrates upregulation in androgen metabolism.
In cervical cancer, we observed two heterogeneous groups (cluster 1 and 2) in CC-1 and three groups (cluster 0, 3, and 4) in CC-2 (Fig. 2D). CC-1 is characterized by the upregulation of oxidative phosphorylation, androgen metabolism, amino acid metabolism, glycan metabolism, and eicosanoid metabolism. On the other hand, CC-2 displays high expression for pathways such as glycolysis, fructose and mannose metabolism, and nucleotide metabolism. In CC-1, cluster 1 shows upregulation in vitamin D metabolism, while cluster 2 has high activity for starch and sucrose metabolism, pantothenate and CoA metabolism, and riboflavin metabolism.
In TNBC, we identified one cluster per patient, with the exception of TNBC-2, which exhibits two clusters (cluster 0 and 5) (Fig. 3A). Cluster 1, 2, 3, and 4 corresponds to patient TNBC-4, TNBC-5, TNBC-1, and TNBC-3, respectively. TNBC-1 is characterized by the upregulation of one-carbon metabolism, including cysteine and methionine metabolism and glycine, serine, and threonine metabolism, crucial for nucleotide synthesis, methylation reactions, and antioxidant defense. In TNBC-2, both cluster 0 and cluster 5 share similar metabolic profiles. TNBC-2 shows upregulation in lipid metabolism, including cholesterol metabolism, estrogen metabolism, linoleate metabolism, arachidonic acid metabolism, omega-3 fatty acid metabolism, fatty acid biosynthesis, and glycolysis. TNBC-3 demonstrates elevated expression in pathways associated with redox homeostasis such as glutathione metabolism, pentose phosphate pathway, and ROS detoxification. The pentose phosphate pathway provides NADPH, necessary for converting oxidized glutathione (GSSG) back into its reduced form (GSH), which is vital for scavenging reactive oxygen species (ROS). TNBC-4 exhibits high activity in metabolic pathways, such as amino sugar and nucleotide sugar metabolism, galactose metabolism, and the TCA cycle. TNBC-5 displays upregulation of oxidative phosphorylation and androgen metabolism.
In ER+ breast cancer, we obtained three clusters corresponding to each patient except ER-2, which has two heterogeneous groups of malignant cells, cluster 0 and 4 (Fig. 3B). Cluster 1, 2, and 3 corresponds to patient ER-4, ER-1, and ER-3, respectively. We observed the upregulation of lipid metabolism, including steroid metabolism, estrogen metabolism, and fatty acid biosynthesis in ER-1. The two clusters of ER-2 share a similar metabolic profile but exhibit differences in expression levels of pathways such as arginine and proline metabolism, phenylalanine, tyrosine and tryptophan biosynthesis, which are upregulated in cluster 0, while cholesterol metabolism and fatty acid biosynthesis are upregulated in cluster 4. In ER-3, we observed that the estrogen metabolism is not expressed. ER-4 is characterized by the upregulation of oxidative phosphorylation, propanoate metabolism, glutathione metabolism, and valine, leucine, and isoleucine metabolism. However, estrogen metabolism is downregulated. Notably, ER-4 exhibits high metabolic activity compared to the other ER+ patients.
Overall, we found that malignant cell clusters of gynecologic and breast cancers show gene expression differences in cholesterol metabolism, eicosanoid metabolism, fatty acid metabolism, oxidative phosphorylation, glycolysis, amino acid metabolism, and redox pathways. The clusters also show differences in androgen and estrogen metabolism.
Cancer Cell-Specific Protein-Protein Interaction Network
To uncover the connectivity pattern among genes in malignant cells, we aimed to infer malignant cell-specific PPI networks by integrating gene expression with PCNet. Network corresponding to gynecologic and breast cancers comprises approximately 14–25% of PCNet nodes and 4–22% of PCNet edges (Fig. 4A and Table S1). We observed that more than 50% of nodes and 30% of edges are shared between at least two cancers (Fig. 4B, C). However, the cervical cancer network has more unique nodes and edges compared to the rest of the cancers. To better understand the network-level relationship among these cancers, we performed network proximity analysis. This analysis reveals that all gynecologic and breast cancers are significantly proximal to each other, with distance ranging from 0.4 to 0.8, except ovarian and cervical cancers (Z-score < −2 and p-value < 0.001) (Fig. 4D). This suggests a shared relationship between gynecologic and breast cancers at the network level. Additionally, TNBC and ER+ breast cancer show the least proximity since both are subtypes of breast cancer.
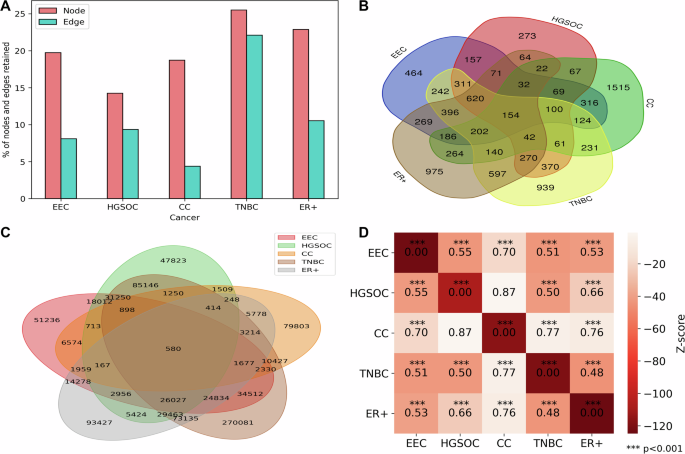
A Bar plot displaying the percentage of nodes and edges preserved in PPI networks of gynecologic and breast cancers. B Venn diagram illustrating the overlap of nodes in the PPI networks. C Venn diagram showing the overlap of edges in the PPI networks. D Network proximity analysis of gynecologic and breast cancers, with the heatmap indicating the distances between networks.
To gain further insight into this shared connectivity, we extracted a network common across gynecologic and breast cancers. We included proximal genes whose average shortest distance is less than or equal to 2 (in addition to common genes) to explore the biological rationale through enrichment analysis14. We identified 1150 proximal genes, in which we observe 154 genes to be common across endometrial, ovarian, cervical, TNBC and ER+ breast cancers (Table S2). On the other hand, the number of common genes increased to 774 if cervical cancer was not considered given that it was less proximal to other cancers. These proximal genes are enriched in MSigDB hallmarks such as androgen response, estrogen response early, estrogen response late, and oxidative phosphorylation. We observed that ErbB growth factor signalling pathway as a relevant pathway associated with proximal genes. Breast, ovarian, and endometrial cancers are hormone-sensitive cancers. ERBB2 is overexpressed in breast and gynecologic cancers15. Abnormal expression of steroid hormones, particularly androgens and estrogens, has consistently been reported in gynecological cancers16. The number of shared genes in these pathways was limited in cervical cancer. Oxidative phosphorylation also emerged as a common theme altered in gynecologic and breast cancers. Its activity is reduced in EC cells compared to normal human endometrial cells17. Ovarian cells rely on oxidative phosphorylation for survival and is proposed as therapeutic target18. Oxidative phosphorylation is a metabolic vulnerability in some cancers, including TNBC and metastatic ER+ breast cancers19,20.
The PPI network is further used to identify metabolic modules, uncovering connectivity patterns among metabolic genes. Clustering was applied on each malignant specific PPI based on network topology. Subsequently, the pathway enrichment analysis of modules was performed to identify metabolic modules. We found two modules to be significantly enriched in metabolic pathways in endometrial cancer, ovarian cancer, and TNBC (Fig. 5). For endometrial cancer, module M6 (EEC_M6) is enriched in cholesterol metabolism, omega-3 fatty acid metabolism, omega-6 fatty acid metabolism, arachidonic acid metabolism, and estrogen metabolism, while module M8 (EEC_M8) is enriched in oxidative phosphorylation. Similarly, for ovarian cancer, module M3 (HGSOC_M3) shows enrichment of pathways comparable to those observed in EEC_M6. On the other hand, module M5 (HGSOC_M5) is enriched in oxidative phosphorylation. For TNBC, module M2 (TNBC_M2) is significantly enriched in beta-oxidation of fatty acids, TCA cycle, and oxidative phosphorylation. In contrast, the other metabolic module M10 (TNBC_M10) is enriched in cholesterol and estrogen metabolism.
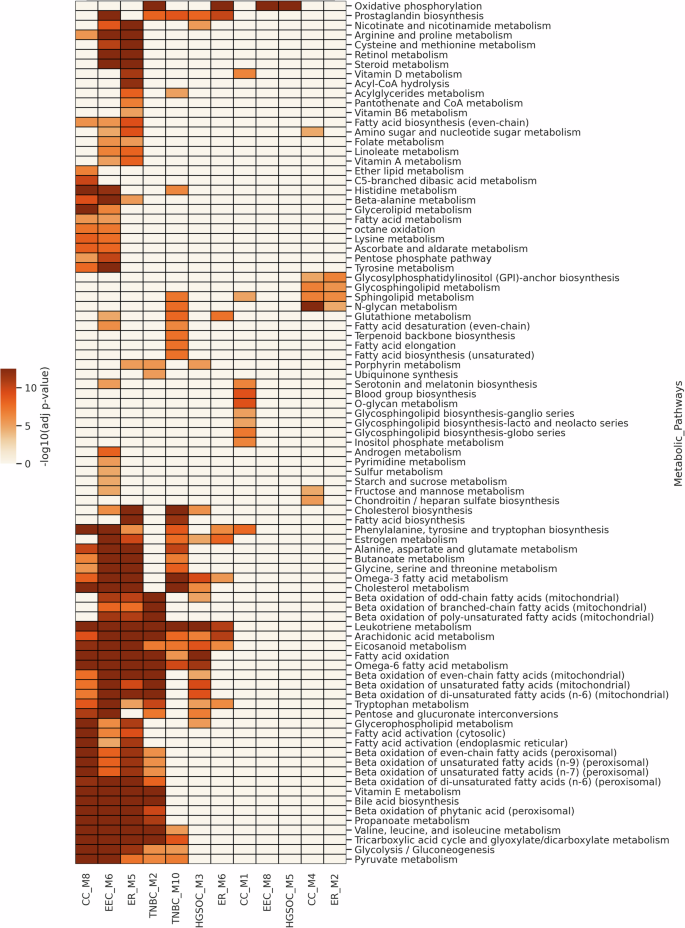
The heatmap shows the negative log10 of adjusted p-values for these modules, highlighting the shared and distinct enrichment profiles between cancers.
In addition, we identified three metabolic modules for cervical and ER+ breast cancers (Fig. 5). The M6 module in ER+ (ER_M6) is enriched in oxidative phosphorylation, similar to HGSOC_M5, TNBC_M2, and EEC_M8 modules. The module ER_M5 also has similar overall enrichment profiles to the EEC_M6, TNBC_M10, and CC_M8 modules with respect to lipid metabolism and TCA cycle. Glycine, serine and threonine metabolism, alanine, aspartate and glutamate metabolism, branched-chain amino acid metabolism and phenylalanine, tyrosine and tryptophan metabolism are also significantly enriched in EEC_M6, ER_M5, TNBC_M10 and CC_M8 modules. Other amino acid metabolism captured by this analysis include arginine and proline metabolism and cysteine and methionine metabolism in EEC_M6 and ER_M5.
This approach considers interactions among metabolic genes derived from a cancer-specific PPI network to uncover functional modules across patients. These modules are enriched in lipid metabolism, amino acid metabolism, the TCA cycle and oxidative phosphorylation, aligning with our findings from the pathway-guided approach. We also found that pathways related to specific amino acids (glycine, serine, and methionine metabolism; alanine, aspartate, and glutamate metabolism) are significantly enriched across multiple cancers compared to the pathway-based approach.
Gene regulatory network of gynecologic and breast cancers
To investigate the transcriptional regulation mechanisms in malignant cells, we constructed gene regulatory networks and identified active regulons in gynecologic and breast cancers. The number of active regulons varied across different cancer types, ranging from 140 to 200 (Fig. 6A and Table S3). Notably, we identified 31 common regulons across subtypes implicated in TNF-alpha signaling via NF-κB, hypoxia, G2-M checkpoint, and interferon-gamma response (Fig. 6B and Table S4).
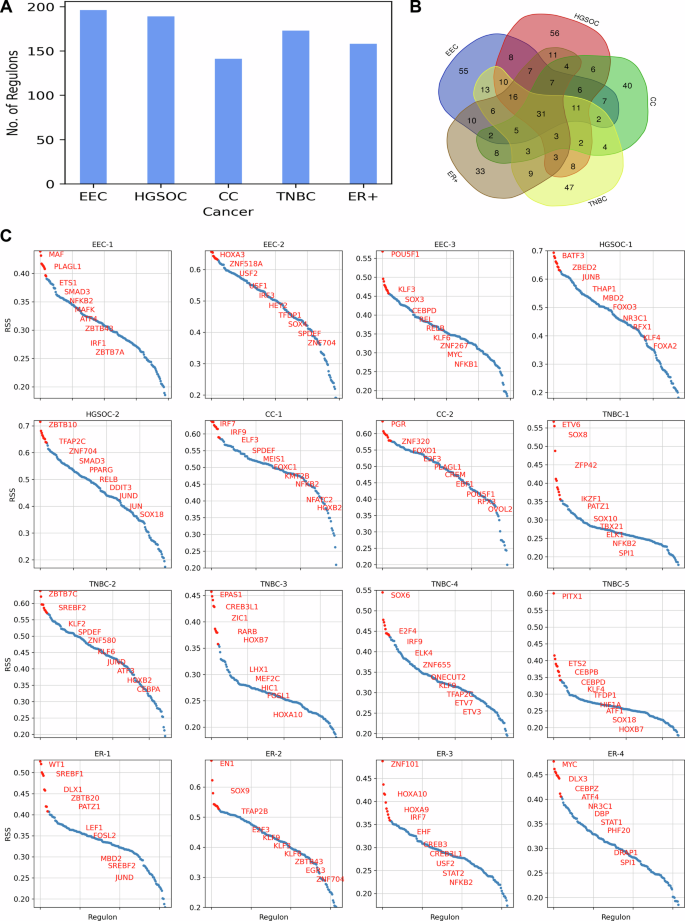
A Bar plot depicting the number of regulons identified in GRN of gynecologic and breast cancers. B Venn diagram illustrating the overlap of regulons among gynecologic and breast cancers. C RSS plot highlighting the top 10 patient-specific regulons in gynecologic and breast cancers.
To explore further, we characterized transcriptional regulation at the individual patient level and identified patient-specific regulons based on the regulon specificity score (RSS) (Fig. 6C). In EEC-1, we found that the top regulons are involved in regulating the immune response and inflammation. Regulons IRF1 and NFKB2 are critical for the activation of immune response genes, while ETS1 and SMAD3 contribute to the regulation of immune cell differentiation and function. Additionally, ATF4, a key regulator in the stress response pathway, is commonly expressed in EC cell lines, contributing to the tumor growth of endometrial cancer21. In EEC-2, the top regulons are involved in cellular differentiation, metabolism, and the cell cycle. The regulons HOXA3 and SOX4 play crucial roles in regulating gene expression during development, cell proliferation and differentiation. Additionally, the candidates USF1 and USF2 regulate the genes involved in lipid metabolism and glucose homeostasis22. EEC-3 is regulated by REL, RELB, and NFKB1, which are key players of the NF-κB signaling pathway, playing a vital role in immune responses, inflammation, and cell survival. KLF3 and KLF6, also associated with the immune system, are implicated in carcinogenesis23. Moreover, another candidate, POU5F1, is crucial for maintaining pluripotency in cancer stem-like cells and plays a pivotal role in tumor initiation and metastasis24.
In HGSOC-1, our analysis identified regulons that have been previously reported (Fig. 6C). A recent pan-cancer analysis study highlighted the aberrant upregulation of ZBED2 in ovarian cancer and the enrichment of ZBED2-overexpressing cell lines in ovarian cancer-derived cell lines25. MBD2 expression is also significantly higher in high-grade serous ovarian cancer (HGSOC) tissue samples compared to normal tissue samples26. Another key regulon, FOXO3, is reported to be overexpressed in ovarian cancer cell lines27. The regulon NR3C1 encodes the Glucocorticoid receptor (GR), a hormone receptor involved in metabolic homeostasis and stress response. It accelerates glucose metabolism by driving stress response28. Similarly, in HGSOC-2, TFAP2C is reported to be upregulated in advanced ovarian carcinoma and is implicated in preventing ferroptosis, a regulated cell death process involving dysregulated iron metabolism, lipid peroxidation, and ROS accumulation29. Another important regulon, SMAD3, serves as a prognostic biomarker for ovarian cancer patients and plays a pivotal role in regulating the transforming growth factor-beta (TGF-β) pathway, which impacts metastatic processes in ovarian cancer30,31.
The regulons specific to CC-1 include IRF7, IRF9, NFKB2, and NFATC2, which are involved in the regulating genes associated with the immune response (Fig. 6C). Another candidate, KMT2B, plays a role in regulating developmental genes and is found to be upregulated in cervical cancer cells and facilitates metastasis and angiogenesis in cervical cancer32. In CC-2, we identified PGR, which encodes the progesterone receptor and is overexpressed in cervical adenocarcinomas33. The regulon FOXO1, a key regulator of insulin signaling, controls metabolic homeostasis during oxidative stress. Other candidates include E2F3, which regulates the cell cycle; EBF1, which is crucial for B cell development and differentiation; and OVOL2, which controls the epithelial-to-mesenchymal transition (EMT), a process critical for development and cancer metastasis.
In TNBC-1, the regulons include ETV6, IKZF1, and SPI1, which are involved in the regulation of hematopoiesis and blood cell development (Fig. 6C). Other candidates include SOX8 and SOX10, which regulate embryonic development and determining cell fate, and ZFP42, which regulates pluripotency and differentiation in embryonic stem cells. In TNBC-2, we observed high expression of the regulon SREBF2, which is involved in the regulation of lipid homeostasis, particularly cholesterol biosynthesis and metabolism. This observation aligns with our pathway-level analysis, which showed high activity in cholesterol metabolism for this patient. In TNBC-3, we observed high expression of the EPAS1 regulon, also known as hypoxia-inducible factor-2α (HIF-2α), which controls the transcription of genes involved in the cellular response to hypoxia and angiogenesis. Additionally, regulons CREB3L1 and HIC1 are involved in the cellular response to endoplasmic reticulum (ER) stress and DNA damage, respectively. In TNBC-4, high expression of TFAP2C was observed, consistent with the recent single-cell study of TNBC34. TFAP2C regulates networks involving the Estrogen Receptor Alpha (Erα) and ERBB2 (HER2)29. Other candidate regulons include E2F4, IRF9, ETV3, and ETV7. In TNBC-5, our analysis identified PITX1 as a highly expressed regulon. Overexpression of PITX1 has been reported in breast cancer cells, functioning as a critical regulator of Erα-mediated transcriptional activity in breast cancer cells35.
In ER-1, the top regulon WT1 has been implicated in regulating EMT in breast cancer cells, with higher expression observed in the ER+ subtype36 (Fig. 6C). High activity of candidate regulons SREBF1 and SREBF2 is linked to the upregulation of cholesterol metabolism in ER-1, similar to TNBC-2. Another key regulon, PATZ1, is involved in cellular proliferation and apoptosis and is overexpressed in breast tumors37. In ER-2, regulon TFAP2B is highly expressed and plays a crucial role in regulating tumor cell proliferation in breast cancer38. In ER-3, the top regulons are linked to development (HOXA9, HOXA10), immune response (IRF7, STAT2, NFKB2), and stress response (CREB3, CREB3L1). In ER-4, regulon MYC is highly expressed and regulates cellular signaling and metabolic pathways. Its overexpression contributes to the development of resistance in ER+ breast cancer39.
Crosstalk between GRN and PPI Network in the Control of Cancer Cell Metabolism
To elucidate the underlying regulation of metabolic changes in gynecologic and breast cancers, we performed transcriptional factor enrichment analysis of metabolic modules identified from the cell-specific network. Our analysis revealed several transcription factors significantly enriched in these modules, highlighting their roles in metabolic reprogramming. In module M6 (EEC_M6) of endometrial cancer, transcription factors XBP1, TFDP1, E2F1, and FOXM1 primarily regulate enzymes involved in the TCA cycle and one-carbon amino acid metabolism (Fig. 7A). XBP1 and TFDP1 also target enzymes involved in branched-chain amino acid metabolism. In module M8 (EEC_M8), XBP1, TFDP1, RFX3, and USF2 regulate overlapping and unique enzymes involved in oxidative phosphorylation (Figure S1A). TFDP1 forms a complex with E2F1, controlling its transcriptional activity. E2F1, FOXM1 and XBP1 are upregulated in endometrial cancer40,41. Both E2F1 and FOXM1 play crucial role in cancer energy metabolism and metabolic adaptation41,42.
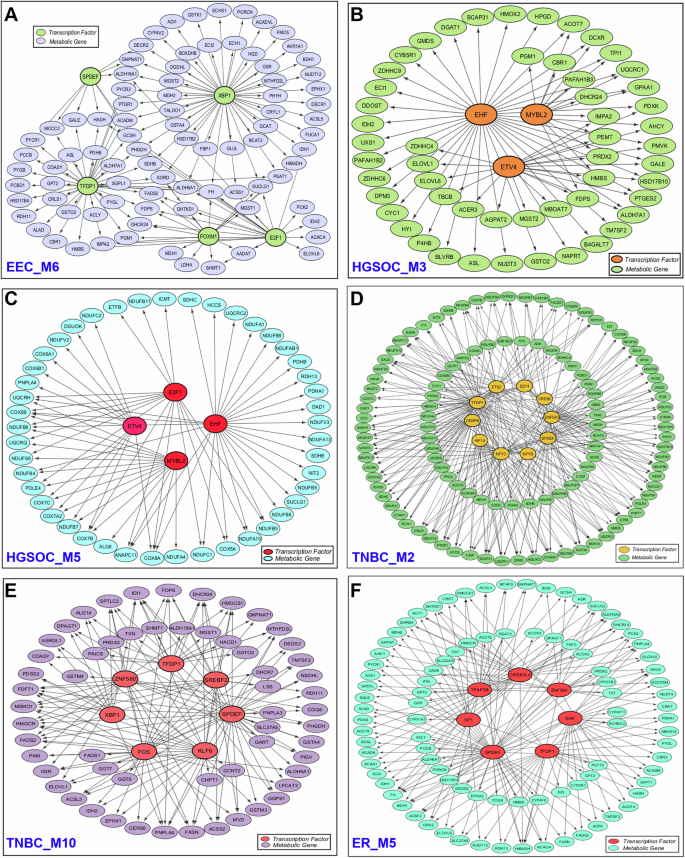
A Endometrial cancer module M6 (EEC_M6), B ovarian cancer module M3 (HGSOC_M3), C ovarian cancer module M5 (HGSOC_M5), D TNBC module M2 (TNBC_M2), E TNBC module M10 (TNBC_M10), and F ER+ breast cancer module M5 (ER_M5). For clarity, only the interactions between transcription factors and metabolic genes are displayed, while interactions between metabolic genes or between transcription factors are not shown.
In ovarian cancer, module 3 (HGSOC_M3) highlights the role of ETV4 in lipid metabolism and EHF in amino sugar and nucleotide sugar metabolism (Fig. 7B). In module 5 (HGSOC_M5), EHF, E2F1, MYBL2, and ETV4 target enzymes involved in oxidative phosphorylation, with EHF also regulating enzymes in the TCA cycle (Fig. 7C). EHF, a member of the E26 transformation-specific (ETS) transcription factor family, is overexpressed and linked to shorter survival times in ovarian cancer43. Increased expression of ETV4 contributes to chemoresistance in ovarian cancer44. A recent study also reported that MYBL2 promotes tumorigenesis in ovarian cancer45. Additionally, E2F1 transcriptionally regulates MYLB2, promoting the progression of ovarian cancer46.
In cervical cancer, module M4 (CC_M4) is associated with transcription factors such as CREB3L2 and HOXB2, which regulate enzymes involved in amino sugar and nucleotide sugar metabolism, as well as N-glycan biosynthesis (Figure S1B). CREB3L2 also targets enzymes involved in protein processing in the ER and plays a role in unfolded protein response (UPR)47. The candidate HOXB2 is expressed in cervical tumor tissues and contributes to cancer progression48. In TNBC, transcription factors TFDP1, CEBPB, and ETS2 target enzymes involved in oxidative phosphorylation in module M2 (TNBC_M2) (Fig. 7D). CEBPB acts as a master regulator in mammary gland development and is overexpressed in breast cancer49. Experimental studies have shown that knocking out CEBPB in TNBC cells significantly reduces cell migration, highlighting its role in regulating migration and invasion in these cells50. In module M10 (TNBC_M10), SREBF2 and SPDEF regulate steroid biosynthesis, and fatty acid biosynthesis (Fig. 7E). SPDEF inhibits cell migration and invasion by targeting EMT pathway51.
In ER+ breast cancer, all three metabolic modules are associated with different transcription factors. Module M2 (ER_M2) highlights SPDEF’s role in N-glycan biosynthesis and GPI-anchor biosynthesis (Figure S1C). In module M5 (ER_M5), transcription factors SPDEF, CREB3L4, TFDP1, and TFAP2B regulate enzymes in the TCA cycle (Fig. 7F), while in module M6 (ER_M6), DRAP1, ZNF580, CREB3L4, and CREB3 regulate enzymes in the oxidative phosphorylation (Figure S1D). SPDEF, CREB3L4 and TFAP2B are overexpressed in ER+ breast cancer and are associated with poor prognosis38,52,53. Overall, the proposed approach specifically captures the crosstalk between gene regulatory and protein-protein interaction networks that can drive metabolic reprogramming in gynecologic and breast cancers. The analysis revealed that transcriptional regulation of interacting targets is primarily linked to oxidative metabolism in these cancers.
Discussion
Metabolic reprogramming is a hallmark of cancer cells. Earlier scRNA-seq study showed significant variation in metabolic activity among different cell types within the tumor microenvironment10. In this work, we aimed to study the regulation of metabolic pathways that enable cancer cells to meet their increased energy and biosynthetic demands while adapting to the evolving tumor microenvironment. Our study employed a comprehensive network-based approach to dissect the complex landscape of metabolic regulation within malignant cells at the single-cell level (Fig. 1). We first uncovered metabolic pathway profiles within malignant cells of gynecologic and breast cancers, revealing key metabolic pathways and providing valuable insights into cancer metabolism (Fig. 2A). By inferring PPI and gene regulatory networks, we identified the cancer-specific interactions and regulons. We then identified metabolic modules that highlight connectivity patterns among metabolic genes and their associated transcription factors through gene regulatory networks. This analysis provides a comprehensive view of the regulatory mechanisms driving metabolic changes in gynecologic and breast cancers. Furthermore, this pipeline can also be applied to decipher the metabolic regulation of any disease at single-cell resolution.
We observed metabolic heterogeneity both across different patients and within individual patients. In ovarian and cervical cancers, metabolic heterogeneity between patients correlated with differences in tumor stage (Fig. 2C, D). In contrast, metabolic variations were observed among EC patients even within the same tumor stage. Notably, patients EEC-1 and EEC-3 exhibited more similar metabolic profiles to each other than to patient EEC-2 (Fig. 2B). The intra-patient heterogeneity observed in EC patient (EEC-2) suggests the presence of distinct tumor subpopulations with differing metabolic demands. Although all breast cancer patients in our study belong to either TNBC or ER+ subtypes, they also exhibited variation in metabolic profiles. This variability between patients suggests that intrinsic (mutations, epigenetics) and extrinsic (tumor microenvironment) factors may contribute to these differences54. TNBC patients can be subtyped based on the differences in glycolysis, oxidative phosphorylation, cholesterol metabolism, one-carbon metabolism, and redox metabolism (Fig. 3A). This extends the previous metabolic subtyping of TNBC into the lipogenic subtype (with upregulated lipid metabolism), the glycolytic subtype (with upregulated carbohydrate and nucleotide metabolism), and the mixed subtype (with major pathway dysregulation)55. Additionally, we observed two subtypes among ER+ breast cancer patients. One subtype, represented by patient ER-4, exhibits higher metabolic activity compared to the other subtype, which includes patients ER-1, ER-2, and ER-3 (Fig. 3B). This distinction may reflect differences in metabolic demands and could inform therapeutic strategies, such as targeting hyperactive metabolic pathways in the ER-4-like subgroup.
Our study revealed that oxidative phosphorylation exhibits variation across gynecologic and breast cancers (Figs. 2, 3 and 5). This observation aligns with Xiao et al.10, who identified oxidative phosphorylation as a major contributor to metabolic heterogeneity in malignant cells10. Additionally, we observed variability in glycolysis activity within malignant cells (Figs. 2 and 3). In endometrial and ovarian cancer, we observed mutually exclusive behavior with respect to oxidative phosphorylation and glycolysis (Fig. 2B, C). On the other hand, we observed a complex interplay of oxidative phosphorylation and glycolysis in TNBC, with one patient (TNBC-5) showing upregulation of both processes (Fig. 3A). This finding indicates that cancer cells exhibit metabolic plasticity, enabling them to switch between oxidative phosphorylation and glycolysis and adopt a hybrid state based on oxygen availability and metabolic demands. The hybrid glycolysis/oxidative phosphorylation state is associated with metastasis and therapy resistance56. Our analysis highlighted the elevated activity of hypoxia-inducible factors (HIF1A and EPAS1) in TNBC (Fig. 6C) and their upregulation is known to contribute to treatment resistant in TNBC57. We also identified distinct transcription factors regulating oxidative phosphorylation across different cancers. Notably, E2F1 and TFDP1 are among the transcription factors targeting oxidative phosphorylation in endometrial cancer, ovarian cancer, and TNBC (Fig. 7 and S1).
We also observed variations in cholesterol and fatty acid metabolism and identified metabolic modules associated with these pathways at the network level (Figs. 2, 3 and 5). Cholesterol, a key component of cellular membranes, also serves as a precursor for the synthesis of steroid hormones and bile acids. Cholesterol is an endogenous ligand of ERRα and it increases glycolysis and oxidative phosphorylation in ERRα-dependent mananer58. Cholesterol metabolism involves de novo cholesterol biosynthesis, cholesterol uptake, efflux, and esterification59. We observed alterations in cholesterol biosynthesis across gynecologic and breast cancers (Fig. 5). Cholesterol biosynthesis is primarily regulated by sterol regulatory element-binding proteins (SREBFs), which are active in breast cancer subtypes, including TNBC and ER+ (Table S3). Additionally, SREBF2 regulon activity is observed in endometrial and cervical cancers (Table S3).
We identified SPDEF in our network-based analysis of TNBC and ER+ breast cancer (Fig. 7 and S1). It is also highly expressed regulon in endometrial and cervical cancers (Fig. 6C). SPDEF belongs to the ETS (E26 transformation-specific) transcription factor family, which is expressed in hormone-regulated epithelia such as the prostate, breast, and ovary. SPDEF regulates genes related to fatty acid metabolism and oxidative metabolism. Androgen and estrogen metabolism show heterogeneous expression patterns within malignant cells of gynecologic and breast cancers (Figs. 2 and 3). Estrogen metabolism is also enriched in the PPI network modules of these cancers (Fig. 5). High levels of androgens have been associated with an increased risk of cervical cancer60. However, its role in endometrial cancer remains controversial61. Further, our study revealed a complex interplay between omega-3 and omega-6 metabolism in gynecologic and breast cancers (Fig. 5). Omega-3 metabolism is important for the synthesis of anti-inflammatory eicosanoids (EPA and DHA), while omega-6 is involved in the synthesis of pro-inflammatory eicosanoids (arachidonic acid). We observed that in ovarian cancer, both omega-3 and omega-6 metabolisms are upregulated, while in endometrial cancer and TNBC patients, they are activated in a mutually exclusive manner (Figs. 2 and 3). Arachidonic acid serves as the main precursor of several eicosanoid species, including prostaglandins and leukotrienes, which can modulate tumor microenvironment62.
Amino acid metabolism is altered in gynecologic and breast cancers, with distinct patterns observed across different cancer types (Figs. 2, 3 and 5). Arginine and proline metabolism show heterogeneous expression patterns in endometrial, ovarian, and ER+ breast cancers. A recent metabolomic study of urine and serum samples from early-stage endometrial cancer patients identified differential metabolites specifically involved in arginine and proline metabolism63. Another key pathway, one-carbon metabolism, is enriched in PPI network modules of cervical, endometrial and breast cancer subtypes (Fig. 5). This pathway is essential for supporting nucleotide and amino acid biosynthesis, epigenetic modifications, and antioxidant regeneration through the methionine cycle64. Additionally, variations in aromatic and branched-chain amino acid metabolism are observed in cervical and ER+ breast cancers (Figs. 2, 3 and 5). Furthermore, we observed differences in expression patterns of glutathione metabolism across gynecologic and breast cancers (Figs. 2 and 3). Glutathione metabolism, ROS detoxification, and the pentose phosphate pathway are highly expressed in some TNBC patients compared to others. We also identified different transcription factors associated with ER stress (CREB3 subfamily) in gynecologic and breast cancers (Figs. 6, 7 and S1). ER stress enhances the adaptability of tumor cells to unfavorable conditions, driving cancer progression. It influences glycolysis and lipid metabolism, promoting tumor growth, invasion, and metastatic potential65.
The gene regulatory network analysis revealed significant activity of NF-κB-regulated regulons (NFKB1, NFKB2, REL, RELA, and RELB) in gynecologic and breast cancers (Table S4). Nuclear factor-κB (NF-κB) is a family of stimuli-responsive transcription factors that control a wide range of genes involved in immune and inflammatory responses. This family includes five structurally related members, NFKB1, NFKB2, REL, RELA, and RELB, which regulate gene transcription by binding to a specific DNA sequence known as the κB enhancer, either as homo- or hetero-dimers66. NF-κB signaling pathway has been associated with cancer progression through its role in regulating EMT and metastasis67. Additionally, regulons involved in interferon-gamma response are expressed in gynecologic and breast cancers.
Our comprehensive analysis of scRNA-seq data reveals significant metabolic heterogeneity among malignant cells in gynecologic and breast cancers. This heterogeneity highlights the complexity of metabolic reprogramming, which may play a crucial role in tumor survival, growth, and adaptation to the tumor microenvironment. Importantly, it uncovers the underlying regulatory mechanisms driving metabolic dysregulation, including the identification of key transcription factors and their targets, which together form an integrated network. These results provide a foundation for further investigation into cancer metabolism, potentially guiding the development of targeted therapies to disrupt metabolic pathways critical to cancer progression and treatment resistance.
Since our study is based on multiple publicly available datasets for different cancers, we adhered to the quality control (QC) criteria reported in the original studies (see Methods). Selecting appropriate QC thresholds is critical, and a common approach is to experiment with different thresholds while ensuring minimal loss of biological information due to changes in the number of cells included. To assess whether mitochondrial gene percentage significantly impacts our results, we tested different thresholds using the TNBC dataset as an example. When the threshold was reduced from 20% to 15% and 10%, clustering results and most pathway activity patterns remained consistent, despite a loss of approximately 1000 to 3000 cells (Figure S2). However, further reducing the threshold to 5% led to a loss of more than 50% of cells, which may not be appropriate for obtaining meaningful results. Overall, we note that the impact on the results is minimal if the decrease in cell count due to QC criteria changes is not dramatic.
A key limitation of this study is the small sample size, especially in gynecological cancers. To address this, we applied stringent inclusion criteria, ensuring that datasets included more than 1,000 malignant cells per patient for sufficient representation. However, broader validation with larger annotated datasets is necessary to confirm and expand upon these findings. Another limitation is the lack of direct experimental validation, such as knockout experiments of transcription factors, to confirm the observed crosstalk between GRN and PPI networks of metabolic genes. Currently, only transcription factor expression data and their relevance in specific cancers are available from existing literature. Our findings will serve as hypotheses for further refinement of transcriptional regulation of metabolic pathways in gynecologic and breast cancers through targeted experiments.
Methods
Datasets
We obtained scRNA-seq datasets (feature-barcode matrices) for endometrial and ovarian cancer from the Gene Expression Omnibus (GEO) database (accession number GSE173682)68. The corresponding cell type annotations were retrieved from the supplementary files provided. The Broad Institute Single Cell Portal (https://singlecell.broadinstitute.org/single_cell) was used to download the scRNA-seq data with cell type annotations for breast cancer (Accession ID: SCP1039) and cervical cancer (Accession ID: SCP1950)69,70. The endometrial cancer dataset includes five patients, all classified as the endometrioid subtype at stage 1. The ovarian cancer dataset includes two patients, one at stage 2 and the other at stage 3. The cervical cancer dataset contains 7 patients, with 4 at stage 1 and 3 at stage 2. The breast cancer cohort comprises 26 patients: 11 ER + , 5 HER2 + , and 10 TNBC. The scRNA-seq datasets were selected based on the availability of cell-type annotation information, inclusion of a substantial number of malignant cells, and availability of clinical metadata.
To study cancer metabolism, we employed the latest version of the human genome-scale metabolic model known as Human-GEM (version 1.14.0)71. This comprehensive model encompasses 13,085 reactions, 8499 metabolites, and 2897 genes, providing a detailed representation of the standard metabolic processes in human cells.
Data preprocessing
The feature-barcode matrix for each patient was transformed into a Seurat object using the Seurat R package (version 4.4.0)72. We utilized the pre-filtered cell barcodes available in the supplementary/metadata files from the original dataset paper for downstream analysis. We considered dataset-specific QC criteria based on recommendations from the original studies. This approach accounts for biological variations and ensures alignment with the tissue and cell-type contexts unique to each dataset, as QC thresholds can vary significantly across tissue types, study conditions, and technologies73. For endometrial and ovarian cancer datasets, QC and doublet cell removal were conducted for each patient68. The QC metrics included three criteria: log-transformed UMI counts ( > 2 MADs, low end), log-transformed number of expressed genes ( > 2 MADs, low end), and log-transformed percentage of mitochondrial read counts ( > 2 MADs, high end). Doublet cells were identified using both DoubletDecon and DoubletFinder. For cervical cancer datasets, the following QC criteria were applied for cell filtering: UMI counts < 8000 or mitochondrial gene percentage < 10%, and gene counts between 500 and 400070. In breast cancer datasets, cells were retained if they exhibited a gene count exceeding 200, UMI counts surpassing 250, and a mitochondrial percentage below 20%69.
To ensure unbiased analysis and adequate representation of malignant cell populations, we excluded patients with fewer than 1000 malignant cells in the endometrial, cervical, and breast cancer datasets. Consequently, for the downstream analysis, we retained 3 patients from endometrial cancer, 2 patients from cervical cancer, and 9 patients (4 ER+ and 5 TNBC) from breast cancer. Detailed patient information is provided in the supplementary file (Table S5).
Next, we performed normalization using SCTransform, a variance-stabilizing transformation method that preserves true biological variation while removing the technical variability74. A prior study highlighted the better performance of SCTransform in comparison to alternative normalization methods for scRNA-seq analysis75.
Calculation of activity score of metabolic pathways
To characterize the variation in the metabolic profile of cancer cells, we calculated the pathway activity score for each cell using Pagoda (pathway and gene set overdispersion analysis), a computational framework designed for characterizing transcriptional heterogeneity in scRNA-seq data. First, Pagoda fits a cell-specific error model using a modified mixture model approach. This approach models each gene in a cell as a mixture of amplification processes (negative binomial distribution) and dropout events (Poisson distribution). Next, it adjusts the variance of each gene by renormalizing the observed expression based on the error model estimates, which also includes batch corrections. To determine the significance of residual variance, the chi-square test is applied. Then, the method performs weighted Principal Component Analysis (PCA) for each gene set and utilizes the first principal component to quantify the activity of the gene set. Weighted PCA helps account for technical noise contributions. To assess the statistical significance of PAS, it compares the variance explained by the first principal component of the gene set with the expected variance calculated using random gene sets. It also corrects for multiple hypothesis testing to identify significant pathways with adjusted p-values < 0.05, termed as overdispersed, for subsequent analysis. We implemented this method using the Pagoda2 R package (version 1.0.11)76.
Identification of clusters based on metabolic pathways
To uncover the various metabolic states within cancer cells, we performed clustering on the pathway activity score data of metabolic pathways. First, we scaled the data to standardize the values, enabling a robust principal component analysis (PCA). We then computed a PCA matrix using the RunPCA function and selected appropriate principal components for subsequent clustering and visualization. We constructed a shared nearest neighbor graph with the FindNeighbors function, specifying 10 components, and applied the Louvain algorithm via the FindClusters function to identify distinct clusters. Finally, we visualized the clustering results using t-SNE plots, facilitating the interpretation of the metabolic landscape in cancer cells.
Construction of cancer-cell specific protein-protein interaction network
To gain a deeper understanding of the complex interactions among genes within cancer cells, we aimed to construct a comprehensive cancer-cell-specific PPI network. This approach allows us to decode crucial interactions and regulatory elements unique to cancer cells. We employed the SCINET (single-cell imputation and network construction) method to generate cancer-specific PPI networks using scRNA-seq data of malignant cells77. SCINET integrates a global, context-independent reference interactome (parsimonious composite network (PCNet)78 with scRNA-seq data. PCNet was constructed by integrating 21 distinct network resources (e.g., STRING, ConsensusPathDB, GIANT). It retains edges supported by at least two independent sources, resulting in a network that outperforms individual networks in predicting disease-related genes.
SCINET employs a decomposition-based imputation method to address noise and sparsity in scRNA-seq data by interpolating missing values and balancing gene expression levels. It builds on the ACTION framework, which iteratively decomposes the expression matrix into lower-dimensional archetypes that optimally capture the variability within the dataset. It then applies a rank-based inverse normal transformation to address the large differences in gene expression distributions, ensuring that the expression scales are comparable across genes. This technique computes two factors: one representing each gene’s expression across cells (row factor) and another representing the mean expression of all genes within a specific cell population (column factor). These transformations result in gene activity scores that are consistent and comparable across genes and cell types. To assess co-expression dependencies between interacting genes, SCINET assumes that an interaction requires both genes to have sufficiently high expression levels. This is quantified using the minimum expression value of two interacting genes as a statistic. A p-value is calculated under a null model of independence, quantifying the interaction strength for each gene pair and cell. To address noise and varying sample sizes across cell types, SCINET employs a resampling technique akin to ensemble learning. Cells are sampled randomly and individual interaction p-values are calculated. These p-values are aggregated using Fisher’s method to compute a meta p-value that reflects interaction likelihoods within the population. Repeated resampling produces an empirical distribution for each interaction, and the mean of this distribution is used for further analysis. This approach efficiently maps gene activity scores to the reference interactome and estimates interaction strengths at the cell-type levels. We implemented this method using the SCINET R package (version 1.0) with default parameters.
Subsequently, we applied the Leiden clustering algorithm to identify distinct modules within the network. To uncover the regulatory mechanisms governing metabolic processes, we performed hypergeometric tests to identify modules enriched in metabolic pathways and to determine the transcription factors associated with each module. An adjusted p-value threshold of < 0.01 was applied as the significance criterion for identifying metabolic pathways and transcription factors.
Network proximity analysis
We performed a network proximity analysis to explore the interconnectedness of genes across gynecologic and breast cancer subtypes. This method quantifies the similarity between two sets of nodes (e.g., genes or proteins) within a PPI network. It measures how “close” or “relevant” one set of nodes is to another based on their positions in the network, with smaller scores indicating higher proximity.
The algorithm computes pairwise shortest path distances between nodes in set A and set B within the network. These distances are then aggregated using the network proximity metric to calculate the average shortest distance, known as the proximity score79:
Here, (d(a,b)) is the shortest path distance between gene a from set A and gene b from set B within the network. It focuses on the closest interaction between the two sets and captures the average closeness of the two sets.
To assess the statistical significance of the proximity score, we performed a permutation test. Nodes were randomly sampled from the entire network, ensuring their degree distributions matched those of the nodes in the original sets. Using these random samples, we calculated the mean and standard deviation of proximity scores across 1000 permutations. The Z-score was then determined, providing a normalized measure of proximity as follows:
Here, ({d}_{m}) and ({sigma }_{m}) are the mean and standard deviation of the permutation test. We used the PPI network nodes for gynecologic and breast cancers, with PCNet serving as the reference network. Two cancers were considered significantly proximal or overlapping in the interactome if they satisfied the criteria of a Z-score < −2 and a p-value < 0.001, indicating a high degree of interaction similarity. This analysis was implemented using the NetworkX library in python.
Inference of gene regulatory network
To elucidate the regulatory mechanisms underlying cancer progression at the single-cell level, we employed the SCENIC method to construct a gene regulatory network. SCENIC is a computational approach designed for inferring gene regulatory network from scRNA-seq data80. The pipeline consists of three main steps: first, it identifies potential regulatory modules by analyzing co-expression patterns among genes through a regression-based network inference method. Subsequently, it refines these co-expression modules by leveraging transcription factor motif information to remove indirect targets. Finally, the activity of these identified regulons is evaluated in individual cells using AUCell. Based on AUCell scores, we computed the regulon specificity score (RSS) to identify patient-specific regulons. This method was implemented using the pySCENIC (version 0.12.1) package available in Python.

Responses