A systematic framework to reduce urban embodied carbon emissions using urban scale simulation

Introduction
The construction industry is a significant contributor to global carbon emissions. According to the United Nations’ report, Global Status Report for Buildings and Construction, the sector accounts for 37% of environmental emissions, with 10% directly from building construction1. Embodied carbon—emissions from material extraction, manufacturing, transport, installation, maintenance, and demolition2—is a crucial yet often overlooked factor3,4.
While research and regulations have advanced operational energy efficiency5, achieving carbon-neutral cities requires a more comprehensive approach and despite extensive research and regulatory efforts, there remains a critical gap in understanding the whole lifecycle of embodied carbon in building stock at the urban level. Addressing the climate crisis and achieving carbon neutrality necessitates quantifying all carbon emissions from building stock and implementing reduction strategies. This gap is particularly evident in the lack of high-resolution, granular data and comprehensive frameworks to assess embodied carbon emissions across entire urban areas for building life cycles, specifically in developed countries6,7,8,9,10.
Despite the emphasis of green building codes and regulations on operational carbon reduction, empirical studies on embodied carbon mitigation remain limited due to insufficient high-quality data11,12. As urban areas grow, detailed, high-resolution building data inventories are essential for studying and implementing embodied carbon reduction strategies13,14. Furthermore, urban carbon emissions are shaped by interconnected decisions across construction and maintenance5,12,15,16, yet current methodologies and datasets are inadequate for comprehensive assessment and mitigation.
To this extent, this research aims to bridge this gap by developing a comprehensive framework to assess the embodied carbon emissions of building stocks at an urban scale to (1) systematically create a high-resolution building lifecycle emission dataset for the urban areas, (2) evaluate the outcomes of various mitigation strategies and quantify their probability, and (3) identify the most influential factors affecting urban embodied carbon emissions and introduce the optimal parameters to mitigate the urban carbon emissions. To achieve these goals, a comprehensive simulation study has been designed, using the Chicago metropolitan area as a pilot case. This study focuses on the Cradle-to-Grave stages of the lifecycle (A–C phases), excluding the operational carbon from stage B to focus on embodied carbon emissions.
Various approaches exist for calculating and mapping urban building carbon emissions, depending on data type, models, emission sources, and analysis goals17. Two primary methods are top-down and bottom-up approaches14. The top-down method aggregates macroeconomic or statistical data within geographic boundaries (e.g., urban or national) and timeframes, then segments it by building type or location18. In contrast, bottom-up techniques analyze individual buildings, materials, or technologies before scaling up to a broader stock-level view. Mastrucci et al.19 pointed out that bottom-up methods provide a better resolution for identifying the distinctive characteristics of particular buildings, enabling a more precise assessment of embodied carbon emissions14.
Top-down techniques can be categorized into statistical and computational models14,20. Statistical models derive correlations from macro-scale historical data and socioeconomic variables like economic growth and population dynamics to explain the link between carbon emissions and building activity18. Based on the model transparency, these models are also divided into white box and black box models in the previous literature21. Both models perform well when predicting the macroeconomic performance of the building stock and the influence of embodied carbon under various development scenarios. The National Energy System (NEMS), cited by the Energy Information Administration (2009), is a well-known statistical top-down model. Meanwhile, the rise of machine learning has increased interest in computational models, which leverage advanced computing resources22,23. The bottom-up approach utilizes three main model types: computational, statistical, and physics-based models14,24,25. The key difference between top-down and bottom-up models lies in data granularity—while top-down models use macro-level data, bottom-up models rely on site-specific information14. Physics-based models are further divided into two subcategories: the building-by-building approach, which analyzes individual structures26, and the archetypal method generalizes building attributes into standard models, also known as hybrid models21,27.
As a current gap, the majority of the current studies are using top-down methods and are mainly located in developing countries such as China. These studies mainly focus on urban agglomeration and mainly use multi-regional input-output methods28,29,30. Zheng et al.31 is one of the few studies that work with a bottom-up approach. However, this study does not provide a generalizable framework and is also limited to three types of buildings residential, industrial, and public to assess the material intensity31. Kayaçetin and Tanyer32 is another study with a bottom-up approach implemented in Turkey. Even though this research follows a more detailed framework for building emission calculation, the archetypes are not data-driven and are based on four main projects which limit the methodology generalizability and are more focused on neighborhood level32.
Furthermore, The growing demand for accurate building attributes and spatial data has led to increased use of geographic information in bottom-up building stock quantifications. Tanikawa and Hashimoto, (2009) pioneered geo-localized assessments of building materials in infrastructure and buildings33. Urban-scale building life cycle carbon emissions are complex due to multiple interrelated factors shaping a city’s carbon footprint34,35. Therefore, as with other complex systems, simulation is a valuable tool for assessing decision impacts on real-world outcomes36,37,38.
Over the past decade, simulations have been widely used to study and mitigate urban carbon emissions, primarily focusing on transportation39,40. Some studies also examine urban expansion; for example, Wang et al.41 analyzed carbon storage loss under different expansion scenarios in Wuhan, China, though without considering buildings’ operation and maintenance impacts41. Li and Deng42 developed an algorithm to simulate urban transportation emissions using a big data fusion machine learning model42.
Construction land expansion is another popular research concentration related to urban carbon emission. In 2022, a research in Guangzhou, China worked on the carbon emission related to the construction land demand between the years 2030–206043. This simulation model works based on a prediction model based on dual carbon goals, carbon peak, and neutrality, and not the actual ongoing scenario. Tian and Zhao44 were other researchers who worked on the construction land demand on the urban scale in Changsha, Zhuzhou, and Xiangtan cities44, while another 2024 study used multi-scenario simulations for land expansion in Beijing, Tianjin, and Hebei45.
Li et al., (2023) applied the Plus and Grid model to predict Tianjin’s land use emissions for 2030 using 2000–2020 data46. In another urban carbon emission study, Hao and Ma47 concentrated on the demolition and construction waste through a system dynamics simulation47. Migoni Alejandre et al.48 developed a bottom-up approach model combined with Monte Carlo simulation to assess the cradle-to-grave phase in Amsterdam. However, this study mainly focuses on specific hybrid structural systems to examine bio-based materials vs. conventional materials in urban densification projects and lacks temporal variability in its simulation48.
Despite these advances, no studies have simulated urban building stock carbon emissions across full life cycle assessments, particularly with dynamic models capturing urban planning scenarios, uncertainties, and probability distributions. Moreover, most research has focused on developing countries like China and urban expansion. This study addresses these gaps by developing a comprehensive simulation tool to quantify various scenarios and their occurrence probabilities.
Results
Descriptive statistics
A total of 1,010,840 buildings were studied in this research. Among these buildings (shown in Fig. 1), the oldest was built in 1939, while the newest was built in 2017. Since the oldest buildings in this dataset from Chicago are no more than 85 years old, this led to the decision to choose a range of 50 to 80 years for the simulation analysis. Figure 1 represents the geographical distribution of the buildings with different land coverage, year built, number of floors, structure type, and envelope type. The land coverage is the ratio of the occupied land by the building construction. This category has a denser pattern in downtown Chicago as demonstrated in Fig. 1a. Year-built visualizations also show that most of the newer buildings are seen in areas away from downtown. The visual correlation between this information and the roof type shows that the newer buildings tend to use shingle and asphalt roofs while the older ones are towards tar and gravel. Wall material as the other envelope type shows a more diverse pattern. Regarding the structure type, there is also no significant pattern visible, while for the number of floors, the center areas of the city have a higher number of stories.

a Land Cover, b Year Built, c Number of Floors, d Roof Type, e Wall Type, f Structure Type.
This dataset also included the emissions of each of these buildings. Table 1 demonstrates the mean, standard deviation, percentiles, minimum, and maximum amount of the environmental emissions of these buildings. Each of these categories is being measured in different units including GWP in kg CO2 eq/m2, acidification in kg SO2 eq/m2, eutrophication in Kg PO4eq/m2, human health (HH) particulate in PM2.5 eq/m2, ozone depletion in CFC eq/m2 and smog formation in kg O3eq/m2.
As shown in Table 1, the environmental impact of buildings in the Chicago Building Stock dataset varies significantly for each building, illustrating the diverse environmental footprints, likely due to differing construction materials, ages, and operational practices. This variability coupled with the frequency of the older buildings that need renovation and updates in the foreseeable future (see Fig. 1 for the proportion of older buildings to newer ones), suggests substantial opportunities for targeted interventions to reduce environmental impacts in the building sector. Consequently, this simulation study on different scenarios becomes highly beneficial for optimizing the city’s environmental impact.
Simulation results
To assess Chicago’s emission across various scenarios, 350,000 iterations were conducted. Table 2 provides the overall statistics for this simulation study, including each variable’s and emission sections’ mean value, standard variation, and range. The results demonstrate that the mean value of each variable is exactly in the middle of the chosen range, validating a uniform distribution of the simulation scenarios without any imbalance. For example, the four different age thresholds (50, 60, 70, and 80) yielded approximately 87,500 iterations each, resulting in a mean value of 65, thus validating the simulation’s distribution results accuracy (see Table 2 and Fig. 2)
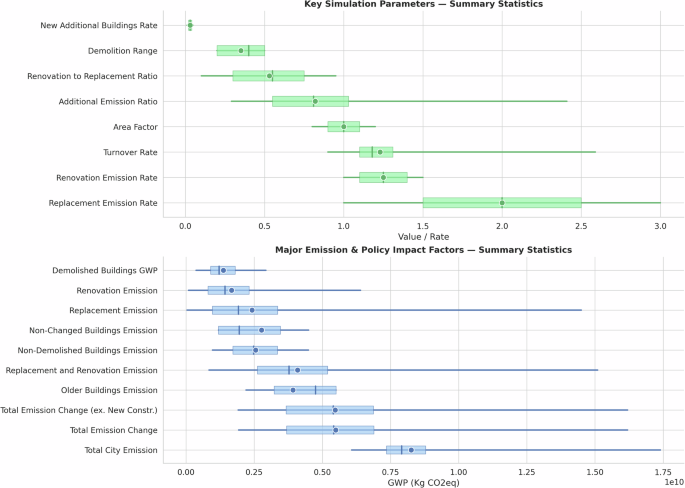
Simulation variables general statistics.
The general statistics table offers insight into the expected GWP emissions and the turnover rate under different scenarios. The city’s total changed emission averaged 5.49 × 10⁹ Kg CO2 with a value ranging from as low as 1.93 × 10⁹ Kg CO2 to as high as 1.62 × 10¹⁰ Kg CO2. Total change emission refers to the emissions resulting from implementing different defined strategies in the city. This wide range, an 8.4-fold difference, underscores the critical need for thorough simulation studies and informed policymaking to mitigate environmental impacts in urban areas.
Furthermore, the study showed that the impact of new construction in Chicago averages about 5.42 × 10⁵ Kg CO2. Interestingly, the impact of replacement and renovation is about 4.09 × 10⁹ Kg CO2. This means constructing new buildings emits 7,500 times more embodied than renovating and reusing existing buildings. The evidence clearly demonstrates that future urban development policies should prioritize the preservation and renovation of existing buildings over constructing new buildings, consequently reducing urban sprawl. It should also be noted that these values are based on a 50,000 buildings sample to reduce the computation cost and allow more iterations for more accurate results. That means the actual unit-based values in the city of Chicago are about 20 times larger than the stated numbers, which emphasizes more on the importance of different scenarios.
Given the significant differences in environmental impact between new construction and preserving existing buildings, we examined variables related to existing buildings. The building lifespan was identified as a key factor. Determining the optimal value for building lifespan has been a highly debated topic in recent urban planning studies. To compare the impact of different building lifespans, this study divided emission variables by age thresholds and plotted the results as histograms. These visualizations, shown in Fig. 3, reveal that the considered lifespan of buildings significantly affects urban-scale CO2 emissions. Specifically, scenarios assuming a 50-year lifespan resulted in approximately three times more emissions compared to those with an 80-year lifespan. This finding indicates that policies promoting the renovation and preservation of existing buildings to prolong their lifespan are more effective in reducing cities’ environmental impact.
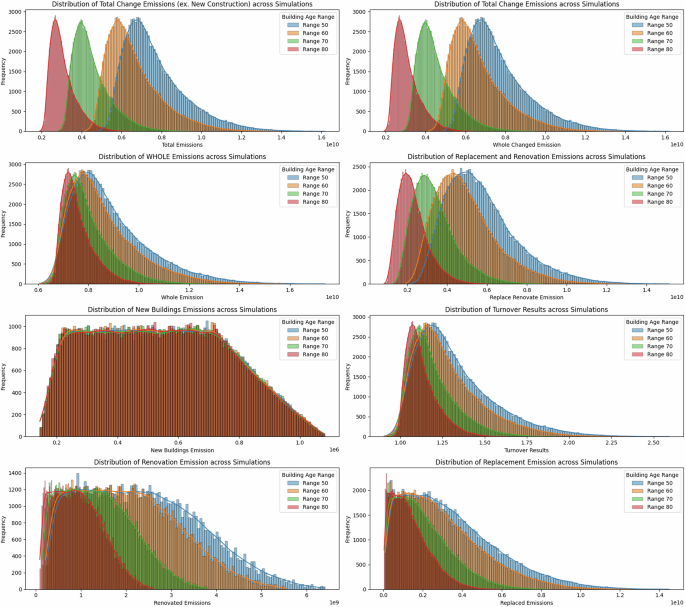
The simulation results for different building age thresholds.
Furthermore, the results showed that prolonging the building’s lifespan is associated with reducing the risks related to expected emissions in urban planning scenarios. This is specifically evident in the standard deviation of the histograms in Fig. 3, where the blue curve demonstrates the 50-year lifespan results from total emission and the red one indicates the 80-year lifespan. As shown, longer building lifespans result in narrower histograms approaching a normal distribution, while shorter lifespans produce histograms with longer tails. This suggests that longer lifespans reduce the risk of unpredictable and uncontrollable emission scenarios. Additionally, the data revealed that renovation-related emissions are more sensitive to changes in building age thresholds than replacement scenarios. It is important to note that most buildings in Chicago are masonry-based, which naturally have longer lifespans and lower embodied energy compared to other construction materials49,50. This characteristic of Chicago’s building stock likely contributes to the trends observed in the histograms, underscoring the importance of considering local construction practices and materials in sustainability assessments. It also highlights the potential for mitigating urban emissions by extending building lifespans.
Sensitivity analysis
After analyzing the simulation results, a sensitivity analysis was conducted on building lifespan and building area, as two main emission mitigation methods51. In the first analysis, the relationship between building lifespan, area change, and embodied carbon emission was examined (see Fig. 4). The results were aligned with the findings in Fig. 3 and indicated that the building’s lifespan has a significant potential impact on future building stock emissions in Chicago. This means that the longer the building can be used (i.e., a higher threshold of building age), the lower the life cycle embodied carbon emissions (LCA A–C phases.) In other words, techniques that extend buildings’ lifespan significantly reduce its environment’s emissions.
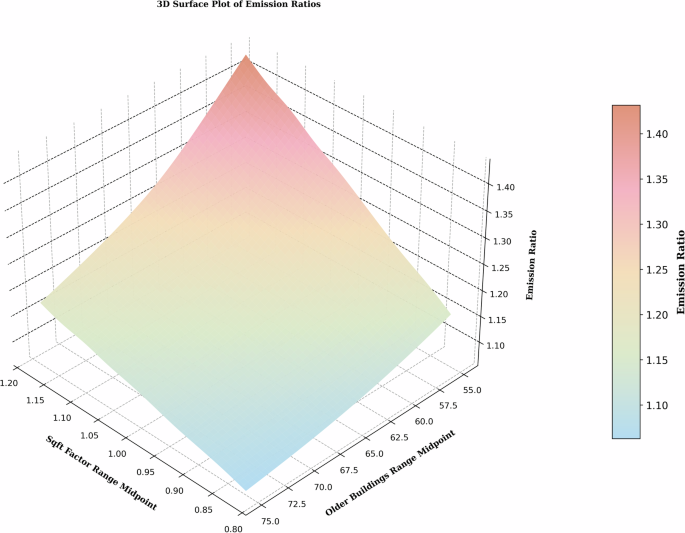
The average turnover change per lifespan and area change.
Interestingly, the building floor area was a factor that greatly impacted the building’s lifespan change effectiveness on the building stock emissions. As demonstrated in Fig. 4, the scenario of buildings with a lifespan of 50 years but with a floor area of 0.8 (compared to baseline floor area) had almost the same emission rate as the 80-year lifespan and 1.2 buildings floor area (compared to baseline floor area). This means besides a 20% change in the building area can change the emissions significantly, it also influences the effectiveness of increasing the building lifespan. Based on this result, a hybrid mitigation approach, including both is necessary. This means that while policymakers should focus on extending the lifespan of existing buildings through renovation, both this aspect and the buildings’ area are crucially important to consider in new constructions. Therefore, in the new construction projects and replacement projects for the current buildings, the urban planners should consider both extending the lifespan from 50 to 80 (e.g., through choice of materials, maintenance management plan, etc.) and decreasing the area of the buildings through design strategies. This strategy can achieve the best possible outcomes for environmental preservation and promote smarter, more sustainable growth.
Additionally, these findings showed that the trend between these variables is not a linear relationship. As shown in Fig. 4, the impact of lifespan changes on the emission ratio follows an exponential trend. This means the reduction in emissions is greater when the lifespan changes from 60 to 50 years compared to a change from 80 to 70 years. Consequently, even if achieving an 80-year lifespan is impossible, increasing the lifespan by 10 years can still be highly beneficial. Furthermore, the slope becomes notably steeper for buildings with larger areas. This insight aids crucial urban planning decisions and suggests that policymakers can optimize between building lifespan and area based on city preferences for larger or newer houses, which can be a crucial choice based on many factors such as the climate zone and weather condition of the city.
The same analysis was applied to different demolition ranges to verify the generalizability of this result between different urban sprawl or urban shrinkage scenarios (see Fig. 5). The results showed that, despite some fluctuations, the same pattern persists. The only variations are the emission ratio ranges in different scenarios. This means that although urban sprawl scenarios generally result in higher emissions, the strategies for mitigating emissions remain consistent with those for deurbanization scenarios.
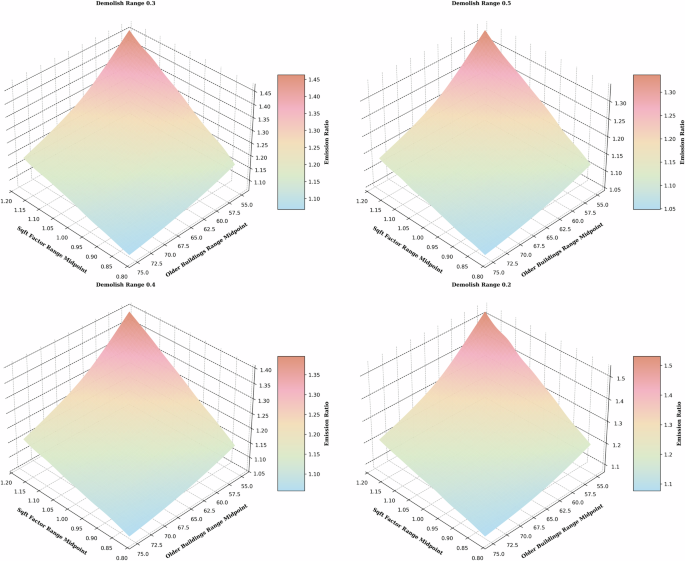
The higher demolition is equal to deurbanization while the lower ones are urban sprawl scenarios.
To provide a big picture of the variables’ impact, the effect of other variables including the renovation and replacement rate, renovation versus replacement proportion, and building lifespan on total emission and their confidence interval was examined (see Fig. 6). First, for the building lifespan, as demonstrated in Fig. 6, the line plot confirmed that the exponential trend between buildings’ ages exists and showed that by moving towards the shorter lifespans, the probability band gets wider. This means that lower lifespans have a higher risk for emission control strategies.
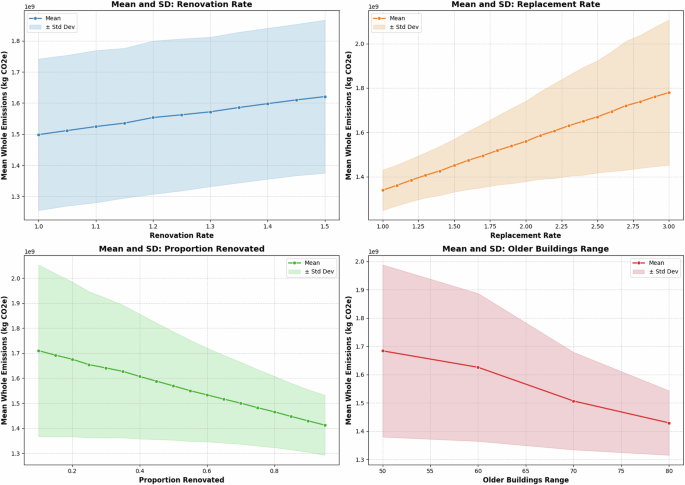
Sensitivity analysis results for replacement, renovation, renovation proportion, and buildings’ lifespan variables.
The renovation strategies, on the other hand, had the steadiest probability band. This means lower risk is associated with renovation-based strategies that emphasize the value of renovation for urban areas. Moreover, the level of their impact on the whole city emission even in its worst percentages was notably milder than the other scenarios. Replacement scenarios, on the other hand, had a much sharper trend. That means, with an increasing replacement rate in the replacement scenarios, the chance of emitting a significantly higher amount of CO2 to the environment is much higher compared to the renovation scenarios. Furthermore, the probability band gets wider in the higher values of replacement emission rate, which makes this method is also more prone to risk. According to the points mentioned, the proportion of renovated trends was also reasonable, suggesting higher renovations for lowering the emission and decreasing the unwanted emissions risk.
Overall, the simulation and sensitivity analyses revealed that building lifespan and area significantly impact emissions in Chicago. In other words, higher building lifespan and smaller building areas reduce emissions significantly. Moreover, a 20% reduction in building area can match the emission reductions achieved by extending lifespans from 50 to 80 years. Accordingly, a hybrid approach, initially using shorter lifespans with smaller floor areas followed by lifespan extensions through renovations, is optimal for minimizing emissions. The results also indicated that renovation strategies pose the lowest risk for emission control, while replacement strategies have higher variability and risk. These findings emphasize the importance of strategic planning in urban development for sustainability.
Discussion
This research developed a systematic method for analyzing building stock emissions, with a specific focus on embodied carbon emissions in the United States. The methodology was implemented using the Chicago metropolitan area as a case study, demonstrating its applicability in quantifying urban embodied carbon emissions and providing valuable insights into the long-term CO2 emission influenced by various urban development scenarios. The objectives of this study can be summarized as (1) developing a robust and generalizable simulation method for assessing urban embodied carbon emissions across different scenarios, (2) evaluating the impact of diverse variables on carbon emissions, (3) identifying the optimum ranges and trade-offs among these variables to mitigate the environmental impacts effectively.
Through Python programming, a specialized simulation platform was designed, incorporating a series of visualizations to achieve its objectives. The findings underscore the crucial role of building lifespan in determining urban carbon emissions. Emissions from alternations were approximately three times higher in the scenarios with a 50-year building lifespan compared to those with an 80-year lifespan. This exponential effect of building lifespan changes on emissions highlights the urgent need for strategies that prioritize building longevity. Additionally, the area of newly constructed and replaced buildings significantly impacted the efficacy of age restriction policies. A 20% change in the total building area could negate the benefits of long-lifespan scenarios or alleviate the negative impacts of short-lifespan scenarios.
The study indicated that renovation strategies aimed at extending building lifespan are not only preferable but also predictable. The research indicates that currently, only about 1% of buildings undergo renovation annually52. Consequently, it is imperative for city planners to develop standards and regulations that facilitate building renovations, particularly as buildings age. The findings of this research can be used by city and urban planners, construction policymakers, environmental engineers, and the civil engineering community.
This study relies on several assumptions and data sources, including the National Structure Inventory and Cook County datasets, which may have limitations in resolution and completeness. The model incorporates probabilistic estimates, such as building lifespan, renovation rates, and emissions, introducing inherent uncertainties. While Monte Carlo simulations mitigate some risks, results should be interpreted within these assumptions. Future studies could enhance accuracy through higher-resolution datasets, real-world validations, and AI-based material extraction.
Future studies are suggested to expand the application of this model to other cities in different situations and climate zones, such as coastal cities. Methods such as Google Street View and computer vision combination to extract materials53,54,55 can be utilized to enable this expansion. Researchers can also work on embedding the proposed methodology into a standalone plugin tool to calculate city emission scenarios. Additionally, the study’s outcomes can be utilized in developing prediction models and Bayesian networks through a causal network56,57 to estimate building emissions under user-defined scenarios and variables. Future studies are also recommended to consider seeing the effect of other emission mitigation strategies such as lightweight material usage and assessing the cost of different scenarios.
Methods
As shown in Fig. 7, this study includes three major steps. Step one was designed to create a comprehensive dataset of the buildings’ data in the metropolitan area of Chicago as a baseline for creating buildings’ archetypes. The second step was designed to use the Athena life cycle assessment software to model and extract the environmental impact of each building archetype, specifically the embodied carbon emissions. Afterward, the third step of the study aimed to geo-assign each archetype to its location in the Chicago to build a comprehensive model of the Chicago built environment embodied carbon and run simulations of the effect of different mitigation policies. The following methodology sections explain the details for each of these steps.
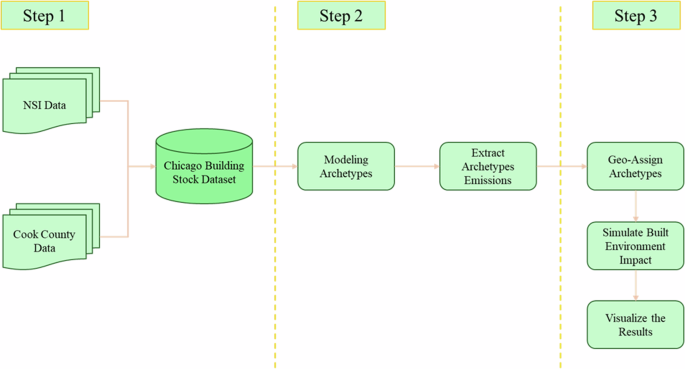
Research Flowchart.
Building stock dataset creation
Various sources were used to create a comprehensive database, with the National Structure Inventory (NSI) dataset serving as the primary source58. The United States Army Corps of Engineers initiated the NSI to enhance their levee and dam screening program. The latest version of this dataset has been made publicly available and integrated into the Federal Emergency Management Agency’s (FEMA) database. Information gathered for Chicago from NSI includes building structure type, foundation type, square footage, number of floors, and coordination of each building. However, this dataset does not include the building envelope materials, despite wall and roof materials being significant factors in environmental emissions14,59,60.
To gather the building envelope data, the Cook County Open Data was utilized, which included information on building wall and roof materials, the heating and air conditioning systems, building area, and geocoordinates. By matching the geocoordinates from the Cook County data with those in NSI dataset, information for over one million buildings in the Chicago metropolitan area was compiled. Table 3 demonstrates the selected variables from each of these two major datasets, creating an integrated building stock dataset for Chicago.
Archetypes creation
Detailed calculations for each specific building can achieve the highest level of precision for a building’s life cycle environmental impact. Nevertheless, this solution is not possible in large-scale urban areas due to the enormous number of buildings. Consequently, the bottom-up approach provides one of the most accurate methods for building LCA assessment14.
The first step for the bottom-up LCA assessment on the urban scale is defining the building archetypes14. Archetype is defined as buildings that carry general similar characteristics such as material and structure14,61. To specify these features, this study used the variables in the dataset created in the previous part to represent the Chicago building stock. Table 4 shows the values existing in each variable for creating the archetypes.
The naming convention S-F-WW-RR was used to describe the archetypes. The first letter in this convention stands for structure type, and the next letter (F) is for foundation. WW represents the exterior wall materials while RR indicates roof construction types. The order of these values has been displayed in Table 4. Based on the main structural options, external wall materials, foundation kinds, and roof types, 157 archetypes representing more than a million buildings in Chicago were produced by this research. To elaborate on how the naming convention works, a building with a masonry structure (W), basement foundation (B), wall type 1 (W1), and roof type 2 (R2) is represented by the code “MBW1R2”. Having these 157 archetypes as the representatives of Chicago, the next step of a bottom-up approach, estimating the life cycle emissions of each archetype, could be executed. The authors’ previous study showed this method of archetype data creation as a suitable bottom-up approach for urban areas62.
Archetypes cradle-to-grave life cycle assessment
The environmental impact of the entire building stock in Chicago was assessed in two steps. In the first step, all the archetypes were modeled in Athena Impact Estimator version 5.5, generating a dataset that includes three Life Cycle Energy Consumption (LCEC) indicators, especially the total GWP in different lifecycle phases. Every archetype was built to be 1000 square feet (SQF, 92 square meters) with one floor. Embodied energy was also calculated for each archetype, quantified by their primary energy usage across their full life cycle. The life cycle assessment system boundary considered in this study included the cradle-to-grave stages (A–C) minus operational carbon throughout these phases in LCA stage B.
In the subsequent step, each building in the newly created Chicago dataset was assigned an archetype, noting the building’s year of construction, floor area, and number of stories. Given that the Athena models were based on a 1000 SQF, single-story building, the results can be scaled down per 1000 square feet to determine the environmental emissions for each archetype per square footage per floor. Using Eq. 1, emissions for each building were then calculated, taking into account the building’s area in square feet and the integer number of floors.
In this equation, EA represents the emission of each archetype, AB represents the area of the building, and NF is an indicator of the number of floors in the building. The result of this equation gives the amount of environmental emission or impact of each building, and EA can be replaced with any desired emission from the Athena model. By applying this equation to all emission types and buildings, the final dataset was created, including over one million buildings with all their environmental impact information, year built, area, and archetype code etc. This generated dataset provides the platform for designing a thorough urban scale simulation and sensitivity analysis to assess the urban planning decisions’ impact on the environment.
Urban scale simulation and visualization
After creating the building stock dataset, a simulation analysis was developed and executed using Python to evaluate the effects of various urban policies on carbon emissions. From the life-cycle assessment (LCA) standpoint, a building’s age generates several scenarios that affect its emissions. For example, demolition, replacement, and renovation are typically considered when a structure approaches its end of service life. The common lifespan of the building ranges from 50 to 100 years63. Considering the age range of the buildings in Chicago, this study assumed a lifespan of 50 to 80 years with 10-year increments. This threshold helps categorize buildings into old and new ones for analysis. In addition to the scenarios for existing buildings, new constructions with varying floor areas can also occur within the city. The simulation aspect is crucial, as it accounts for the potential changes in these variables and how different scenarios might affect various buildings.
Python programming was utilized to implement the simulation logic. To define the logic in a way that covers the real-world possible scenarios, a range of different likely values were considered in the programmed code. Table 5 demonstrates the range of these variables in this study.
The designed simulation is iteration-based, introducing novelty by randomly selecting variable values in each iteration. For instance, in the first iteration, the model might set a 50-year building age threshold, with renovation and replacement emission at 120% and 150%, respectively, with a 0.4 ratio between renovation and replacement and a 4% rate for new buildings with 110% of the current building area (the new building is built bigger than the older ones by 10%). The model randomly selects a percentage of the buildings older than 50 years for demolition (e.g., 50%) and then applies the defined ratio to determine renovation and replacement actions for the remaining buildings. The model considers the buildings younger than 20 years as new and uses their current archetype distribution to create the new buildings. In the subsequent iteration, these variables and selections change randomly. Such a method can count for the uncertainty of building stock change. Figure 8 demonstrates this iterative process for calculating the whole building stock emission.
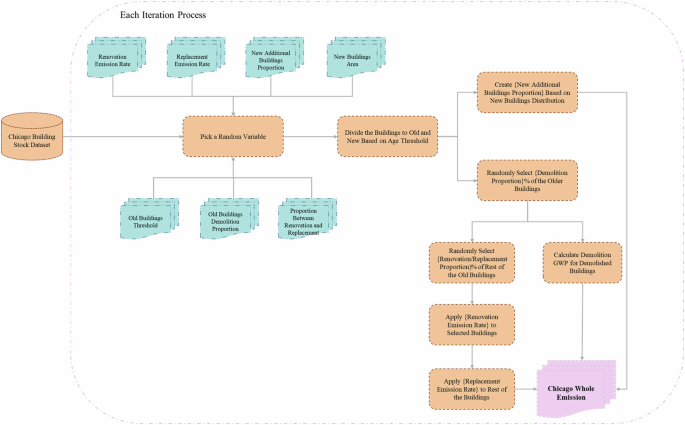
Simulation process flowchart.
This method not only covers all possible combinations of variable ranges but also considers different individual buildings among over one million existing buildings in each iteration, following their statistical distribution. This simulation, leveraging Monte Carlo logic64,65,66, produces a wide array of scenarios that conventional Monte Carlo simulators will not be able to achieve. To ensure comprehensive coverage, the simulation was run through 350,000 iterations. Results were analyzed using heatmaps, boxplots, histograms, line plots with confidence levels, and 3-dimensional plots, offering a thorough and visually informing representation of the data.
As the limitations of this methodology, this study assumes a similar interior material and quality for the buildings due to the unavailability of this data. Furthermore, the height information in the NSI data is not always accurate58, and therefore buildings with an abnormal number of floors were dropped from the dataset. Additionally, the simulation variables assumed in this study cover a slightly wider range than the common emission ranges to cover extreme cases and make the study more comprehensive.


Responses