A toolkit for quantifying individual response to herbal extracts in metabolic and inflammatory stress

Introduction
Growing attention has been given to health, which is driven by increasing healthcare costs and the rising prevalence of lifestyle-related diseases1. In response to these challenges, there has been a growing acknowledgment of the need to shift the focus from treating diseases to preventing them and enhancing overall health2. To achieve this goal, a precise definition of health is essential; however, currently, there is no standardized scoring system for defining and quantifying health.
The ability of the organism to adjust homeostasis in response to a dynamic environment is referred to as “phenotypic flexibility” or “resilience”3. The quantification of resilience involves evaluating a set of biomarker reactions to external stressors, including standardized meals, temperature fluctuations, or physical activity, across a time3,4,5,6. This adaptability is essential for maintaining overall balance and promoting a healthy life. Consequently, health is defined as the capacity to keep a consistent state of homeostasis in diverse and altering environmental conditions.
Nutritional research faces several challenges when measuring the effect of herbal extracts on healthy individuals. The differences in biomarker values among individuals are often greater than the intervention effect. Therefore, new ideas and methods are needed to more accurately measure any subtle impacts that dietary changes may have on healthy individuals7.
As a result, a standardized mixed-meal challenge test defined as the PhenFlex challenge test in intervention studies was developed. This high-calorie mixed-meal challenge test elicits a subtle systemic metabolic reaction, enabling the assessment of health status and the impacts of nutritional interventions4,8. In the conventional approach, health effects are typically assessed by analyzing a limited number of individual biomarkers obtained through overnight fasting or before/after nutritional intervention. However, the PhenFlex challenge test provides a sensitive evaluation of individual health and the effects of nutritional interventions, utilizing an integrated set of biomarkers associated with the same biological process9.
Omics, including mRNA transcripts, proteomics, and metabolomics, encompass the examination of biological components. In particular, proteomics has been proven as a practical approach for establishing connections between phenotype and omics information10,11. There are effective strategies that need to be explored to determine the importance of these pathways. Many tools, such as principal component analysis (unsupervised method) and partial least squares discrimination analysis (supervised method), have been developed to explain parameter variability in health status. However, these methods have limitations in that they do not provide information about fundamental biological processes.
A new approach called “health space modeling” has since been developed to analyze/visualize the health status of individuals in multidimensional space using machine learning methods12. Health space modeling was used to quantify and visualize the effects of food and nutrition on the resilience process of restoring or maintaining homeostasis at the individual subject level. This enables researchers to examine responses based on the fundamental biological processes, establishing the parameterization in a manner that is biologically significant12.
Since the effectiveness of treatment is also difficult to quantify, it is assumed that the PhenFlex challenge test combined with the health space method could be helpful. In this study, we conducted two intervention studies with randomized, double-blind, placebo-controlled, and crossover designs using the PhenFlex challenge test model. Therefore, this study was performed to develop and validate a toolkit for evaluating the effects of herbal extracts on a healthy population in terms of metabolism and inflammation using health space modeling techniques and the concept of challenge tests. The specific aims of this study were as follows: (1) to quantify the health status and develop and validate the model using a machine learning algorithm with a 10-fold cross-validation generalized linear model that predicts health estimation scores for metabolism and inflammation, and (2) to visualize individual health status across treatment or nontreatment subjects from two intervention studies to quantify the health effects of herbal extracts. The results obtained in this study can contribute to a better understanding of nutritional research by providing easily interpretable validation of health effects resulting from interventions, along with personalized health quantification and advice8.
Results
Feature selection
The study aimed to distinguish metabolic and inflammation scores using selected features across two experiments. A total of 13 and 13 features were selected for the models to distinguish metabolic and inflammation scores, respectively, in Experiment 1. For the axis representing resilience in the inflammatory index, 35 features and 11 features for the metabolic score were presented in Experiment 2. The list of features is shown in Supplementary tables 1 and 2.
Construction model for health space
To construct a comprehensive health space model, data from two intervention studies were combined. Participants receiving a placebo or high-dose herbal extracts were divided into the training set for developing the model, while the low-dose group served as the test set for model evaluation. Generalized Linear Models (GLMs) were employed with 10-fold cross-validation to distinguish between reference groups: placebo (baseline) and healthy (high-dose). These reference groups were pivotal in creating the health estimation score model and a visualized health space model, representing the extremes of phenotypic flexibility. Health estimation scores, derived from selected features, showed distinct separation between reference groups, with intermediate groups exhibiting scores proportional to their phenotypes. The health estimation score with higher or lower responses to the PhenFlex challenge test carries biological significance, indicating potential benefits or detriments to health. Each figure shows the results of each model in Experiment 1 (Fig. 1A) and Experiment 2 (Fig. 1(B)).

The panel illustrates the application of the final predictive model to assess metabolic and inflammation scores in participants from (A) Experiment 1 and (B) Experiment 2. The X-axis represents the groups (placebo, low-dose treatment, high-dose treatment), and the Y-axis shows the predicted metabolic and inflammation scores. The box plots display the distribution of scores with the median represented by the central line in each box, the interquartile range (IQR) by the edges of the box, and the whiskers extending to 1.5 times the IQR. Individual scores are shown as small symbols, and the red dots represent the mean. Analysis of variance (ANOVA) was used to analyze the changes between groups. Significant differences were determined at p < 0.05.
Validation of the model for health space
Many different metrics are used in machine learning and data mining to develop and evaluate models. For model evaluation on a test set, the accuracy or area under the ROC curve can be used13. Model validation was conducted using ROC curves, comparing the performance of the models on the training (black curve) and test (blue curve) sets in both Experiment 1 and Experiment 2 (Fig. 2). The ROC curves illustrated the effectiveness of the models in distinguishing between different treatment groups based on their metabolic and inflammatory profiles.
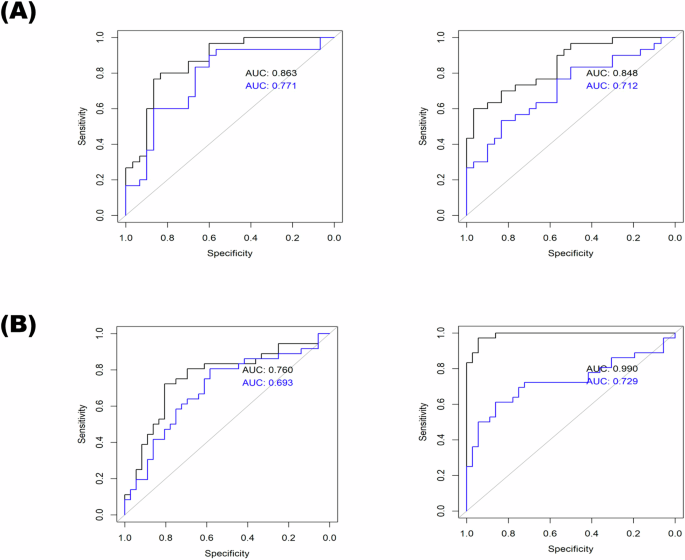
This figure presents the Receiver Operating Characteristic (ROC) curves for the elastic net model applied to both the train and test sets in two experiments: A Experiment 1 and B Experiment 2. The elastic net model was trained using 70% of the data (train set) and tested on the remaining 30% (test set). The black curve represents the ROC for the train set. The blue curve represents the ROC for the test set. The X-axis represents the false positive rate (1-specificity), and the Y-axis represents the true positive rate (sensitivity). The area under the curve (AUC) for both train and test sets is indicated to show the model’s performance. A higher AUC indicates better model performance.
Prediction of the health estimation score in a health space
Following the training of the health space model, the final formula was established based on the AUC value of the ROC curve as verified in the test set, and the slope was used to indicate the distinction between the two reference groups. This formula was utilized to visualize a 2-dimensional health space (Fig. 3), where the axes represented metabolic and inflammatory responses. Using nontreatment (placebo) and treatment (high-dose) reference groups, the two extreme groups exhibited a clear separation along the two axes of the health space. The plasma clinical chemistry and proteomics results of an intervention study were represented in a 2-dimensional (2-D) space, with the two axes reflecting metabolism and inflammation according to the overall group data. The visualization effectively segregated subjects into distinct groups based on their responses to treatment, highlighting the utility of the health space methodology in categorizing individuals according to their health status. Overall, this structured approach facilitated a comprehensive evaluation of phenotypic flexibility and health outcomes, providing insights into the potential benefits or risks associated with specific interventions based on metabolic and inflammatory responses.
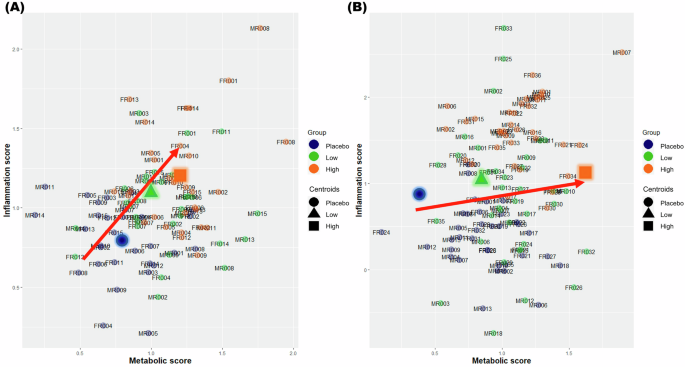
This figure illustrates the health space representing individual resilience in placebo and treatment groups by projecting data onto metabolic (X-axis) and inflammation (Y-axis) scores for (A) Experiment 1 and (B) Experiment 2. Participants were divided into placebo, low-dose treatment, and high-dose treatment groups. Each participant’s data was plotted in a two-dimensional health space. The X-axis represents the metabolic scores, indicating the participants’ metabolic health status. The Y-axis represents the inflammation scores, reflecting the participants’ inflammatory response. Each data point represents an individual’s scores. Different colors (placebo, low-dose treatment, high-dose treatment group) are used to distinguish between groups. Symbols such as circles (●) for placebo, triangles (▲) for low-dose treatment, and squares (◼) for high-dose treatment further differentiate the groups. Movement towards the upper right quadrant indicates improvements in both metabolic and inflammation scores, suggesting enhanced health resilience.
Discussion
In response to the growing emphasis on the strategic use of food for enhancing health and preventing diseases, it becomes imperative to quantitatively measure phenotypic changes that are close to, or even within, the range of a healthy state7. However, herbal extracts consist of various components and are highly complicated. In studies that confirm the functionality of food rather than the treatment of diseases, changes in phenotype are very subtle and difficult to measure. Therefore, in the meantime, the research group TNO has developed a comprehensive strategy to integrate a nutritional challenge test and health space modeling8,12. As an extension of the development of the quantitative health model, this study applied the health space model to intervention study data using machine learning techniques. This study developed health estimation scores in terms of inflammation and metabolism with a GLM for biomarker selection. Additionally, it validated the model and visualized individual health statuses and responses via multiple omics parameters. The health space model visually distinguishes different health states using predefined biomarkers. Notably, within a healthy range, subjects treated with a high-dose intervention displayed distinct positions in the health space compared to untreated individuals, indicating phenotypic flexibility.
In this study, it has been illustrated that the quantification of challenge-response proves to be more sensitive than fasting markers. Wopereis, Suzan, et al. demonstrated that the use of biomarkers in the PhenFlex challenge test was more sensitive than the use of the corresponding overnight fasting measures14. Different health score results were derived depending on the health condition. In particular, for nutritional interventions, proteomic biomarkers that respond after the PhenFlex challenge test were used, and it was possible to determine and visualize the condition by scores that individually diagnosed health according to health status in this study. Finally, this study evaluated individual subject levels via the PhenFlex challenge, and the analysis and visualization of predetermined biomarker panels effectively facilitated the differentiation between individuals within the healthy spectrum of the nontreatment and treatment groups.
Particularly, the subjects in the high-dose treatment reference group had higher scores for both of the defined metabolic and inflammatory axes. It can thus be concluded that participants who received herbal extracts had higher health scores than those in the nontreatment group. These findings suggest that the quantification of phenotypic flexibility through the health space model serves as a dependable indicator of individual health status. The assessment of the PhenFlex challenge, coupled with the health space methodology, can serve as a means to evaluate the impacts of (nutritional) interventions on (individual) health. By implementing the PhenFlex challenge test at different stages of the experiment and quantifying and visualizing biomarker responses in accordance with the health space concept, the health effects produced by nutritional intervention can be assessed8. Age constitutes a significant determinant of flexibility; however, a limitation arises from the uneven distribution of age within a narrow range. In further studies, age-specific recruitment and analysis are anticipated to yield more sensitive and informative results. In addition, one of the limitations of this study is the absence of independent tests based on sex differences. The initial analysis did not stratify data by sex, which might limit the generalizability of the findings. Existing literature suggests that physiological differences between sexes can influence metabolic and inflammatory outcomes, making it crucial to recognize these variations for a more comprehensive understanding of the study results and their implications. To address this limitation, future research will incorporate a stratified analysis by sex to identify significant differences in metabolic and inflammatory responses.
The primary objective of nutritional research is to enhance health and forestall or delay the onset of diseases. Unlike common biomarkers developed primarily for diseases, biomarkers that quantify health optimization are essential. The task of quantifying “normal homeostasis” and establishing validated biomarkers is challenging due to the robustness of diverse homeostasis and individual variations. Specifically, a thorough multiparameter (“omics”) analysis can identify crucial parameters (biomarkers) and enhance comprehension of health-supportive initiatives. A perturbation test (e.g., for metabolism, oxidation, inflammation, or psychological stress), which accurately measures the main drivers of health, can help create knowledge for maintaining health through nutrition and preventing disease15. Continued advancement of these innovative tools and the enhancement of omics instruments within the field of nutrigenomics research will afford us the chance to intricately and comprehensively depict the subtle effects of the nutritional phenotype. This aligns with recent biomarker profiling concepts and enables a more precise understanding of the subject7. The fundamental of precision health is expected to ultimately rely on the capacity to model human health and use real data for disease prediction, thereby innovating our understanding of healthcare. Additionally, precision health is rooted in the active implementation of personalized health practices16. Enhancements in sequencing quality, cost reduction, and progress in “omic” fields and biotechnology herald the advent of a new era characterized by variably labeled personalized or precision medicine17. The trajectory outlined in this discussion regarding precision health and integrated diagnostics has the potential to evolve into the future paradigm of healthcare.
In summary, quantifying and visualizing health by estimating health scores to evaluate the effects of inflammatory and metabolic factors across healthy status subjects from several intervention studies is the ultimate goal of this study. As an extension of the development of the health space model by the TNO research team, this study applied the quantitative health model to intervention study data and developed inflammatory and metabolic health estimation scores. A nutritional challenge test in which participants consumed PhenFlex challenge drinks was used as a health assessment tool and to expand the sample size. However, several statistical preprocessing steps needed to be performed in accordance with a common design at three distinct time points before and after a single administration of a PhenFlex challenge. Therefore, in this study, we collected an intervention dataset measuring proteomics for the purpose of predicting inflammatory scores and performed several statistical analyses. This study illustrated that assessing the response to the challenge was more responsive compared to measuring levels of fasting markers. After training the quantitative health model using the nontreatment (placebo group) and treatment (high dose of herbal extract) reference groups, the inflammatory and metabolic health estimation indices were developed using a machine learning model, and each score was predicted. The predicted health scores were mapped onto the health space, and the resultant two-dimensional spaces were graphically represented, revealing the distinction between the two extreme groups. The two extreme groups exhibited a clear separation along the two axes of the health space. Ultimately, this investigation validated that the subjects experienced an enhancement in health when they ingested herbal extracts within the health space.
Methods
Study design
The data used in this study were combined from two human intervention studies with a PhenFlex challenge test model, and an identical design was used. The study has been described in detail previously18,19. The study consisted of single-administration, randomized, double-blind, placebo-controlled, and crossover trials. The participants in each study were randomly assigned to either the placebo or test group (Experiment 1: Angelica keiskei, AK; Experiment 2: Capsosiphon fulvescens, CF) after crossover to the other conditions for the other sessions. The participants received a standard meal on the evening before the day of the study. On the day of the visit in Experiment 1, subjects were administered either a placebo or varying doses of AK juice (150 mL or 300 mL). Similarly, in Experiment 2, subjects consumed varying doses of CF powder (0.1 g or 0.4 g) on the day of the visit.
This study was conducted in accordance with the Declaration of Helsinki, and the protocols of the individual studies were reviewed and approved by the Institutional Review Boards (IRBs) of Ewha Womans University (Approval Nos. 68-6 and 61-12). The protocols were also registered with the Clinical Research Information Service (CRIS), which is the International Clinical Trials Registry Platform of the WHO (ICTRP, No. KCT0001145 and KCT0001241).
Participants and eligibility criteria
The eligible participants in Experiment 1 were men and women aged between 20 years and 65 years with BMI > 25 kg/m2 and with a C-reactive protein (CRP) level ranging from 0.5–8.1 mg/dL. In Experiment 2, the participants were aged between 20 and 40 years and had a glucose concentration ≤100 mg/dL and a TG concentration ≤150 mg/dL. The exclusion criteria were as follows: participants who had taken medication or other dietary supplements within 4 weeks before the screening visit; had a history of conditions such as platelet dysfunction, diabetes, liver disease, kidney disease, cardiovascular disease (including hypertension and stroke), thyroid disease, or any other chronic illness that could affect the study’s outcome; smoked more than 10 cigarettes per day; exercised excessively (more than 7 h per week); consumed more than 140 grams of alcohol per week (approximately 2.5 bottles of soju per week, or about 2.5 glasses per day); experienced a weight loss of more than 4 kg within 4 weeks prior to the first visit (if undergoing a weight reduction program); were pregnant or breastfeeding; or had an aversion or intolerance to the test material or other intervention agents. Participants were recruited through poster advertisements on the website in the Republic of Korea, and all of them belonged to the Asian ethnicity. Written informed consent was obtained from all participants prior to their enrollment in the study. These subjects were included in the analysis, and a CONSORT diagram of the two studies is shown in Fig. 4.
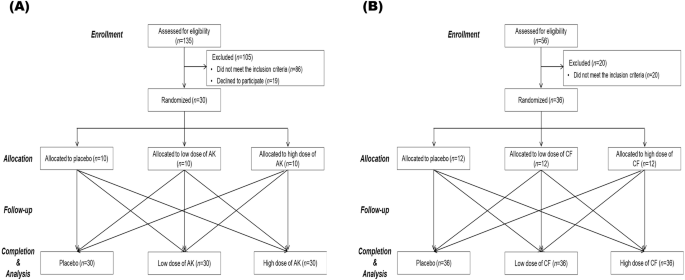
CONSORT diagram for the flow of participants through the study (A) Experiment 1 and (B) Experiment 2. This diagram provides a detailed CONSORT (Consolidated Standards of Reporting Trials) flowchart illustrating the progression of participants through each stage of the study. Enrollment, Initial number of participants assessed for eligibility; Allocation, Number of participants allocated to each study group (placebo, low-dose treatment, high-dose treatment); Follow-up, Number of participants completing each stage of the study protocol (baseline assessment, intervention phase, follow-up assessments; Competion&Analysis, Number of participants included in the final analysis after completing the study protocol.
PhenFlex challenge test
All participants were given the PhenFlex challenge in the morning after overnight fasting. Placebo or herbal extracts (Experiment 1: juice of Angelica keiskei, AK; Experiment 2: powder of Capsosiphon fulvescens, CF) were administered in the morning on the day of the experiment with a PhenFlex challenge drink within 15 min. The PhenFlex challenge drink was a 500 mL beverage consisting of 60 g palm oil, 83.5 g dextrose, 20 g Protifar® (protein powder, Nutricia, Utrecht, Netherland), and 320 mL water, providing a total of 900 kcal, with 58.9 E% from fat, 33.3 E% from carbohydrate, and 7.6 E% from protein20.
The subjects ingested the placebo or herbal extracts in combination with the PhenFlex challenge, and blood samples were drawn at 0 (fasting), 0.5, 1, 2, 4, and 6 h (after the challenge). Blood samples were collected in K2-ethylenediaminetetraacetic acid (EDTA) and SST tubes (BD Biosciences, San Jose, CA, USA), and whole blood was centrifuged at 1500 × g for 10 min at 4 °C to separate the plasma and 15 min at room temperature to obtain the serum. Plasma and serum aliquots were stored at −80 °C until analysis. During blood collection, the subjects were not permitted to eat any food and were allowed to drink only water.
Inflammatory and metabolic parameters
The concentration of the cytokine/chemokine proteome in plasma was measured using an Immunology Multiplex Assay in a 96-well plate. Multiplex beads were used to quantify the changes in postprandial inflammatory biomarkers (Milliplex MAP human cytokine/chemokine magnetic bead panel, Millipore, Darmstadt, Germany) using a Bioplex® MAGPIX™ (Bio-Rad, Hercules, CA, USA) following the kit protocols provided by Millipore. Thirty-eight cytokines (soluble CD40 ligand (sCD40L), epidermal growth factor (EGF), eotaxin, fibroblast growth factor (FGF)-2, flt-3 ligand, fractalkine, granulocyte colony-stimulating factor (G-CSF), granulocyte-macrophage (GM)-CSF, growth-regulated alpha protein (GRO), interferon (IFN)-α2, IFN-γ, interleukin (IL)-1α, IL-1β, IL-1ra, IL-2, IL-3, IL-4, IL-5, IL-6, IL-7, IL-8, IL-9, IL-10, IL-12 (p40), IL-12 (p70), IL-13, IL-15, IL-17A, IFN-γ-induced protein (IP)-10, monocyte chemoattractant protein-1 (MCP)-1, MCP-3, macrophage-derived chemokine (MDC) (monocyte chemoattractant protein-1, CCL22), macrophage protein (MIP)-1α, MIP-1β, transforming growth factor (TGF)-α, tumor necrosis factor (TNF)-α, TNF-β, and vascular endothelial growth factor (VEGF) were measured at the 0, 2, and 6 h timepoints. All of the inflammatory parameters were different from the baseline values in both experiments.
The following parameters were measured as metabolic markers: glucose, insulin, triglycerides (TGs), free fatty acids (FFAs), ApoB, high-density lipoprotein (HDL) cholesterol, low-density lipoprotein (LDL) cholesterol, oxidized low-density lipoprotein (ox-LDL), malondialdehyde (MDA), reactive oxygen species (ROS), C-reactive protein (CRP), basophils, eosinophils, lymphocytes, monocytes, and neutrophils. The baseline markers were sex, age, recommended food score (RFS), weight, and body mass index (BMI).
Statistical preprocessing of the dataset
Assessment of the data quality
Two sets of clinical data were collected from patients subjected to the PhenFlex challenge and proteomics analysis to produce a combined dataset. The data below the detection limit were replaced with the values corresponding to the limit of detection (LOD). For some of the subjects, glucose levels below the detection limits were adjusted to the detection limit values. According to a procedure referred to as the “80% rule”21, only variables that contained a nonzero measurement value in at least 80% of the variables within the datasets were included in this study.
Multiple imputations of missing values
Using the procedure mice() function in R, missing values were imputed 5 times, and 5 multiple imputed datasets were created. The function mice.impute.norm() assigns according to a linear imputation model and is fast and efficient if the model residuals are close to normal22. The Multiple Imputation by Chained Equations (MICE) method is commonly employed in practical applications, utilizing a series of equations to generate multiple imputations for variables of diverse types23.
Data distribution and transformation
The Shapiro-Wilk test was used to assess normality, and data with a p-value greater than 0.05 were considered to follow a normal distribution. The distribution of the continuous data is non-normal, skewed data were performed log transformation to make the data as normal. Data that followed a normal distribution were deemed not to require transformation. Consequently, these data were classified as “unnecessary data” and were excluded from further transformation processes. In addition, largely different means and standard deviations of variables were standardized using the scale() function in R.
Development of the model for health estimation scores according to individual health status
A schematic of all the procedures for developing the estimation score is shown in Fig. 5. Total subjects from a combined dataset were used for developing the health estimation scores for metabolism and inflammation. To begin the model development process, all datasets were divided into training and test sets (70:30). Each procedure for the selection of the training set was applied to the placebo and high-dose treatment groups, and the test set was applied to the low-dose treatment group. The training set was used to train the model for fitting, and the test set was used to evaluate the generalization error.
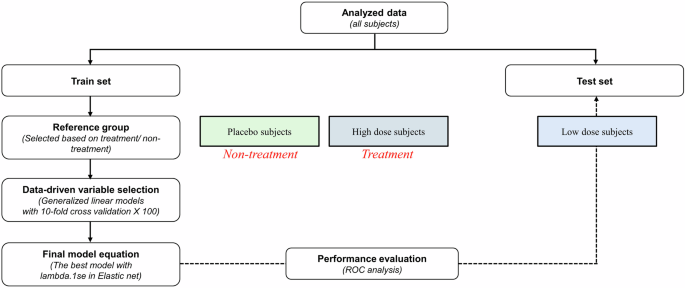
This figure presents a detailed schematic outlining the analysis pipeline used in the study. Sequential steps illustrate the flow of data from collection to final analysis and interpretation. Description of the development and selection process for analytical models, including machine learning algorithms or statistical methods utilized. Procedures employed to validate the models, including cross-validation techniques, to ensure robustness and generalizability.
Generalized linear models with a 10-fold cross-validation model were built for variable selection as part of health space modeling. A cross-validation procedure has been used for estimating the generalized performance for a smaller dataset24. Ten-fold cross-validation was executed, where 10% of the data sequentially operated as a validation set. Models were constructed using one portion of the data (90%) and evaluated on the separate section. The overall performance was computed by averaging the results across ten iterations.
(log frac{pi }{1-pi }={hat{beta }}_{0}+{hat{beta }}_{1}{mathcal{X}}_{1}+{hat{beta }}_{2}{chi}_{2}+cdots +{hat{beta }}_{n}{{mathcal{X}}_{n}}): logistic regression model
(hat{pi }=frac{exp ({hat{beta }}_{0}+{hat{beta }}_{1}{mathcal{X}})}{1+exp ({hat{beta }}_{0}+{hat{beta }}_{1}{mathcal{X}})}): fitted probability
({hat{{mathcal{Y}}}}_{{mathcal{m}}}left({hat{{mathcal{Y}}}}_{{mathcal{i}}}right)={hat{beta }}_{0}+{hat{beta }}_{1}{mathcal{X}}): fitted linear predictor score (metabolic/inflammatory).
Validation of the model for health estimation scores according to individual health status
To validate the scores and compare the fitness of the various statistical models, receiver operating characteristic (ROC) curves were generated, and the accuracy of the parameters was determined. The plot of sensitivity versus one-specificity is called the ROC curve, and the area under the curve (AUC) was calculated because the effective accuracy was measured with meaningful interpretation. This curve plays a central role in assessing the diagnostic ability of the test to distinguish the actual state of the subject, find the optimal cutoff value, and compare the two alternative diagnostic tasks when each task is performed on the same subject25. After all the data were evenly divided into two parts, one portion was used for training, and the remaining portion was used for testing and comparing the ROC curves.
Identification of health space
The placebo and high-dose groups were assigned to training sets. The placebo group was selected to define the “baseline group”, and the high-dose group was defined as “the healthy reference group”. These groups are called reference groups. The reference groups were used to create a health space model that represented both extremes of expression resilience8. Reference groups were reconstructed to define reference groups of subjects in the training dataset. This study included two reference groups: those receiving treatment (a high dose of herbal extract) and those not receiving treatment (placebo).
The overall results were visualized by plotting the health estimation scores in a 2D plot where the two processes span the axes. The placement of individuals within the health space’s healthy range relies on the regression values derived from the health space model. Given that the health space is delineated by the disparity between the two reference groups, the visualization of individuals’ health status occurs along a spectrum spanning from one reference group to the other. The axes are defined as two processes that characterize phenotypic flexibility: (1) the metabolism score and (2) the inflammation score. The first axes represented metabolic components, and the other axes exhibited inflammatory components of phenotypic flexibility.
Responses