A year above 1.5 °C signals that Earth is most probably within the 20-year period that will reach the Paris Agreement limit
Main
In 2023, global mean surface air temperature reached 1.43 °C above pre-industrial level (1.32–1.53 °C, likely range)1. This exceeded the best estimate for human-induced warming1 of 1.31 °C (1.1–1.7 °C), indicating that, among other factors, natural variability, including the imprint of an El Niño event, contributed to the observed temperature in 20232,3,4. The following year, 2024, became the warmest on record globally5,6,7, and it was announced as the first calendar year above 1.5 °C by several international organizations that independently track the global temperature5,6,8,9,10,11,12. Although some uncertainty across datasets exists7, averaged together, the data indicate a consensus that Earth’s surface air temperature reached 1.55 °C warming in 20246.
A single year above 1.5 °C, however, does not mean that the long-term temperature has reached the level referred to in the Paris Agreement, as also highlighted by the Intergovernmental Panel on Climate Change (IPCC)13. The long-term global temperature goal under the United Nations Framework Convention on Climate Change refers to human-induced climate change only14,15, and the Second Periodic Review of the long-term global goal under the Convention has clarified “that [the goal] is assessed over a period of decades”16. Different approaches have been suggested to track progress against the temperature goal13,17,18, but uncertainties in these estimates imply that we will only be able to establish in hindsight whether a certain warming level has been reached with confidence10,19.
To account for natural variability when determining human-induced global warming from the observational record, the IPCC, in its Sixth Assessment Report (AR6), assessed global warming over a 20-year period13. Furthermore, it established global warming levels as the reference point for the assessment of climate impact drivers and extensively documented the climate risks emerging at a 1.5 °C warming level13. Addressing the question of when we will enter a 20-year period with average warming at that level is thus not just an exercise of tracking the global temperature record, but also informs on the onset of a 20-year period where the risks documented in the scientific literature at a 1.5 °C warming level are expected to emerge. This is of direct relevance for climate risk management and adaptation planning.
Here, we investigate how single warm years are related to the onset of the 20-year global warming level period by combining observations and climate model simulations of the Coupled Model Intercomparison Project Phase 6 (CMIP6), focusing on models with skill in representing warming trends during 1981–201420. Specifically, we explore the question of whether a single year above 1.5 °C can be seen as an early warning of the world reaching the 1.5 °C long-term warming level.
By analysing the already-reached warming levels, observations reveal that the first single year exceeding 0.6 °C, 0.7 °C, 0.8 °C, 0.9 °C and 1.0 °C global warming thresholds have consistently fallen within the first 20-year period in which average temperature reached the same thresholds (Fig. 1a, points falling in the vertical band). This pattern motivates the hypothesis that a similar behaviour may apply to the 1.5 °C threshold. If true, the occurrence of the first single year at 1.5 °C warming would imply that the 20-year period that reaches the Paris Agreement’s lower goal has already started and that the expected impacts at a 1.5 °C warming level will start to emerge. Temperature data from climate models align well with this observed pattern, with the first single year exceeding 0.7–1.0 °C warming typically occurring within the first 20-year period reaching the same warming level (Fig. 1a, box plots). Furthermore, for all considered warming levels, the observed time lag between the first year surpassing a warming threshold (t1yr) and the time of entry in the 20-year period reaching the same threshold (t20yr), that is Δt = t1yr − t20yr, falls inside the climate model-based distribution (Fig. 1a). This underscores the skill of climate models in simulating recent global mean temperature dynamics.
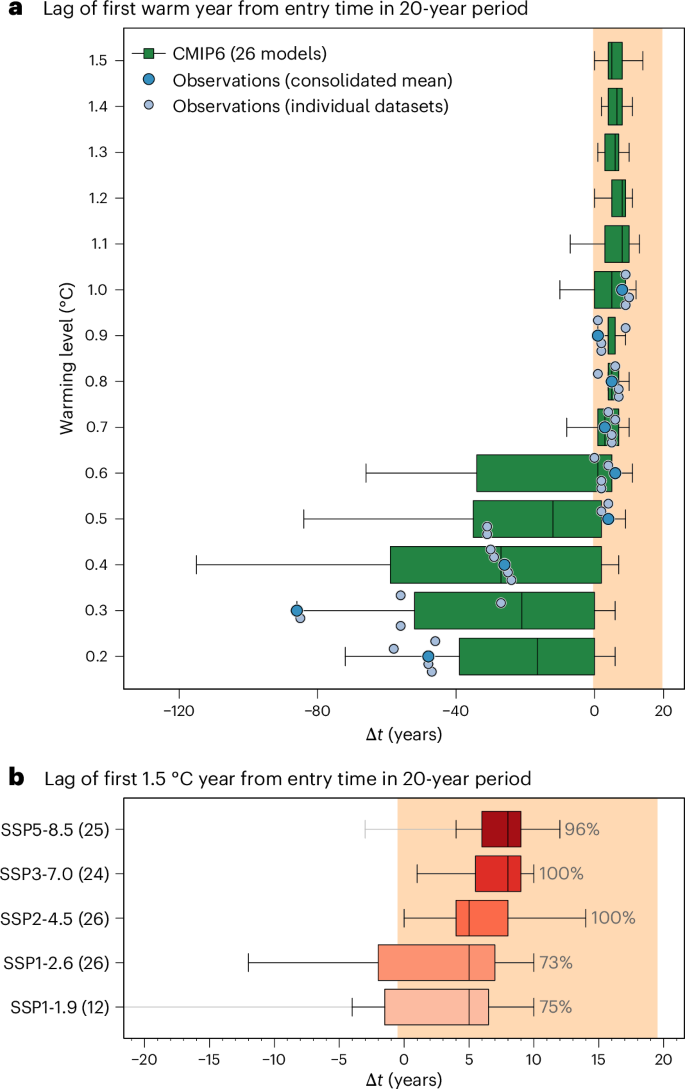
a, The time lag is denoted by Δt, with positive values implying that the first year above a warming level occurred within the 20-year period reaching the same warming level (vertical light orange band). The blue dots indicate different observational datasets. The box plots (showing median and interquartile range) are derived from models under a moderate emissions scenario SSP2-4.5 (black whiskers extend to the most extreme data points within 1.5 times the interquartile range from the box). b, The same as the box plot in a but for 1.5 °C warming under different emission scenarios (here, grey whiskers display the full range if it exceeds black whiskers). The number of models employed (those compatible with observed recent warming trends20) is shown in brackets. The fraction of simulations that fall in the shaded area is also provided.
Moving to the warming level of the Paris Agreement, climate models confirm our hypothesis; that is, the first single year at 1.5 °C global warming is likely (≥66% probability) to virtually certain (≥99%), depending on the emission scenario, to fall within the first 20-year period reaching the 1.5 °C warming level (Fig. 1b). For the Shared Socioeconomic Pathway (SSP)2-4.5 scenario, which most closely resembles current policy trends13, all models indicate that the first single year at 1.5 °C warming falls within the 20-year period. For scenarios with stringent near-term emission reductions aiming to limit peak warming closer to 1.5 °C (SSP1-1.9 and SSP1-2.6), the probability still reaches around 75%. Note that in the case of SSP1-1.9, which is designed as a low overshoot scenario that keeps 1.5 °C within reach21, a single year above 1.5 °C does not imply a very likely probability of ever reaching that warming level. We also note that our model ensemble of opportunity does not represent the actual probability distribution of warming outcomes for different emission scenarios assessed in the AR6 (ref. 22), which means that our likelihood estimates associated with various scenarios need to be interpreted with caution.
Whether the first single year at a given warming level falls into the first 20-year period that reaches the same warming level depends on the interplay between warming trends and variability in the global mean temperature time series. Generally, under small long-term trends, the first warm year often occurs due to natural temperature variability before the onset of the 20-year period with a given warming level (Fig. 2a). Conversely, under a strong warming trend, the single warm year typically falls within the 20-year warming level period (Fig. 2b). An idealized experiment (Methods) illustrates the additional role of the variability (measured as the standard deviation) of the temperature time series, with stronger trends and smaller variability increasing the probability of the warm single year falling within the 20-year warming level period (Fig. 2c, background colours). Climate model simulations under various scenarios and warming levels show the same probability pattern (Fig. 2c, colours of the symbols).
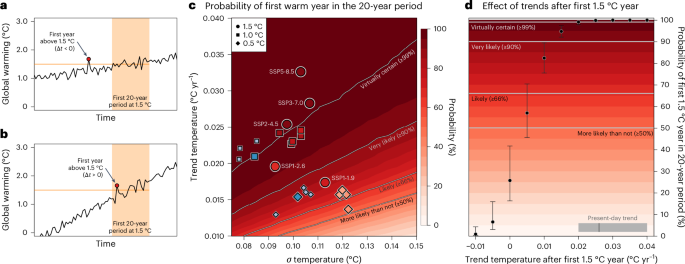
a,b, Examples of time series with weak (a) or strong (b) temperature trends, with the first single year above 1.5 °C falling outside or within the 20-year warming level period (vertical light orange band), respectively. c, The probability of the first year at or above a warming level falling within the 20-year period reaching the same level, derived from an idealized experiment for different trends (y axis) and standard deviations (x axis) of the temperature time series. Blue-filled symbols show trends and standard deviations from observational datasets during the 20-year warming level period (colours as in Fig. 1a). Red-filled symbols denote probabilities from climate models, plotted against the multimodel median of trends and standard deviations (note, the symbols for 0.5 °C in SSP1-2.6 and SSP2-4.5 overlap). d, The dots show the probability of a first 1.5 °C year falling within the 1.5 °C 20-year period as a function of the warming rate, assuming that the first 1.5 °C year is reached under the currently observed trend and standard deviation. Uncertainty ranges (vertical bars) reflect combined uncertainty in the currently observed trend (5–95th percentile range1) and standard deviation (range across observational datasets; Methods). The bottom-right bar shows the currently observed trend and its 5–95th percentile range1 (0.026 (0.02, 0.04) °C yr−1).
A continuation of the strong warming trends observed over the last decade of 0.026 (0.02, 0.04) °C yr−1 (ref. 1) would render it virtually certain that the first single year at 1.5 °C falls within the first 1.5 °C 20-year period (Fig. 2d). Owing to the dominance of short-lived climate forcers over decadal timescales22, a certain amount of future warming is locked in already. Nevertheless, stringent near-term emission reductions could still bring down warming rates substantially over the coming two decades23 and thereby lower the probability that the first single year at 1.5 °C implies that we have entered the 1.5 °C 20-year period. Assuming the first year at 1.5 °C occurs under the currently observed temperature trend and variability, our estimates suggest that lowering this probability to about 50% would require reducing temperature trends to about 0.005 °C yr−1 (Fig. 2d). This corresponds to reducing temperature trends to about 20% of the trends observed over the past decade, which can only be achieved via stringent mitigation efforts23.
On the basis of multiple observational datasets, climate model simulations and an idealized experiment, our analyses demonstrate that, unless ambitious emissions cuts are implemented, the world’s first year at 1.5 °C warming is virtually certain (~99% on average; Fig. 1b) to fall within the 20-year period that reaches the 1.5 °C warming level. The main reason for this result is the current strong warming trend, which, combined with the relatively low variability in the temperature time series, makes it very unlikely for the temperature of a single year to largely exceed the long-term average. Our idealized experiment shows that climate model-based probabilities of the first year at 1.5 °C falling within the 20-year period (Fig. 1b) might even be a conservative estimate if the standard deviation of the temperature time series in climate models is overestimated (Fig. 2c and Extended Data Fig. 1). As a caveat of the climate model-based analyses, we note that the projected forcings in the SSP scenarios start in 2015, missing some recent aspects that may affect long-term human-induced warming trends and individual warm years (see the discussion in the Methods).
The calendar year of 2024 was announced as the first above 1.5 °C warming5,6 and, therefore, it signals that most probably Earth has already entered a 20-year period at 1.5 °C warming. We want to stress that the entry time in the 20-year period at 1.5 °C warming should not be interpreted as the timing of the warming level itself, which would be placed at the midpoint of the 20 year period, 10 years after the entry time. Our findings provide an early warning for anticipating a critical warming level threshold and inform appropriate mitigation and adaptation responses. In particular, the early warning signals the occurred onset of a period where the climate impacts of a 1.5 °C warmer world may start to emerge, underscoring the urgency of adaptation action24. Our results also indicate that, by rapidly slowing down the warming rate23, stringent near-term mitigation has the potential to substantially reduce risks of exceeding the 1.5 °C warming level soon after the first single year above 1.5 °C has occurred. At the same time, only rapid near-term mitigation can effectively limit peak warming, which is required to hold warming well below 2 °C with high probability25 in case of exceedance of 1.5 °C. A year above 1.5 °C is not the time for despair, but a call to action.
Methods
Data
Building on IPCC reports22, we used the observational dataset from Forster et al.26, which includes annual (that is, for the calendar year) global mean surface temperature (GMST) anomalies relative to 1850–1900 for calendar years for the four datasets HadCRUT, NOAA, Berkeley Earth and Kadow, and the associated multidataset mean, referred to as ‘consolidated 4-set mean’.
Furthermore, we used CMIP6 climate models27, for which we concatenated historical scenario data (1850–2014) with data from different Shared Socioeconomic Pathways (SSP1-1.9, SSP1-2.6, SSP2-4.5, SSP3-7.0 and SSP5-8.5). For climate models, to estimate annual global warming relative to 1850–1900, following IPCC’s procedure and to minimize warming biases in models22, we added annual GMST changes from 1850–1900 to 1995–2014 from observations (that is, ~0.86 °C from the ‘consolidated 4-set mean’26) to model-based annual global mean surface air temperature20 (computed based on the spatially weighted average of the variable ‘tas’) change relative to 1995–2014. In addition to the ‘consolidated 4-set mean’, we used the annual GMST changes from 1850–1900 to 1995–2014 from the four individual datasets to confirm the robustness of our results to observational uncertainties (Extended Data Fig. 2). We used one ensemble member per climate model. First, for each model, we selected the r1i1p1f1 ensemble member if available with data until the year 2099 (to ensure no warming level remained unreached due to missing data); otherwise, we selected the first available ripf member in alphabetic order with data available until 2099. Secondly, building on Tokarska et al.20, we only retained selected model members with warming trends during 1981–2014 that are compatible with observations, that is, with global mean surface air temperature trend between 0.0108 and 0.0263 °C yr−1 (a ±2σ range incorporating internal variability, blending, and structural uncertainties directly derived from Tokarska et al.20; Extended Data Fig. 1c). The resulting list of models is in Extended Data Table 1. However, we also note that the selection of the model members has only a very marginal effect on the conclusion of the study (Extended Data Fig. 3).
Timing of single-year and 20-year reaches and their lag
Given a dataset or model simulation time series, we estimated the onset of (or time of entry in) the first 20-year period (t20yr) at a given warming level by selecting the first year of the first 20-year window whose average global warming is equal to or above the warming level. We obtained the timing of the first single year (t1yr) at a given warming level by selecting the first occurrence with an annual temperature anomaly equal to or above the given warming level. If a warming level is not reached for a given time series, we set t20yr and/or t1yr to infinity—note that, by construction, if the warming level is not reached in the single-year case (t1yr = Inf), then it also cannot be reached in the 20-year case (t20yr = Inf), thus the case t1yr = Inf and t20yr = Finite is not possible.
For a given warming level, we quantified the lag between t1yr and t20yr as Δt = t1yr − t20yr. The lag was defined as negative infinity if the warming level is reached only in the single-year case (Δt = Finite − Inf = −Inf; in observations, this is the case for warming levels above 1.0 °C and for the NOAA dataset at 1.0 °C; Fig. 1a). A model run or observation dataset is disregarded if the warming level is not reached both for the 20-year and single-year cases (Inf − Inf = Not a Number); however, note that, for model simulations for the 1.5 °C warming levels, none of the model runs subselected via the Tokarska et al.20 constraint were disregarded.
Building on previous work28 for climate model simulations, we computed the probability of the first single year at 1.5 °C global warming falling within the 1.5 °C 20-year period by counting the simulations in an SSP scenario of interest for which, for the 1.5 °C warming, Δt ≥ 0.
Idealized experiment
We conducted an experiment to assess how the combination of trend and standard deviation in temperature time series affects the probability that the first single year at a given warming level falls within the 20 years reaching the same level (Fig. 2c). Given a pair of trend and standard deviation values, we computed this probability by counting single years falling in 20-year periods among Nboot = 20,000 simulated time series (here, we considered a 1.5 °C warming level, but the results are independent of the considered level; for graphical purposes, we interpolated results in Fig. 2c to a finer trend–standard deviation grid than that used for the experiments). The Nboot time series, each spanning 1850–2200, were generated via a Gaussian distribution with fixed standard deviation and time-varying means reflecting the desired trend. To mimic the analysis of climate models, for each series, we estimated global warming relative to 1850–1900 by adding observed warming from 1850–1900 to 1995–2014 from the ‘consolidated 4-set mean’26 to the simulated temperature change relative to 1995–2014.
We repeated this process and calculated associated probabilities across a realistic range of trends and standard deviations (background colours in Fig. 2c) derived from pooled observations and climate model simulations. Such range was derived by analysing 20-year periods that reached a wide range of 20-year warming levels. In Fig. 2c, the coloured points show the probabilities derived from climate models for 0.5 °C, 1.0 °C and 1.5 °C warming levels and different SSP scenarios (alongside the associated multimodel median of trends (y axis) and standard deviations (x axis) simulated by models during the 20-year period that reached these warming levels). The similarity of the points’ inner colours and background colours shows the fidelity of the idealized experiments in representing the behaviour seen in climate models. Note that all trends and standard deviations associated with warming levels were obtained by analysing time series during the 20-year period that reached a 20-year warming level, specifically by first computing the trend and then the standard deviation of the detrended data (Fig. 2c and Extended Data Fig. 1).
In Fig. 2d, we explore how decreasing the observed temperature trend can reduce the probability that, once the first single year at 1.5 °C occurs, it will fall within the 1.5 °C 20-year period. In line with the temperature above 1.5 °C in 2024, we assume that the first single year at 1.5 °C is reached with the currently observed temperature trend and standard deviation. To calculate these probabilities, we followed the procedure described above, but in these simulations, we altered the trend of the time series immediately after the first single year at 1.5 °C (using a range of trend values shown on the x axis in Fig. 2d). For each of these trends, we derived uncertainties in the probability due to uncertainty in the currently observed trend (considered until the first single year at or above 1.5 °C is met) and standard deviation. Specifically, we derived uncertainties by repeating the procedure based on 3 × 3 possible trend–standard deviation combinations from the values defined below, obtaining nine probability estimates and reporting the maximum, minimum and median in Fig. 2d. We used the best estimate of the trend and its likely (5–95th percentile) range (0.026 (0.02, 0.04) °C yr−1), derived from Forster et al.1 for the period 2014–2023. We derived the standard deviation from the past 20 years of the ‘consolidated 4-set mean’26, including the range of values from all considered observational datasets (0.084 (0.081, 0.087) °C).
Discussion on recent temperature dynamics in climate models
We note that the projected forcings in the SSP scenarios start in 2015, thereby missing some aspects of more recent trends, both of anthropogenic and natural origin. This includes the effects of the COVID-19 pandemic on temperature29, warming from reduced pollution and lower-sulfur marine fuels3,30,31,32 and associated enhanced sunlight due to reduced cloud cover and surface reflectivity3,30, and emissions from large volcanic eruptions33,34. The effects of these factors on the long-term human-induced warming trend are probably minor3,30,31,33,35, and an underestimation of warming trends would even make climate model-based probabilities of the first 1.5 °C year falling in the 20-year period conservative. However, these factors may affect the occurrence of individual years above a temperature threshold, whereas our approach assumes that such occurrences are predominantly driven by natural variability superimposed on long-term trend. The fact that changes in short-lived climate forcers not represented in SSP scenarios contributed to the 2023 temperature anomaly, albeit the strength of the effect remains unclear31,36, is a caveat to our results. Yet we note that the high temperature observed in 2023/2024 is also consistent with internal variability, via a strong El Niño event following a prolonged La Niña3,4,37. Furthermore, for the scenario most closely resembling current emissions (SSP2-4.5), we find that the first year above 1.5 °C lies well within the 20 years at 1.5 °C average warming (Fig. 1b); this implies that, even if unrepresented forcing contributes to the first year at 1.5 °C, our general conclusion of the first single year at 1.5 °C most probably falling within the 20-year period reaching the Paris Agreement limit still holds.
Responses