Absence of care among community-dwelling older adults with dementia and functional limitations

Main
The World Health Organization (WHO) estimates that 16% of the global population experiences disabilities, many of whom face functional limitations that greatly impact daily activities, particularly among older adults1,2. This imposes a substantial demand for caregiving, especially in developing nations1,2. As populations age, the need for long-term care has become a pressing public health challenge, with projections indicating a quadrupling of older persons unable to care for themselves by 2050, potentially causing profound societal impacts3,4,5.
The burden of disability is especially large for people living with dementia (PLWD), who often experience severe functional limitations6,7. In 2022, more than 55 million people globally were living with dementia—a figure projected to rise to 139 million by 2050 (ref. 8). Due to prolonged illness, PLWD often endure years of disability and dependence6,7,9, with financial burden and caring costs exceeding US$1.3 trillion annually worldwide6,10. These people face markedly greater caregiving needs and healthcare costs than those with other conditions such as heart disease or cancer11,12, and many community-dwelling PLWD, particularly those living alone, encounter considerable challenges in accessing essential care services13,14,15,16,17.
Despite the critical need for caregiving, global patterns of care received by PLWD with functional limitations remain poorly understood18. Variations across time and countries further complicate generalizations of existing evidence. A lack of care can lead to avoidable hospitalization, early institutionalization, increased mortality, higher societal costs and reduced quality of life19,20,21,22. Identifying caregiving trends is essential to inform effective public policies and interventions for this vulnerable population.
This study leverages population-based longitudinal survey data from the United States (Health and Retirement Study (HRS, 2012–2018)), England (English Longitudinal Study of Ageing (ELSA, 2012–2018)), 18 European countries and Israel (Survey of Health, Ageing and Retirement in Europe (SHARE, 2013–2017)) and China (China Health and Retirement Longitudinal Study (CHARLS, 2013–2018)) to examine global trends in caregiving gaps among PLWD with functional limitations, as measured by basic activities of daily living (ADL) or instrumental activities of daily living (IADL). We hypothesized that (1) a large proportion of PLWD receive no care for their functional limitations, with little change over time; (2) PLWD with limited economic resources are less likely to receive formal care; (3) PLWD with limited access to care resources (for example, lower socioeconomic status, living alone) are more likely to report ADL or IADL limitations without receiving any care.
Results
Sample characteristics
Table 1 summarizes the sample characteristics of people with functional limitations who developed dementia (dementia sample) during the study period (see Extended Data Fig. 1 for study periods and sample selection). The average age (s.d.) ranged from 68.8 (9.1) years in CHARLS to 78.7 (9.4) years in SHARE. Sociodemographic differences were notable, with ELSA having the highest proportion of person-waves living alone (42.2%) and CHARLS the lowest (10.2%). Upper secondary education and above was most prevalent in ELSA (55.7%) and least in CHARLS (5.5%).
The extent of ADL and/or IADL limitations and absence of care varied across countries/regions but followed common patterns. On average, respondents reported 3.3–4.0 ADL and/or IADL limitations, with limitations increasing over time (Table 1 and Extended Data Fig. 2). Significant increases were observed across most countries and regions.
The prevalence of receiving no care for ADL and/or IADL limitations was high, ranging from 21.4% in the HRS to 32.7% in CHARLS. The absence of care was more pronounced for ADLs than for IADLs. Notably, 48.5% of person-waves in ELSA and 63.1% in CHARLS received no care at all for ADLs. Similarly, more than a third of HRS (39.0%) and SHARE (38.4%) reported receiving no care for ADLs. When examining the types of care, the prevalence of receiving no formal care for ADL and/or IADL limitations was notably higher, ranging from 58.5% in SHARE to 99.1% in CHARLS, compared with no informal care, which ranged from 24.1% in HRS to 33.7% in CHARLS. The patterns were consistent across ADLs and IADLs (Table 1).
Trends in the absence of care
Figure 1 shows the proportion of the sample who received no care for their ADL and/or IADL limitations over time estimated using the generalized estimating equations (GEE) model, stratified by country/region, type of limitation and care type. Overall, these proportions remained stable, with at least 20% of PLWD receiving no care at all for their ADL and/or IADL limitations (Fig. 1a). Care gaps were more pronounced for ADLs, with 35–67% of the sample receiving no care (Fig. 1d) compared with 8–23% for IADLs (Fig. 1g).

a, Care absence for ADL and/or IADL limitations (HRS, n = 2,704; ELSA, n = 1,035; SHARE, NA; CHARLS, n = 2,037). b, Absence of informal care for ADL and/or IADL limitations (HRS, n = 2,694; ELSA, n = 1,012; SHARE, NA; CHARLS, n = 2,037). c, Absence of formal care for ADL and/or IADL limitations (HRS, n = 2,686; ELSA, n = 1,011; SHARE, n = 5,120; CHARLS, n = 2,037). d, Care absence for ADL limitations (HRS, n = 2,027; ELSA, n = 865; SHARE, n = 1,843; CHARLS, n = 1,273). e, Absence of informal care for ADL limitations (HRS, n = 2,021; ELSA, n = 865; SHARE, n = 1,845; CHARLS, n = 338). f, Absence of formal care for ADL limitations (HRS, n = 2,004; ELSA, n = 865; SHARE, n = 3,759; CHARLS, n = 338). g, Care absence for IADL limitations (HRS, n = 2,190; ELSA, n = 656; SHARE, NA; CHARLS, n = 1,686). h, Absence of informal care for IADL limitations (HRS, n = 2,177; ELSA, n = 639; SHARE, NA; CHARLS, n = 501). i, Absence of formal care for IADL limitations (HRS, n = 2,177; ELSA, n = 638; SHARE, n = 3,876; CHARLS, n = 501). In a–i, data are presented as adjusted means ± 95% confidence intervals (CIs). Datapoints represent the estimated proportion of people receiving no care (a,d,g), no informal care (b,e,h) and no formal care (c,f,i) at each wave, as estimated using the GEE model among the dementia sample. Error bars, 95% CIs. Estimates for certain waves in SHARE and CHARLS are unavailable due to lack of data (details provided in Supplementary Table 5). Corrections for multiplicity were not made. a–c include samples with at least one ADL or IADL limitation, d–f with at least one ADL limitation and g–i with at least one IADL limitation. AAPC estimates derived from the GEE model are shown on the right of each panel. Asterisks denote the significance of the AAPC (time trend): ***P < 0.001, **P < 0.01, *P < 0.05. NA, estimates not available. Two-sided tests were performed using the GEE model, with detailed test statistics and P values provided in the Source Data.
Source data
The absence of formal care was consistently higher than informal care (Fig. 1b versus c, e versus f and h versus i). Around 24–35% of PLWD received no informal care for their ADL and/or IADL limitations (Fig. 1b), whereas the proportion receiving no formal care ranged from 58% in SHARE to nearly 100% in CHARLS (Fig. 1c). Across all four countries/regions, these proportions showed minimal change over time. Sensitivity analyses confirmed the robustness of these findings (Extended Data Figs. 3 and 4).
Among PLWD with more severe functional limitations (two or more ADLs or IADLs), the absence of care remained substantial, with no improvement over time (Extended Data Fig. 5). Between 10% and 21% received no care for their functional limitations (Extended Data Fig. 5a), and 20–53% received no care for ADLs (Extended Data Fig. 5d), indicating slightly better but still inadequate care for this subgroup.
Absence of care by education and living arrangement
Further analyses using GEE models revealed significant disparities in care based on education (less versus more educated) and living arrangement (living alone versus not living alone). Figure 2 illustrates that less educated people were more likely to lack formal care compared with their more educated counterparts, with differences ranging from 1–2% in CHARLS to 16–18% in SHARE (Fig. 2c,f,i). Differences in informal care were less pronounced, although in ELSA, less educated people were slightly less likely to lack informal care (Fig. 2b,e,h). Overall, care gaps were more severe among less educated people in CHARLS for ADL limitations but similar across education groups in HRS and SHARE (Fig. 2a,d,g).
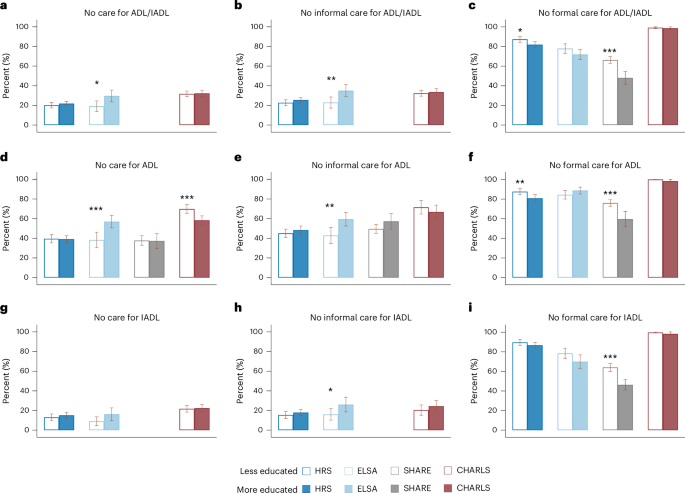
a, Care absence for ADL and/or IADL limitations (HRS, n = 2,692; ELSA, n = 944; SHARE, NA; CHARLS, n = 2,037). b, Absence of informal care for ADL and/or IADL limitations (HRS, n = 2,682; ELSA, n = 923; SHARE, NA; CHARLS, n = 2,037). c, Absence of formal care for ADL and/or IADL limitations (HRS, n = 2,674; ELSA, n = 922; SHARE, n = 5,120; CHARLS, n = 2,037). d, Care absence for ADL limitations (HRS, n = 2,023; ELSA, n = 791; SHARE, n = 1,843; CHARLS, n = 1,273). e, Absence of informal care for ADL limitations (HRS, n = 2,017; ELSA, n = 791; SHARE, n = 1,845; CHARLS, n = 338). f, Absence of formal care for ADL limitations (HRS, n = 2,000; ELSA, n = 791; SHARE, n = 3,759; CHARLS, n = 338). g, Care absence for IADL limitations (HRS, n = 2,181; ELSA, n = 597; SHARE, NA; CHARLS, n = 1,686). h, Absence of informal care for IADL limitations (HRS, n = 2,168; ELSA, n = 582; SHARE, NA; CHARLS, n = 501). i, Absence of formal care for IADL limitations (HRS, n = 2,168; ELSA, n = 581; SHARE, n = 3,876; CHARLS, n = 501). In a–i, data are presented as adjusted means ± 95% CIs. Vertical bars represent the estimated proportion of people receiving no care (a,d,g), no informal care (b,e,h) and no formal care (c,f,i) for people who were less educated versus those who were more educated, as estimated using the GEE model among the dementia sample. Error bars, 95% CIs. Participants were classified as ‘more educated’ if their years of education were above median, and ‘less educated’ otherwise. Estimates for certain measures in SHARE and CHARLS are unavailable due to lack of data (details provided in Supplementary Table 5). Corrections for multiplicity were not made. a–c include samples with at least one ADL or IADL limitation, d–f with at least one ADL limitation and g–i with at least one IADL limitation. Asterisks above each bar denote the significance of the group differences by education, directly tested in the GEE model: ***P < 0.001, **P < 0.01, *P < 0.05. Two-sided tests were performed, with detailed test statistics and P values provided in the Source Data.
Source data
Figure 3 shows that people living alone experienced significantly larger gaps in informal care compared with those living with others, with differences ranging from 4% to 29% (Fig. 3b,e,h). Although the absence of formal care was generally lower among those living alone, particularly in HRS, ELSA and SHARE (Fig. 3c,f,i), the overall absence of care for ADL and/or IADL limitations was still higher in this group (Fig. 3a,d,g). These patterns were consistent across both ADL and IADL limitations, with notable gaps in HRS, ELSA and CHARLS, where the overall care gap reached as high as 22% (Fig. 3a,d,g).
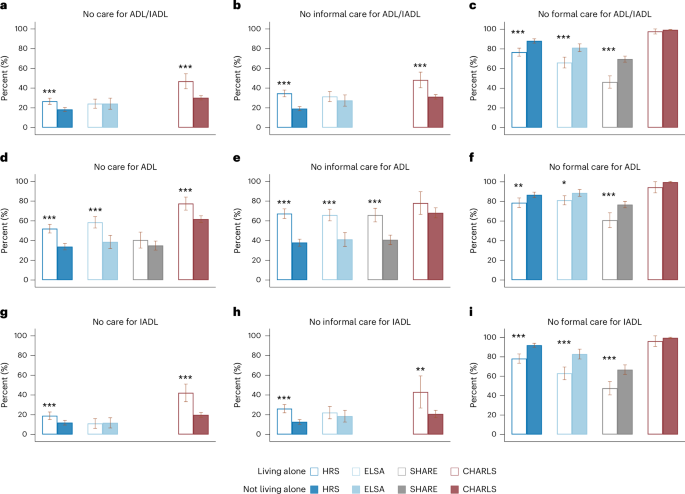
a, Care absence for ADL and/or IADL limitations (HRS, n = 2,704; ELSA, n = 1,035; SHARE, NA; CHARLS, n = 2,037). b, Absence of informal care for ADL and/or IADL limitations (HRS, n = 2,694; ELSA, n = 1,012; SHARE, NA; CHARLS, n = 2,037). c, Absence of formal care for ADL and/or IADL limitations (HRS, n = 2,686; ELSA, n = 1,011; SHARE, n = 5,120; CHARLS, n = 2,037). d, Care absence for ADL limitations (HRS, n = 2,027; ELSA, n = 865; SHARE, n = 1,843; CHARLS, n = 1,273). e, Absence of informal care for ADL limitations (HRS, n = 2,021; ELSA, n = 865; SHARE, n = 1,845; CHARLS, n = 338). f, Absence of formal care for ADL limitations (HRS, n = 2,004; ELSA, n = 865; SHARE, n = 3,759; CHARLS, n = 338). g, Care absence for IADL limitations (HRS, n = 2,190; ELSA, n = 656; SHARE, NA; CHARLS, n = 1,686). h, Absence of informal care for IADL limitations (HRS, n = 2,177; ELSA, n = 639; SHARE, NA; CHARLS, n = 501). i, Absence of formal care for IADL limitations (HRS, n = 2,177; ELSA, n = 638; SHARE, n = 3,876; CHARLS, n = 501). In a–i, data are presented as adjusted means ± 95% CIs. Vertical bars represent the estimated proportion of people receiving no care (a,d,g), no informal care (b,e,h) and no formal care (c,f,i) for people who were ‘living alone’ versus those who were ‘not living alone’, as estimated using the GEE model among the dementia sample. Error bars, 95% CIs. Estimates for certain measures in SHARE and CHARLS are unavailable due to lack of data (details provided in Supplementary Table 5). Corrections for multiplicity were not made. a–c include samples with at least one ADL or IADL limitation, d–f with at least one ADL limitation and g–i with at least one IADL limitation. Asterisks above each bar denote the significance of the group differences by living arrangement, directly tested in the GEE model: ***P < 0.001, **P < 0.01, *P < 0.05. Two-sided tests were performed, with detailed test statistics and P values provided in the Source Data.
Source data
Exploratory analysis of functional limitation and care patterns among non-dementia sample
Finally, we conducted analyses on people with functional limitations who never developed dementia (non-dementia sample) to compare them with the dementia sample. The two groups differ markedly in sociodemographic characteristics, functional limitations, care burden and the absence of care. The non-dementia sample was generally younger, less likely to live alone and had higher levels of education compared with the dementia sample (Supplementary Table 1). They reported fewer ADL and/or IADL limitations, and the increase in functional limitations over time was relatively modest (Extended Data Fig. 6).
Consistent with our main findings, the absence of care over time showed no improvement for the non-dementia sample (Extended Data Fig. 7). Approximately 40% of this group received no care for their ADL and/or IADL limitations, despite having fewer limitations than the dementia sample. The care gap was particularly pronounced for ADLs compared with IADLs, and for formal care compared with informal care.
Discussion
Using harmonized longitudinal survey data from the United States (HRS), England (ELSA), European countries and Israel (SHARE), and China (CHARLS), we provide comparative evidence on global trends in the absence of care for PLWD with functional limitations. Our findings highlight two critical issues: first, at least one in five PLWD across both developing and developed countries received no care for their ADL and/or IADL limitations; and second, this absence of care has not improved over time. This pattern is consistent across ADL and IADL limitations, and applies to both informal and formal care. Alarmingly, at least two in five PLWD received no informal care for their ADL limitations, and at least three in five (nearly 100% in China) received no formal care. These findings underscore a substantial gap in care provision for vulnerable populations worldwide, particularly for PLWD who are less educated or live alone.
The persistent caregiving gap for PLWD with functional limitations is particularly concerning, given the increase of ADL and/or IADL limitations in this population. The lack of care is linked to adverse outcomes such as anxiety, depression, increased emergency room visits, hospitalizations, nursing home admissions and even premature death23,24,25. PLWD are especially dependent on caregivers due to their heightened care needs, making them highly vulnerable to these negative outcomes when care is absent26. Notably, even among PLWD with several ADL and/or IADL limitations and more severe care needs, a substantial caregiving gap persists, with no evidence of improvement over time. The growing trend in functional limitations, paired with stagnant caregiving availability and resources, underscores the urgent need to address these gaps.
Our findings also reveal a greater absence of formal care compared with informal care for PLWD across countries and regions. Whereas informal care remains the primary source of support and is often viewed as a substitute for formal care, the need for professional services is critical. Paid caregivers and institutional care can address the complex medical and support needs of PLWD while reducing the caregiving burden on families. A balanced integration of formal and informal care is essential to improving health outcomes for both PLWD and their caregivers, highlighting the importance of expanding access to professional care services27,28,29.
However, without sufficient public support, the cost of formal care often exceeds the financial means of older adults. Public spending on long-term care (LTC) varies widely across countries, with China having the lowest share, followed by the United States and England, whereas most European countries allocate a higher proportion to LTC30. In the United States, most homecare is informal, provided by families and friends. Medicare covers only short-term, medically necessary home-based services, whereas Medicaid provides home healthcare to a limited, low-income, and vulnerable population31. In contrast, England and some European countries have adopted innovative care models that shift from nursing homes to a home-based approaches27. For example, England’s ‘extra care housing’ offers 24-h support and communal spaces, combining nursing home-level care with the comfort of living at home27. These models aim to make formal care more accessible and improve quality of life for PLWD. However, our findings indicate that the formal care gaps have not improved significantly in England or other European countries studied. Future research is needed to investigate these gaps and assess the effectiveness of home-based care models in addressing the needs of PLWD.
Our findings suggest that LTC systems in both developing and developed countries lack the capacity to meet the care needs of vulnerable populations, particularly PLWD. However, cross-national and regional comparisons should be interpreted cautiously, as care gaps are influenced by factors such as population aging, chronic disease burden, geographical proximity of caregivers, familial structures, cultural stigma and variations in social cohesion18,32,33,34. Country-specific policies also play a crucial role in shaping the accessibility, affordability and quality of formal care.
In the United States, Medicare covers healthcare for older adults, but LTC insurance remains limited, leaving many PLWD with unmet needs35. Workforce shortages in nursing homes, home health and personal care services exacerbate the issue, and the absence of nationwide paid leave policies further adds to the burden on working caregivers31. In England and other European countries, broader public LTC services exist but still fail to provide adequate specialized care for PLWD36. England, for example, has a higher proportion of absent formal care compared with other European nations, due partly to its reliance on informal care in planning formal services. By contrast, countries like France implement ‘carer blind’ assessments, which focus solely on formal care needs, independent of available informal support30,37,38.
In China, formal care gaps are particularly severe, with nearly 100% lacking access to formal care. This reflects the early-stage development of China’s LTC system, which faces challenges such as facility shortages, workforce deficits, limited public funding and deeply rooted cultural norms like filial piety39. Many adult children hesitate to use professional LTC services due to social stigma, which further suppresses demand for formal care and hinders its development40. Although pilot LTC programs launched in 2016 and the recent emergence of community elderly day care centers offer some promises, these developments remain insufficient, compounded by a lack of policies addressing the specific needs of PLWD, such as financial support and dementia-specific care41,42. Traditional preferences for aging in place and affordability concerns exacerbate these challenges, whereas the provision of some LTC services in hospitals may inflate the observed care gap43. Further research should explore how innovative models, such as community day care centers, can help close this gap and better meet the growing needs of PLWD.
Our study highlights a greater absence of care for ADLs compared with IADLs among PLWD, aligning with previous findings from older populations in countries like the United States, England and China44,45,46. Caregivers often face considerable challenges in providing personal and mobility-related care (ADLs), which requires intensive physical and emotional effort41,46. To address this, policy interventions and public programs, such as workforce training and caregiver support initiatives, should prioritize resources to help caregivers meet the basic care needs of PLWD.
Our findings reveal that PLWD with lower educational attainment face greater gaps in formal care, whereas those living alone experience larger deficits in informal and overall care. These people probably have the highest care needs47,48, but are also the least equipped to afford the necessary support. Policymakers should prioritize closing these care gaps by expanding access to LTC services, increasing affordable care options and enabling PLWD to make informed care decisions. Addressing these disparities is critical to ensuring equitable and adequate care for the most vulnerable populations.
Contributions
This study advances the literature on caregiving for PLWD by offering a comprehensive, comparative analysis across several national contexts. Unlike previous research, which often focuses on individual countries or general caregiving practices, our work emphasizes the global nature of care deficits faced by PLWD. We identify common patterns in care absence by types of care, functional limitations and sociodemographic status. Additionally, our country-specific analyses shed light on diverse strategies and outcomes, highlighting opportunities for cross-national learning and policy innovation to address care gaps and improve outcomes.
Limitations
A key limitation of the study is the use of a relatively low threshold for defining caregiving needs, defined as ‘any’ difficulty with ADL or IADL. Although the number of limitations serves as a proxy for need, it may not fully capture the severity of these difficulties, raising questions about whether the observed care gaps reflect real unmet needs or cases where caregiving is less critical. Nevertheless, the consistency of caregiving challenges and disparities across countries and regions suggests that these gaps are persistent, regardless of how the need is defined or interpreted. Future research should adopt more nuanced measures of difficulty severity to better distinguish actual unmet needs from situations where caregiving might not be necessary.
Additional limitations include reliance on self-reported and proxy-reported measures of ADL and IADL limitations, which may introduce reporting inaccuracies regarding the extent of difficulties and support received. Identifying PLWD using cognitive scales rather than clinicians’ diagnoses may have led to misclassification, although sensitivity analyses confirmed the robustness of our findings. Furthermore, by focusing on community-dwelling older adults, we excluded individuals in institutional care, such as nursing homes, limiting insights into care transitions. Finally, this study did not evaluate the quality of care or individual satisfaction, critical aspects for future research to explore through more comprehensive data collection.
Conclusions
This study provides comparable evidence showing that a substantial proportion of PLWD with functional limitations receive no formal or informal care, with these gaps persisting over time across both developing and developed countries. Formal care is particularly scarce compared with informal care, and gaps are more pronounced for ADLs than for IADLs. We also observed disparities in care absence by educational attainment and living arrangement, with those less educated or living alone facing the greatest gaps. These patterns are consistent across countries and regions studied, underscoring an urgent need for comprehensive policy and practice reforms. Closing these gaps requires substantial investments in care systems, alongside targeted LTC resources for socioeconomically disadvantaged populations. Policymakers should prioritize innovative, cost-effective and context-specific care models that can be scaled to meet the growing demand. Addressing these gaps is imperative to improve the wellbeing of this vulnerable population and ensure equitable access to essential caregiving resources.
Methods
Study design and participants
We used data from four HRS family longitudinal studies, which collected harmonized sociodemographic, economic, health and cognition data for community-dwelling adults from more than 30 countries. The studies included HRS in the United States49; ELSA50; SHARE, which encompasses 28 countries51; and CHARLS52.
The four studies have been designed with similar protocols and frameworks to facilitate cross-national comparisons, which encompass both developed and developing countries. Specifically, the HRS is a nationally representative longitudinal survey of Americans aged 50 years and older, conducted biannually since 1992 with approximately 20,000 respondents per wave49,53. The ELSA includes a nationally representative sample of adults aged 50 years and older in England, with biannual rounds since 2002 with around 10,000 participants per wave50,54. SHARE surveys European adults aged 50 years and older, starting biannually since 2004, initially covering 10 European countries with subsequent expansion to 28 countries (including 27 European countries and Israel) in 2017. The SHARE sample size has exceeded 65,000 since 2013 (ref. 51). Finally, CHARLS is a nationally representative longitudinal survey of about 19,000 Chinese adults aged 45 years and older, initiated in 2011 (refs. 52,55). In all these surveys, participants completed a standardized questionnaire administered either face-to-face or via the internet/telephone. Further details on the sampling and study protocols can be found in the respective sources49,50,51,52,53,54,55.
We constructed variables using harmonized HRS family study data adapted from the RAND HRS and Gateway to Global Aging56,57. These publicly available data sources were harmonized to enhance comparability across the studies. Because only deidentified data were used, our study was deemed exempt from review by the institutional review board at Yale University. Participants in the original studies gave informed consent, and each study was approved by a relevant ethics body49,50,51,52,53,54,55.
Extended Data Fig. 1 shows the sample selection process and final sample sizes. To ensure temporal comparability of measures across surveys, our analysis focused on data from the following sources: HRS (waves 11–14, 2012–2018), ELSA (waves 6–9, 2012–2018), SHARE (waves 5–7, 2013–2017) and CHARLS (waves 2–4, 2013–2018). For each of the four studies, we restricted our samples in each wave to participants aged 50 years and older who reported functional limitations. From this group, we excluded participants who had no valid dementia assessment during the study period. The remaining participants included those who developed dementia (referred to as the dementia sample) and those who never developed dementia (referred to as the non-dementia sample) during the study period. The dementia samples were the primary focus of our analysis, covering the period from 2012 to 2018 and included participants aged 50 years and over, with 1,203 persons (2,717 person-waves) from HRS, 472 persons (1,125 person-waves) from ELSA, 3,041 persons (5,128 person-waves) from SHARE (covering 19 countries; see Supplementary Table 2) and 1,041 persons (2,067 person-waves) from CHARLS. The non-dementia samples were used only for the exploratory analysis.
Dementia assessment
Dementia status was assessed in participants with functional limitations using validated criteria specific to each HRS family study58,59,60,61. For HRS, we employed a well-established algorithm, classifying participants as PLWD if their 27-point cognition summary score was 6 or lower58,59. The 27-point cognition scale comprises three cognitive tests: immediate and delayed word recall tests to measure memory (0–20 points), serial sevens subtraction test for working memory (0–5 points) and counting backwards test for speed of mental processing (0–2 points).
For ELSA, SHARE and CHARLS, an alternative algorithm was used as previously described60,61. Participants with functional limitations were classified as PLWD if their cognition summary scores were 1.5 s.d. below the mean of the population stratified by education levels60,61. As backward counting was not assessed, we used a 25-point cognition scale with the same word recall tests (0–20 points) and serial sevens test (0–5 points) as in HRS. Given the differences in cognitive scales and algorithms between HRS and the other three studies, we performed sensitivity analyses where participants’ cognitive status was evaluated using the same 25-score scale and defined based on the 1.5 s.d. threshold.
For each study, dementia status was assigned in each wave, and participants were classified based on whether they developed dementia during the study period. Proxy assessment of cognition was not considered to ensure comparability across four studies.
Functional limitations and absence of care
Functional limitations were assessed using ADLs and IADLs. The ADLs included six items: dressing, walking across a room, bathing, eating, getting in and out of bed, and toileting, and the IADLs included five items: preparing hot meals, shopping for groceries, making phone calls, taking medications and managing money14,18. ADL and IADL items were assessed similarly in the HRS family studies. The participants were asked whether they had any difficulty with each ADL and IADL because of a health or memory problem or not. This resulted in 11 binary indicators of limitations, one for each ADL and IADL, reflecting different aspects or domains of functional limitations. In this study, we measured the extent of functional limitations by the number of ADL and IADL limitations (sum scores of ADLs and IADLs, range 0–11), ADL limitations (sum scores of ADLs, range 0–6) and IADL limitations (sum scores of ADLs, range 0–5). Definitions and measurements across studies are presented in Supplementary Table 3.
Participants who reported limitations were asked whether they received any care for these activities, with separate questions for ADLs, IADLs and the types of care received (formal versus informal care). To assess the absence of care for functional limitations, we constructed binary variables to indicate whether participants received no care at all for their reported ADL limitations (0/1), IADL limitations (0/1) and either ADL or IADL (0/1) limitations. In other words, the absence of care (for ADLs) meant that the participant did not receive any care for any of their reported (ADL) limitations. Additionally, for each type of functional limitation, we differentiated between formal care and informal care. Therefore, the absence of care was defined respectively for ADLs (including three binary variables: no care, no informal care, no formal care), IADLs (three binary variables) and for ADLs and/or IADLs altogether (three binary variables). Survey questions and their similarities and differences across studies are presented in Supplementary Table 4, and availability of data and variables are provided in Supplementary Table 5.
Statistics and reproducibility
Main analyses
The primary analyses focused on the dementia sample, examining their functional limitations and absence of care. Descriptive statistics of the sociodemographic characteristics, ADL and/or IADL limitations and care received were estimated for each study using pooled person-wave data. Categorical variables were reported as numbers and percentages, whereas continuous/count variables were reported as means and s.d. Missing data for the dementia sample were minimal as shown in Supplementary Table 6.
We used GEE models to estimate wave-specific proportions of absence of care for each study, accounting for within-person correlation over the follow-up period. Each GEE model employed a binomial family with a logit link and specified an exchangeable correlation structure, which fit the data better than other correlation structures, such as first-order autoregressive (AR-1) and unstructured62,63. Supplementary Table 7 provides the estimated correlation (ρ) between pairs of observations for each outcome with more details about correlation structure in the footnotes. Survey weights for the study period (2012–2018) were applied in all analyses to account for sampling design and study attrition.
Interview year was the main independent variable to model trends over time, adjusting for age, sex and the number of ADLs and IADLs. To obtain wave-specific estimates of prevalence for the absence of care, interview years were specified as indicator variables, and predictive margins were used to obtain the adjusted average levels of the absence of care for each year64. The adjusted annual percent change (AAPC) in binary outcomes over time was then modeled with the interview year as a continuous variable. The AAPC was calculated using the formula (ORy − 1) × 100%, where ORy represents the yearly odds ratio65.
We further introduced indicator variables for educational attainment (less versus more educated, stratified by median levels of education) and current-wave living arrangement (living alone versus not living alone), respectively, into the GEE model to examine group differences in the absence of care, while also accounting for covariates and within-person correlation. The statistical significance of each group difference was tested directly in the models and predictive margins were applied subsequently to obtain the adjusted average values for each subgroup.
Sensitivity and additional analyses
To ensure the robustness of our results regarding dementia assessment and sample selection, we conducted two sets of sensitivity analyses for the dementia sample. First, as the cognitive scale and dementia classification algorithm in HRS differed from those in the other three studies, we applied the same 25-point cognitive scales and classification algorithms (1.5 s.d. threshold) used in the other studies to HRS. This ensured consistency in dementia assessment across all studies. Second, to account for potential variations in the timing of dementia onset, we restricted our sample to include only person-waves from the first occurrence of dementia onward.
To further evaluate care burden, we analyzed trends in the number of ADL and/or IADL limitations among the dementia sample. Specifically, we employed GEE models with a Gaussian family and an identity link to estimate wave-specific numbers of ADL and/or IADL limitations over the follow-up period, adjusting for age and sex. The adjusted annual change was estimated using the coefficient of the interview year.
Additionally, to assess differences in the absence of care among people with more severe functional limitations, we repeated our primary analysis using GEE models with a logit link to estimate trends in care absence within the dementia sample with multiple limitations. Specifically, severe functional limitations were defined using the median as a cutoff, identifying people who had difficulty in two or more ADLs (for ADL care provisions), two or more IADLs (for IADL care provisions) and either two or more ADLs or two or more IADLs (for combined ADL and/or IADL care provisions).
Exploratory analyses on non-dementia sample
To determine how the results of the dementia sample differed from the non-dementia sample, we repeated our key analyses for the non-dementia sample. Specifically, we used the same approach to estimate (1) descriptive statistics, (2) trends in the absence of care and (3) trends in the number of functional limitations for the non-dementia sample.
All analyses were conducted using STATA (v.17.0), with two-sided statistical tests and an alpha level of 0.05 for determining statistical significance. Robust standard errors were estimated. The study adhered to the Strengthening the Reporting of Observational Studies in Epidemiology reporting guidelines.
Reporting summary
Further information on research design is available in the Nature Portfolio Reporting Summary linked to this article.
Responses