Absence of magnetic order in RuO2: insights from μSR spectroscopy and neutron diffraction
Introduction
Altermagnetism, a magnetic state of matter that shares properties with both conventional ferro- and antiferromagnets1,2, has recently garnered considerable attention. While altermagnets exhibit the typical ferromagnetic signature of spin split energy bands, they still retain the zero net magnetization that is characteristic of an antiferromagnet3. Since one of the first articles on the subject4, a number of theoretical and experimental studies aimed at exploring fingerprints of altermagnetism have been conducted5,6,7,8,9,10,11,12,13, but a definitive reproducible experimental detection of the altermagnetic state remains elusive. A plurality of experiments, in particular, have been performed on the metallic rutile oxide RuO26,8,13,14,15,16,17,18,19, where both resonant X-ray scattering20 and neutron diffraction experiments21 reported a q = 0 antiferromagnetic pattern that is consistent with altermagnetic symmetry constraints. Nonetheless, in the earlier neutron report21, two caveats were noted: firstly, polarized neutron diffraction refinement resulted in an ordered moment of approximately ~0.05 μB/Ru. This value is at least one order of magnitude smaller than the numbers used to interpret subsequent experiments6,8, but still two orders of magnitude larger than what was found recently by the muon spin relaxation/rotation (μSR) technique on RuO2 single crystals18.
Secondly, electronic structure calculations in the framework of density functional theory (DFT) converge, without additional nudging, to a nonmagnetic solution15,21,22. Only the addition of a sizable Hubbard U – somewhat uncommon for good 4d metals – can generate ordered magnetic moments. In this context, it has been suggested that the presence of Ru vacancies may lead to magnetism at a lower and more realistic Hubbard U22 than that used in refs. 4,23.
In view of the popularity and conceptual importance of RuO2 as a prototypical altermagnet, it is essential to verify the existence and strength of the magnetic order in this compound. We thus have revisited the question about ordered moments in RuO2 and performed careful neutron diffraction experiments employing state-of-the art time-of-flight detection. Surprisingly, we found that the previously reported and alleged magnetic (1,0,0) reflection21 is likely related to a multiple scattering artifact rather than to a magnetic origin. Further, we employed the highly sensitive μSR technique, complemented by DFT calculations of the muon stopping sites and hyperfine fields, and determined an upper bound on magnetic moments of 1.14 × 10⁻⁴ μB/Ru in the bulk and 7.5 × 10⁻⁴ μB/Ru in 11 nm epitaxial thin films of RuO2, consistent with a recent bulk value obtained by an independent group18.
These moments are two orders of magnitude smaller than what was reported by the previous neutron study21, and essentially reflect the detection limit of the utilized spectrometer. Hyperfine field calculations in stoichiometric and Ru vacant RuO2 further exclude any fortuitous cancellation of hyperfine fields at the muon stopping site. We thus conclude that RuO2 exhibits no long-range magnetic order, neither in the bulk nor in epitaxial thin films, and the altermagnetic signatures reported in multiple earlier publications6,8,11,13,16,17 likely have extrinsic origin.
Experimental results
RuO2 samples
To shed light on the magnetic properties of RuO2, we investigated three different types of samples: (i) Millimeter sized RuO2 crystals that were grown by chemical vapor transport at the Crystal Growth Facility of the EPFL in Lausanne, Switzerland, following a recipe described in refs. 24,25; (ii) 11 nm thick RuO2 epitaxial thin films grown on TiO2(110) by pulsed laser deposition at the Institute of Physics, Würzburg, Germany, following our recipe developed in refs. 8,26; and (iii) 99.9% pure (trace metals basis) RuO2 powder purchased from Sigma-Aldrich that was measured without further preparation steps. The structural and stoichiometric integrity of all three RuO2 samples was verified by x-ray diffraction and x-ray photoelectron spectroscopy (see Supplementary Information).
Neutron diffraction results
Reassessing the results of the earlier study21, we first performed single crystal neutron diffraction on the RuO2 crystals. As discussed above, altermagnetism in RuO2 implies a q = 0 propagation vector and antiparallel magnetic coupling of the two Ru sites in the primitive unit cell, with moments polarized along the crystal c-axis. The structure is expected to result in a strong magnetic scattering to the structurally forbidden (1, 0, 0) reflection21. This is due to the fact that the two magnetic sites are summed over in the corresponding structure factor and the moments are perpendicular to the scattering vector.
In addition, among all possible magnetic reflections with q = 0, the (1, 0, 0) one has the largest d-spacing and therefore the largest value of the magnetic form factor. A model of lower symmetry, where the Neel vector departs from the c-axis, has been discussed in ref. 27. Despite of the general direction of the magnetic dipoles, the model still predicts the (1, 0, 0) to be the strongest magnetic reflection. We thus focused our attention at the (1, 0, 0) reflection and measured it at different scattering angles 2Θ, thereby using different neutron wavelengths λ, and found a strong dependence on the scattering geometry. At some scattering angles, the reflection was not observed even after ten hours of statistics, in spite of a good optimization with respect of the neutron flux, whereas at some other angles (mainly low angles) it was detectable within a few minutes with a poorer flux optimization (Fig. 1). This behavior is not typical for a real Bragg peak and is known as Renninger effect28,29,30, caused by multiple scattering processes (often referred to as double scattering).
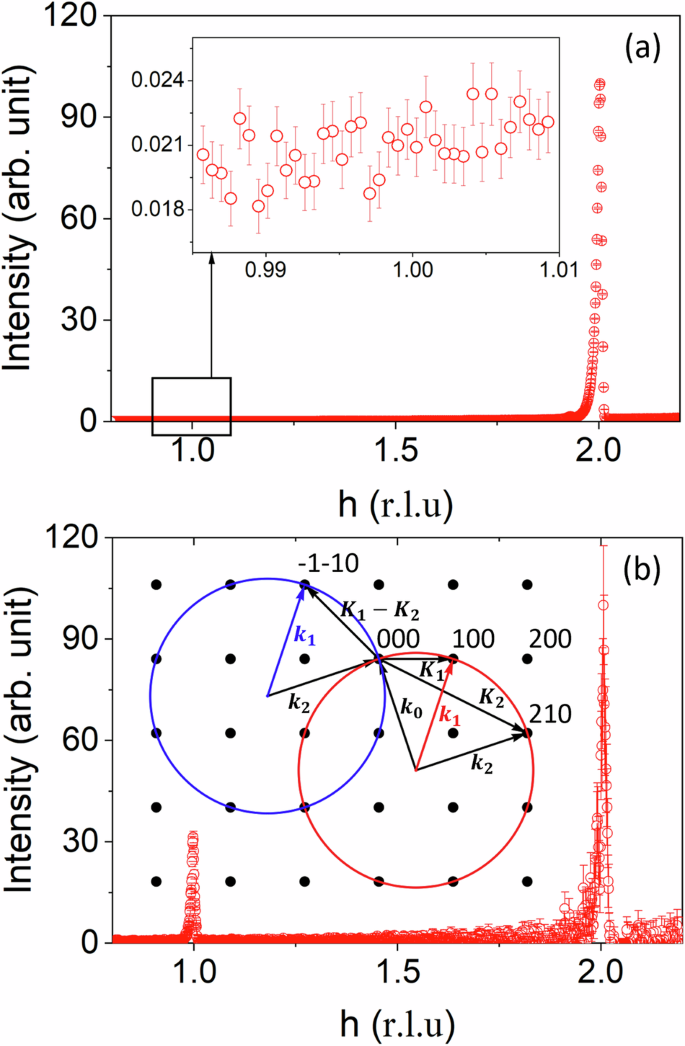
The data was collected at T = 1.5 K with the (h, 0, 0) reflections at the scattering angle 2Θ = 71∘ (a) and 2Θ = 32∘ (b). The counting time was 10 hours and 15 minutes, respectively. The data demonstrate 1D cuts of the reciprocal lattice along the (h, 0, 0) direction. The inset of (a) shows a zoomed region at a vicinity of the (1, 0, 0) reflection. The inset of (b) shows a simple two-dimensional illustration of the double diffraction, taking place when the Ewald sphere intersects both the K1 = (1, 0, 0) and the K2 = (2, 1, 0) reciprocal lattice points. The beam, first scattered by the (2, 1, 0) planes in the direction k2, is then scattered again by the (− 1, − 1, 0) planes in the direction k1, where the (1, 0, 0) scattering is expected. The intersection of the (h, k, 0) reciprocal plane and the Ewald sphere is shown by the red circle for the first scattering process (from the (2, 1, 0) planes) and by the blue circle for the second scattering process (by the (− 1, − 1, 0) planes).
This can happen when two reciprocal lattice nodes, K1 and K2, are present simultaneously on the surface of the Ewald sphere. Let us denote the Miller indices of the corresponding families of lattice planes as (h1, k1, l1) and (h2, k2, l2), then the corresponding Laue conditions are: (k1 − k0)/λ = K1 and (k2 − k0)/λ = K2, where k0 is the unit vector along the incident beam and k1, k2 are directions of the diffracted beam. By subtracting the second equation from the first, one obtains (k1 − k2)/λ = K1 − K2. This indicates that the beam diffracted by the (h1, k1, l1) in the direction k1 overlaps with a double-scattering beam, first by the plane (h2, k2, l2) in the direction k2 and then by the plane (h1 − h2, k1 − k2, l1 − l2) in the direction k1 (see inset of Fig. 1(b) for an illustration). If (h1, k1, l1) is a systematically absent structural reflection, then the Renninger effect may result in an apparent violation of the reflection conditions31 or can be interpreted as magnetic scattering.
As the radius of the Ewald sphere is defined by the wavelength λ of the incident and scattered neutrons, the double scattering process is expected to be strongly λ-dependent and should not take place if the necessary conditions are not satisfied. Observation of the doubly scattered beam will thus only exist in a finite angular range due to beam divergence and finite extension of the Bragg spots in reciprocal space, controlled by sample quality and instrument resolution. At low scattering angles, where the Bragg law selects short wavelengths, the radius of the Ewald sphere is big, and the sphere has a large surface in reciprocal space. Further, instrumental resolution also quickly degrades with decreasing scattering angles. This strongly increases the probability that two (or more) reciprocal spots hit the sphere producing the multiple scattering. Consequently, the Renninger effect is the most natural explanation for the presence of the (1, 0, 0) reflection in RuO2 and its strong dependence on the scattering angle (or equivalently the wavelength of neutrons). In the context of the present study, the key experimental observation is the lack of the (1, 0, 0) reflection in the well-optimized (in respect of the neutron flux) scattering geometry. After ten hours of measurements, the statistic of the data allows us to rule out the q = 0 magnetic ordering with moment size bigger than 0.011 μB, a value at least five times smaller than that previously proposed in ref. 21. Moreover, we explored a large portion of the reciprocal space available in the time-of-flight scattering experiment and have not found any evidence of magnetic ordering neither with q = 0 nor with some other propagation vector. This strongly supports the non-magnetic nature of the RuO2 crystals.
Muon spin relaxation/rotation (μSR) results
For further insights on their size, we employed the μSR technique as a highly sensitive probe of static local magnetic moments. In a μSR measurement, fully polarized muons are implanted into the sample. Muons decay with a lifetime of 2.2 μs, emitting a positron preferentially in the direction of the spin polarization at the time of decay. The spatial distribution of these positrons is monitored as a function of time using plastic scintillating detectors placed around the studied sample. Therefore, the asymmetry in the decay of positrons on opposite sides of the sample, A(t), is proportional to the polarization along the corresponding axis. In practice, A(t) is calculated via
where NU and ND are the number of positrons detected as a function of time in detectors placed above (U) and below (D) the sample, respectively. αUD is a geometric correction factor to account for the different efficiencies of the U and D detectors.
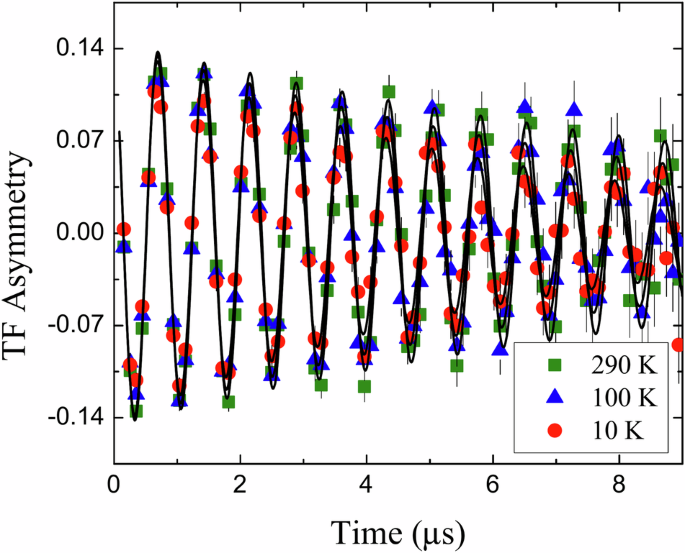
In the bulk μSR measurements (GPS), we performed primarily measurements on the powder sample in zero applied external field (ZF) and in weak transverse field (TF – transverse to the initial muon spin polarization). A few measurements obtained from the single crystal gave results that are – within error – equal to the powder measurements. Therefore, we hereafter focus only on the powder measurements. In Fig. 2(a), we show typical asymmetry curves measured at three different temperatures.
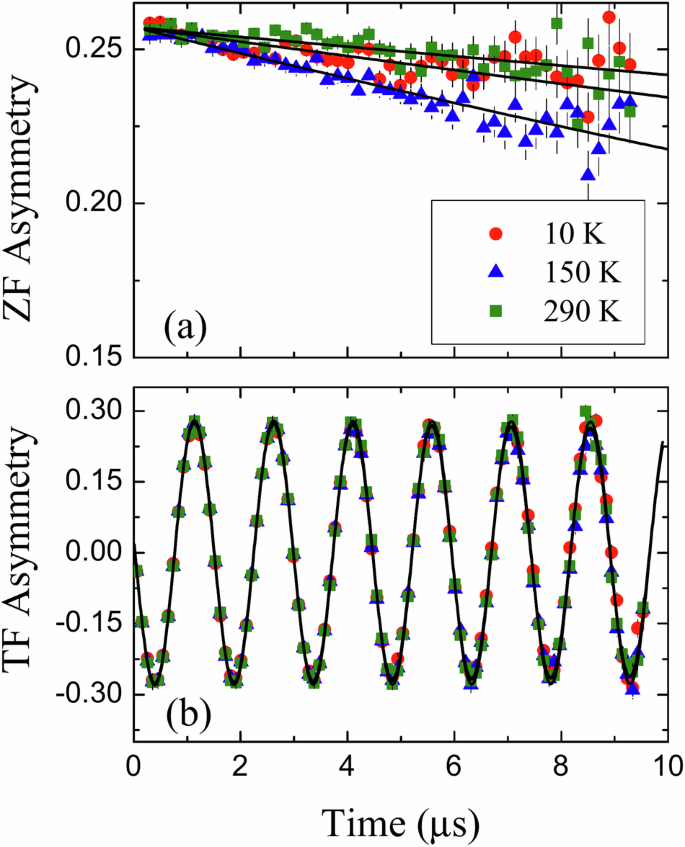
Representative curves were measured for (a) zero and (b) weak transverse magnetic field at various temperatures.
We observe no significant relaxation or depolarization at any temperature and no missing asymmetry, confirming that the local magnetic fields sensed by the implanted muons are extremely small, comparable to other non-magnetic materials such as gold and silver. Only a slight increase in the relaxation rate around ~150 K is observed. Similar results were obtained from μSR measurements while applying a TF of 5 mT. A few representative asymmetry spectra are depicted in Fig. 2b. The applied field in this case leads to a Larmor precession of the muons’ spin polarization, and therefore, an oscillation in the asymmetry spectra. In the case of a strongly magnetic sample with large internal magnetic fields (larger than the applied field), the initial amplitude of these oscillations is proportional to the paramagnetic volume fraction of the sample. However, if the internal magnetic fields are much smaller than the applied field, then the damping rate of the oscillations increases below the magnetic transition temperature. Just as in the case of the ZF measurements, no significant temperature dependence in the amplitude and damping rate was observed in the TF measurements, ruling out any static magnetic order in RuO2 (neither short nor long range).
To analyse the data, we fit the asymmetries using an exponentially damped oscillation, (A(t)={A}_{0}exp (-{lambda }_{mu }t)cos (omega t+varphi )). Both ZF and TF data were fitted using a temperature independent initial asymmetry A0 and phase φ, while the relaxation rate λμ and frequency ω were temperature dependent. For the ZF measurements, we use ω = 0 and φ = 0. The relaxation rates obtained from these fits are shown in Fig. 3.
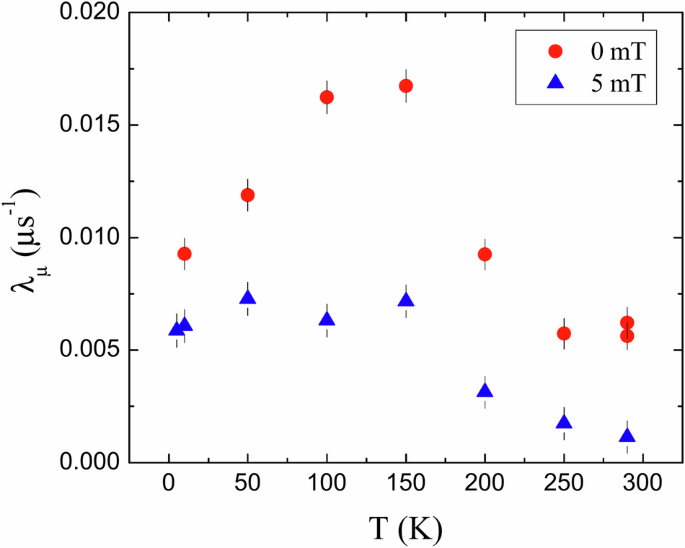
The temperature dependence was extracted from measurements in zero-field and transverse-field geometries.
We note a very small temperature dependence in λμ measured in both ZF and TF. In particular, in the ZF measurements we observe a peak around ~150 K, which corresponds to the small enhancement in relaxation seen in the raw spectra of Fig. 2a. The origin of this peak is not fully understood, but may be related to the muon’s spin lattice relaxation. In contrast, in the TF measurements, λμ increases slightly below ~200 K but saturates below ~150 K. This small temperature dependence and extremely small relaxation rate, however, cannot be attributed to static magnetic order in RuO2, which would generally result in much larger values of λμ. We note that our results are somewhat different from those presented in ref. 18. We attribute this to differences in fitting function (exponential vs. Gaussian) and fitting procedure (temperature independent vs. temperature dependent initial asymmetry).
In order to probe a possible magnetic order (or static magnetic moments) near grain boundaries, interface, or other defects, we performed low energy μSR (LE-μSR) measurements on 11 nm thick epitaxial RuO2(110) films deposited on top of a TiO2 rutile substrate. In the LE-μSR, the implantation energy of the muons, E, was varied between 1 keV and 12 keV, resulting in an implantation depth (probing depth) between ~5 nm and ~100 nm (see Fig. 4). Typical LE-μSR asymmetry curves measured at three different temperatures are shown in Fig. 5. The resulting damping rate, λμ, is plotted as a function of temperature for both implantation energies in Fig. 6 as a function of temperature for E = 1.5 keV and E = 12 keV, corresponding to muons stopping primarily in the RuO2 layer and the substrate, respectively.
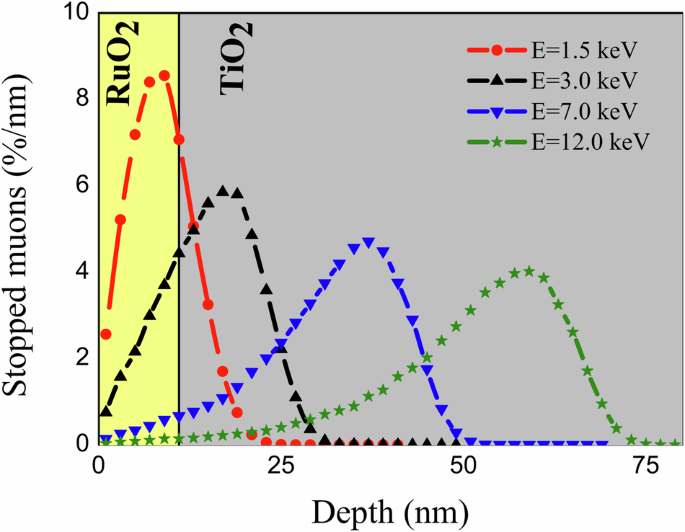
Muon stopping profiles calculated as a function of depth for the different implantation energies in an 11 nm thick RuO2 film on a TiO2 substrate.
Representative curves were measured with 10 mT transverse magnetic field and E = 1.5 keV at various temperatures.
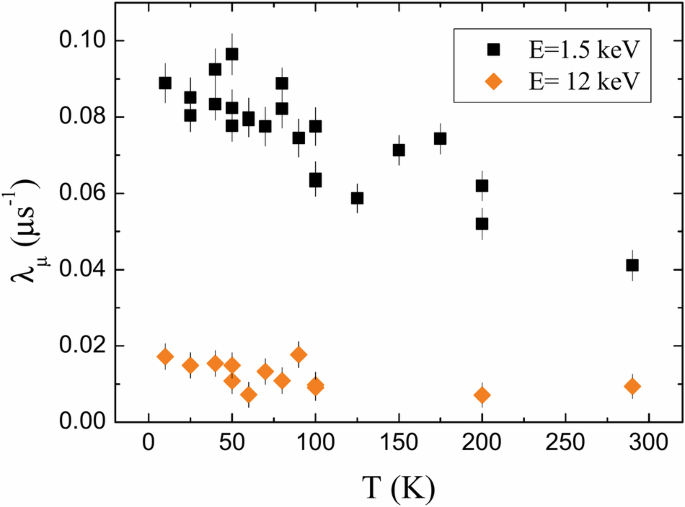
The temperature dependence was extracted from measurements in 10 mT transverse-field. At E = 1.5 keV most of the muons stop in the RuO2 layer while at E = 12 keV they stop in the substrate.
We find that λμ in the RuO2 layer, though generally higher than what we found in the bulk, remains quite small. This rules out the presence of large magnetic fields in these films. We also note that λμ in RuO2 is much larger than that measured in the TiO2 substrate. Therefore, the enhanced relaxation rate in the RuO2 layer cannot be attributed to the fraction of muons stopping in the substrate. Moreover, the gradual increase in λμ with decreasing temperature rules out background contribution due to back-scattered muons32. Instead, we believe that the observed increase in relaxation compared to the bulk is due to the presence of somewhat larger magnetic moments in films of RuO2. The origin of these magnetic moments may be defects or vacancies33, or epitaxial strain (see Supplementary Information), which might be more abundant in the films. Note that the equal relaxation rates measured in bulk crystals and powder points to the fact that (i) the density of vacancies and defects are similar in both and (ii) the size of their associated magnetic moments are very small.
Discussion
In order to better interpret the results of the μSR measurements, we performed first-principles calculations based on spin-polarized density functional theory (DFT), and enforcing a magnetic moment on the Ru atoms by adding a large effective Hubbard U22, as also done in other computational studies4,23. To emulate the muon stopping site, we used the standard protocol described in ref. 34. As muon and proton are identical from the point of view of adiabatic DFT calculations, we used a proton in place of the muon, thinking of the muon as a light proton35. The total number of electrons was kept unchanged. This proton was implanted into a sufficiently large (3 × 3 × 3) supercell to avoid interaction with its replicas in the neighboring cells34.
RuO2 crystallizes in the rutile structure, space group P42/mnm, as depicted in supplementary Fig. S4. This structure, which we here call “pristine”, serves as the basis for DFT calculations involving a muon. The calculated magnetic moment on the Ru atoms, for Ueff = 1.4 eV, was 0.866 μB/Ru. This magnetic moment was used in the interpretation of the experiments done in refs. 5,6,8,11,13,20,21,36. In addition to the pristine structure, we emulated the effect of potential Ru vacancies by removing one Ru from this supercell (i.e., 1.8% of Ru vacancies as reported in at least one case37), which enhances the tendency to magnetism22. We also checked the stability of the results against adding spin-orbit coupling (SOC), and found that both in the pristine case and in the presence of a Ru vacancy, SOC introduces negligible effects, in agreement with the previous literature23,25. To optimize computing time we thus performed our calculations without SOC.
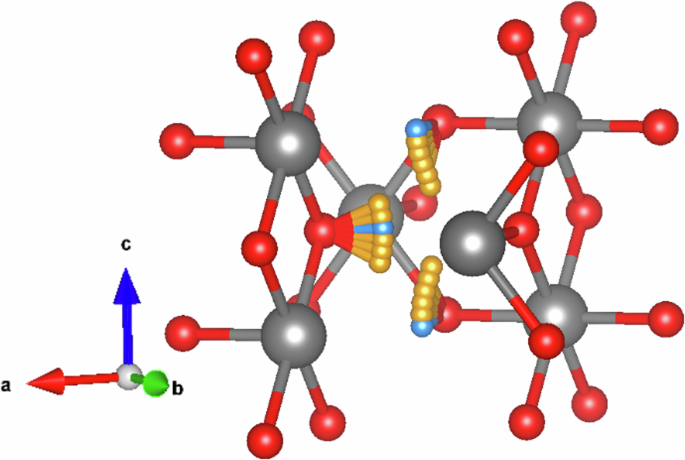
First, we identified probable stopping sites for a muon by looking at the electrostatic potential in the pristine unit cell, as shown in Fig. 7. This electrostatic potential is defined as the sum of the ionic potential and the Hartree potential.
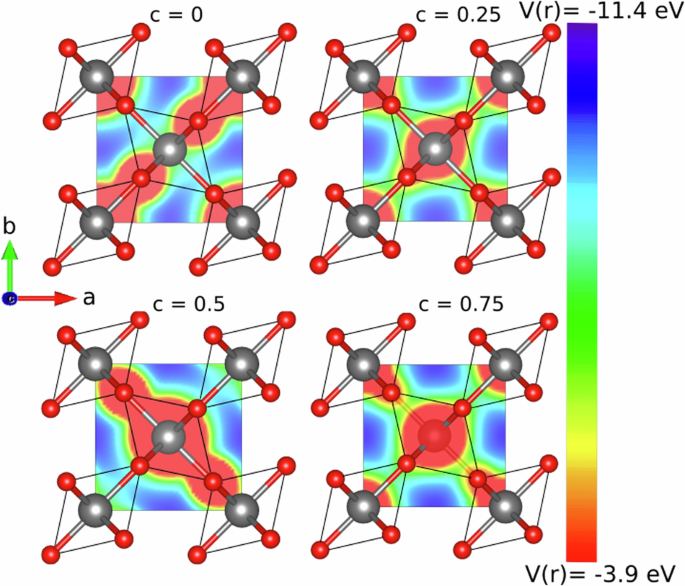
The electrostatic potential is represented by the color map from red to blue. The purple shade indicates regions where the (negative) electrostatic potential is the largest, i.e., the likely muon stopping sites. The color map is limited to the unit cell.
As Fig. 7 shows, and Fig. 8 further highlights, the electrostatic potential suggests the presence of channels along the crystal c direction, where we expect the muon to be initially attracted to. Within a channel, the electrostatic potential minima are the points farthest away from the Ru ions. They are indicated in Fig. 8 by little orange balls.
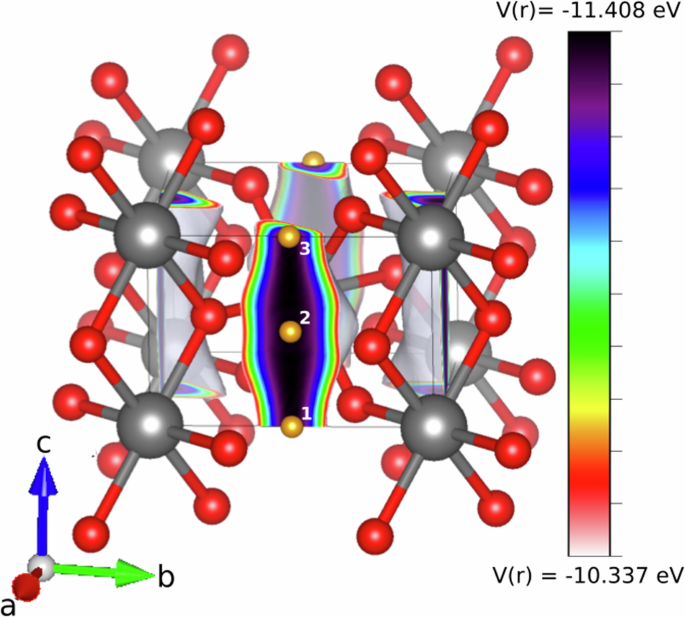
The color map indicates that, the maxima of the potential occurs at the furthest distance from Ru atoms. These positions are the most likely stopping sites along the channel, as seen in the minima of the energy in Fig. 10.
Taking a closer look at Fig. 8, and focusing on one color, i.e., one value of the electrostatic potential, we can construct an equipotential surface that is oriented along the c axis (see supplementary Fig. S4 for an example). The tube-like shape indicates the above-mentioned channel to which a muon will be immediately attracted. Full optimization of the muon, Ru and O positions further shows that the muons displace away from the axis of the tube to form a bond with one of the nearby oxygens (see Fig. 9), as is typical in ionic crystals34. Although along the c-axis the radii of the tubes diminish in the region between two Ru layers, there is a possibility of a thermally-activated muon diffusion along these channels, which can affect the muon depolarization by averaging the local magnetic fields. In order to check this, we performed constrained optimization, fixing the z coordinate of the muon and relaxing all other internal parameters. Since this is a rather time-consuming procedure, we performed all calculations on an 2 × 2 × 4 k-mesh, starting from a low k-mesh density and increasing it as the calculations converged. The result is shown in Fig. 10. We find the minima labeled 1–3 in Fig. 8 to be at least 600 meV deep. This barrier height ensures that muons do not diffuse between these stopping sites under our experimental conditions.
In blue, we specify those positions with the lowest energy, i.e. the most likely stopping sites.
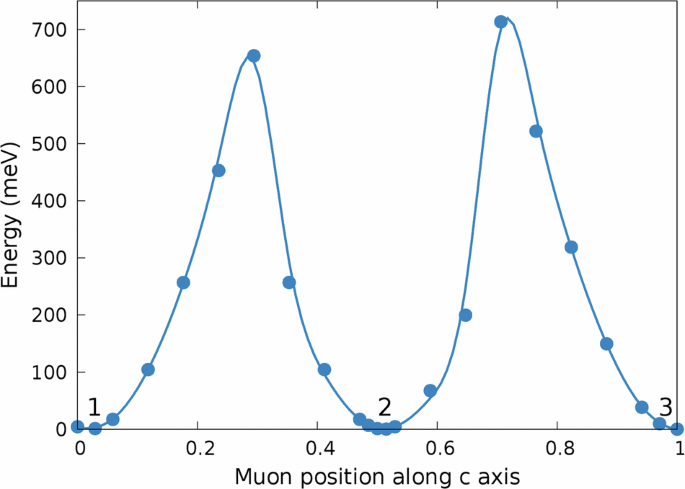
The muon’s position along a and b was relaxed. The most likely stopping sites are in the planes of the Ru atoms, as labeled in Fig. 8. The line is a guide to the eye. Please note that the energy landscape should be periodic, and the observed deviations on the order of ± 50 meV serve as an independent gauge of reliability of our calculations.
Beyond the pristine system, long range static magnetic order in RuO2 was suggested to be induced by hole doping due to Ru vacancies22. To account for this possibility, we conducted two sets of calculations: with and without a Ru vacancy in the 3 × 3 × 3 supercell. In the former case, we considered both the same stopping site as in a pristine crystal, again with full re-optimization, and a second case where the muon was put near a vacancy, followed by additional atomic relaxation (see Supplementary Information). As seen in supplementary Fig. S6, the electrostatic potential increases at the Ru vacancy (in absolute values). When placing a muon nearby the vacancy, however, it converged to a position further away from the Ru atoms than in the pristine case, revealing no new energetically favorable stopping sites.
The hyperfine field acting on the muon was calculated for both the structures with and without Ru vacancies. For different Ueff in the pristine case, the values of the hyperfine field and the magnetic moment of the Ru atoms are shown in Fig. 11. As expected in a good metal, we find that the hyperfine field is dominated by the Fermi-contact term due to the finite polarization of the electronic cloud, and the dipole field is much smaller. The hyperfine field shows a non-monotonic dependence on the applied Hubbard Ueff and the resulting moment, but never drops below ≈ 1 T. The calculations with a vacancy did not generate a new stopping site, and the calculated hyperfine field was similar to that for a pristine crystal. That is to say, when the calculations are artificially nudged into a magnetic solution by using a large Ueff, the resulting Fermi-contact hyperfine field is a few orders of magnitude stronger than admissible by the experimental constraints. Therefore, we conclude that the nonmagnetic calculations without U (as typical for 4d metals) describe our samples better. Note that in the latter case (and in fact for any Ueff ≲ 0.6 eV) the calculations converge to a fully nonmagnetic state, where not only the net magnetic moment around Ru is zero, but also the local spin density is zero everywhere.
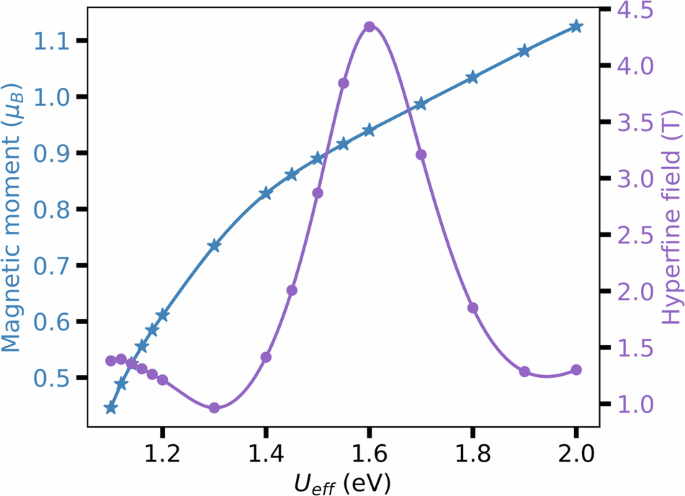
The Fermi-contact term provides the dominant contribution to the hyperfine field, being the dipole field contribution negligible. For Ueff values smaller than the plotted ones, the Ru atoms have no magnetic moment. The lines are guides to the eye.
Given the large Fermi-contact hyperfine field, we can confidently exclude the presence of anti(alter-)magnetic order. However, even if we exclude metallic electrons at the Fermi level from consideration, the dipole field induced by magnetic moments on Ru already allows us to exclude any static magnetic order. Indeed, the knowledge of the muon stopping site can be used to estimate the relationship between the muon relaxation rate λμ and the magnitude of magnetic moments m in RuO2. Due to the small magnitude of λμ and exponential relaxation of the asymmetry, we assume a dilute arrangement of randomly oriented static moments in our model. Even if the large Fermi-contact field was averaged out, these random moments (located on Ru sites or on magnetic impurities) would still produce a dipolar magnetic field distribution that leads to a relaxation/damping of the polarization of implanted muons.
Considering the exponential relaxation observed experimentally, we assume that the muons in RuO2 experience a distribution of static magnetic fields f(∣B∣) that can be described by a Lorentzian function,
where Λ is the half-width at half-maximum. In a physical context, Λ can be regarded as the magnitude of the local field Bloc, which can be written in terms of the relaxation rate λμ in ZF,
where γμ = 851.615 MHz/T is the muon’s gyromagnetic ratio. Therefore, we can put an upper limit on the local static field experienced by muons of 1.3 × 10⁻⁵T in the bulk (λμ ~0.015 μs−1) and 7.0 × 10⁻⁵T in the films (λμ ~0.08 μs−1). Assuming that these fields stem from a dipolar interaction between the muon and a neighboring Ru atom, they can be translated into upper limits of the magnetic moment of 1.14 × 10⁻⁴ μB in bulk and 7.5 × 10⁻⁴ μB in films.
Methods
Neutron diffraction
For single crystal neutron diffraction, we employed the large pixelated detector array of the state-of-the-art time of flight diffractometer WISH located at the second target station of the ISIS Neutron and Muon Source of the STFC Rutherford Appleton Laboratory (UK)38. Measurements were performed at 1.5 K using an Oxford Instruments cryostat on four RuO2 crystals, three of them identified as multi grain, one of them identified as essentially single grain. All measurements led to consistent conclusions. The crystals were aligned in the (h, 0, l) horizontal scattering plane, a large portion of which can be measured in a single shot using the time-of-flight dimension, with the possibility to rotate the crystals about the vertical b* direction. The normalization of the time of flight diffraction data was performed using the reduction routines implemented in the Mantid software39.
Muon spin relaxation/rotation (μSR)
The μSR experiments on the powder and single crystalline samples were conducted at the General Purpose Surface-Muon (GPS) Instrument40 at the Swiss Muon Source piM3.2 beamline of the Paul Scherrer Institute (PSI). A 4He continuous-flow cryostat was used to perform μSR measurements between 5 K and 290 K. The thin films were studied in the Low-Energy Muons Facility (LEM) at the μE4 beamline at PSI41,42. For these measurements, the thin-film samples were glued onto the cold finger of a 4He flow cryostat using silver paint. The data analysis for all the μSR spectra was conducted using the musrfit package43.
DFT calculations
DFT calculations were performed with the projector augmented-wave (PAW) method44,45, as implemented in VASP46,47,48,49,50,51. As exchange-correlation functional, we employed the generalized gradient approximation (GGA)52 and added an effective Hubbard Ueff = U − J = 1.4 eV using the rotational invariant GGA+U introduced in refs. 53 to ensure a sizable magnetic moment on the Ru atoms22 and a non-zero hyperfine field. The cutoff energy for the plane-wave basis was set to 300 eV. We confirmed that, as found in refs. 23,25, the introduction of SOC is negligible. Therefore the calculations were performed without it to optimize computing time. A supercell of 3 × 3 × 3 was used for the mu+DFT calculations, with a KMESH of 2 × 2 × 4 centered around gamma. In order to treat the hydrogen as a proton in VASP, we used the NELECT flag to remove the extra electron. Moreover, this proton was placed not along a high-symmetry line to ensure that the proton ended at the lowest energy position in that plane. To obtain the hyperfine field values, the flag LHYPERFINE was used.


Responses