Accessible model predicts response in hormone receptor positive HER2 negative breast cancer receiving neoadjuvant chemotherapy

Introduction
Breast cancer (BC) is the most common cancer in women, with the hormone receptor (HoR)-positive/HER2-negative subtype accounting for approximately 65% of cases1. Neoadjuvant therapy has become the standard of care in HER2-positive and triple-negative BCs due to the opportunity to downstage the tumor and perform conservative surgery and make locally advanced tumors operable2. In addition, neoadjuvant therapy allows assessment of response during treatment, with pathological complete response (pCR) being the best biomarker for predicting the risk of recurrence3,4.
Pathological complete response rates following neoadjuvant chemotherapy (NACT) vary significantly depending on the BC subtype. Among HoR-positive/HER2-negative BCs, pCR rates are typically low, ranging from 10% to 20%3,5. Furthermore, while NACT may be more effective than the same chemotherapy given after surgery in the early eradication of micrometastatic disease, it may increase the risk of metastasis for cancers that are insensitive to chemotherapy by delaying surgery6.
Given the prognostic role of pathological residual disease after NACT and the low pCR rate of this BC subtype, multiple efforts have been made to identify patients most likely to respond to NACT. However, clinicopathological factors, especially when examined separately, have shown only weak predictive value7,8,9. A variety of machine learning (ML) techniques have been extensively used in the past two decades to predict cancer susceptibility, recurrence and survival10, but few studies have looked into their applicability in predicting pCR after NACT based on pre-therapy clinicopathological characteristics. Particularly, studies that have investigated the use of ML models for predicting pathologic response to NACT have not focused on the different BC subtypes, developing predictive models in an unselected BC population11,12,13,14. This study aimed to develop and validate an ML model based on pre-NACT clinical and pathological features, with the potential to help clinician in the prediction of pCR in HoR-positive/HER2-negative BC.
Results
As per clinical practice, all patients receiving early BC diagnosis underwent radiologic imaging and tissue sampling, followed by neoadjuvant chemotherapy and surgery with pathological assessment. The study flow chart and the time points when each variable was collected are shown in Fig.1a. This study was based on data from two retrospective observational cohorts, one from Fondazione Policlinico Universitario A. Gemelli IRCCS (internal set, n = 572) and one from three other Italian institutions (external validation set, n = 151, Fig. 1b). The internal cohort was randomly split into a training (n = 463) and an internal validation set (n = 109). The training set was used for feature selection, model training and hyperparameters tuning using cross-validation. Predictions generated from the models were used to evaluate the models’ performance in the internal validation set. Feature importance was also evaluated. The performance of the best-performing model was validated in the external validation dataset.

a Key time points, variables collection and endpoints assessment. b Schematic of the machine learning workflow for model training, evaluation and validation. CONSORT diagram information is embedded in the figure. The model for pCR was trained using 463 patients from three different institutions of a single cancer center and model performance was evaluated on the internal validation dataset (n = 109). The final model was validated to the external validation dataset (n = 151), including patients from three different cancer centers.
Patients’ characteristics
Overall, 87 patients (15.2%) achieved pCR in the internal dataset, of which 72 in the training dataset (15.6%). As expected, patients’ characteristics were well balanced between the train and the internal validation set (Supplementary Table 1). The external validation cohort differed from the internal cohort: more patients were premenopausal and tumors were generally less aggressive, with less nodal involvement, higher prevalence of lobular histology, higher ER and PR expression and lower Ki67 levels. Accordingly, pCR rate was only 8.6% (13 events, Supplementary Table 2). A comparison of the three cohorts is shown in Supplementary Table 3.
Response to NACT can be heterogeneous in similar patients
We performed a RadViz analysis in the internal set to detect separability and patterns among patients achieving or not pCR (Fig. 2a). A lack of clear separation was observed between the two classes with wide overlapping regions having similar features but different outcomes. We then inspected the parallel plot to visualize the influence of the features on the likelihood of achieving pCR (Fig. 2b). The analysis suggested how small tumor size and negative lymph node status, alongside with low estrogen-receptor (ER) expression and high Ki67 levels, are aligned with higher pCR rates. Potential patterns were further investigated in the Uniform Manifold Approximation and Projection (UMAP) analysis, which was applied by varying the number of neighbors and the distance (Fig. 2c). While our analysis identified distinct clusters of patients based on their multi-dimensional profile, these clusters did not exhibit a clear overlap with pCR status: while some low-density pCR regions could be identified, the majority of clusters with a high density of pCR patients were nested into non-pCR regions. Consistently, focusing the analysis on the training dataset, the heatmap distinctly showed clusters of patients with similar features but different outcomes (Fig. 2d). The greater density of pCR patients was observed in the cluster characterized by ER-low and high Ki67 expression, a group of patients biologically closer to the triple-negative subtype. Clusters of clinical features were also identified and associations were found between ER and progesterone receptor (PR), Ki67 and grade (G), clinical tumor size (cT) and clinical lymph node status (cN).

a Radial visualization (RadViz) of patients’ characteristics in the internal cohort. RadViz algorithm plots each point normalizing its value on the axes from the center to the arc. No clear separation according to pCR status was observed. b Parallel coordinates plot for the relation between pCR status and patient’s characteristics in the internal cohort. c UMAP in the internal cohort. Different hyperparameters were used to highlight different possible clusters of patients. Columns correspond to different distances (from left to right: Euclidean, Manhattan and Chebyshev) while rows to different numbers of neighbors (from upper to lower: 10, 20, 50, 100). d Heatmap for patients’ characteristics in the training cohort. A hierarchical clustering algorithm with ward distance was used to cluster features and patients. The higher density of pCR was observed in patients with low ER and high Ki67. e Radial visualization (RadViz) of patients’ characteristics in the external validation cohort. Again, no clear separation according to pCR status was observed. f Parallel coordinates plot for the relation between pCR status and patient’s characteristics in the external validation cohort. g UMAP for the external validation cohort. The hyperparameters used were Manhattan distance and neighbors=10, which provided a good discriminative power in the internal cohort. A cluster of pCR patients was observed, nested in a non-pCR region.
In the validation dataset, low pCR regions were identified in the RadViz plot, again without a clear separation from high pCR regions (Fig. 2e). The influence of features was similar compared to the internal set (Fig. 2f). In UMAP analysis pCR patients tended to be grouped, even if nested into a bigger cluster including also non-pCR patients (Fig. 2g). Due to the preliminary and exploratory nature of this analysis and the possible information leakage from validation sets, no information at this stage was used for feature selection or model training.
Taken together, these data indicate that while pCR can be fairly excluded in some groups of patients, similar characteristics can result in different outcomes, underscoring the potential presence of unknown factors that might play a role in treatment response.
Clinicopathological features are associated with pathological complete response
Several feature selection techniques were applied to identify pCR predictors and remove redundant variables.
In order to minimize biases, the final choice of included variables was based on author consensus, considering results of the feature selection techniques and domain literature knowledge.
At exploratory univariable logistic regression analysis, cT, cN, G, ER, PR and Ki67 were significantly associated with pCR (Supplementary Table 4). In the correlation matrix, features with the strongest correlation were age with menopausal status (r = -0.76) and Ki67 with grade (r = 0.41). The features with the highest correlation with pCR were Ki67 (r = 0.27), cT (r = -0.23) and PR (r = -0.21). Notably, cN, cT, Ki67 and PR were selected by all the algorithms, followed by ER and age (selected in five out of six feature selection models). Feature selection is summarized in Supplementary Fig. 1. In the end, cN, cT, Ki67, PR, ER, age and G were considered for the final models. A reduction in multicollinearity was observed after feature removal (Supplementary Table 5).
These analyses highlight the lack of a strong correlation between single predictors and pCR, suggesting that multivariable models are required to efficiently predict pCR.
Machine learning models can predict response to NACT
Several machine learning frameworks were trained and evaluated using cross-validation. The Area Under the Receiver Operating Characteristic (AUROC) was used as the primary metric for performance evaluation. In the train set, cross-validated AUROCs were compared only among models from the same framework and the model with the highest cross-validated AUROC was selected for additional evaluation.
In this analysis, Generalized Linear Models (GLM) were identified as the most performing model family and further GLMs were trained and tuned using a Stochastic Gradient Descent (SGD) solver, implementing both hyperparameter optimization and sigmoid calibration within the pipeline to improve the reliability of pCR probability predictions. After hyperparameter tuning, the Elastic Net with SGD solver and sigmoid calibration was found to be the best-performing model, achieving a cross-validated AUROC of 0.81 in the train set (Supplementary Fig. 2-3). In the internal validation set, the model achieved the highest AUROC of 0.86 (95% CI 0.74-0.94) and an AUC PR of 0.55 (95% CI 0.31-0.77, Fig. 3a, b). The calibration curve indicates that the model is relatively well-calibrated at lower predicted probabilities but tends to be miscalibrated for predicted probabilities over 40% (Fig. 3c). Notably the TabPFN model without requiring extensive optimization, achieved and AUROC of 0.85 (95% CI 0.72-0.95) and an AUC PR of 0.58 (0.35-0.82) (Fig. 3a, b). In the internal validation set, we identified 0.1925 as the best cut-off for model predictions to maximize F1-score; using this cut-off, recall (sensitivity) was 0.80 and specificity 0.86 (Supplementary Fig. 4). The decision curve analysis showed a relatively high net benefit at low probabilities (Fig. 4d).
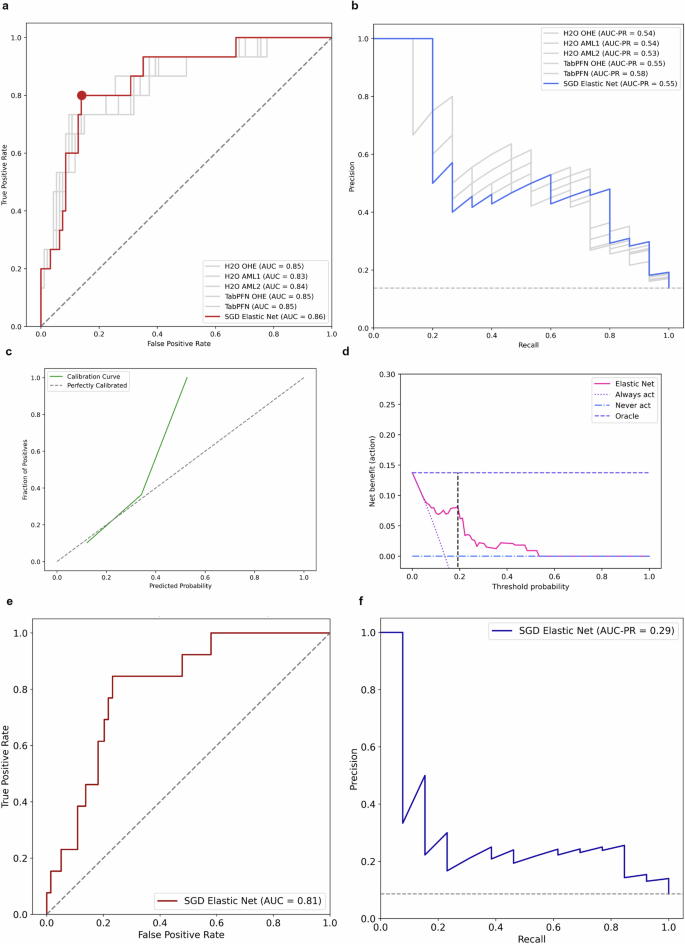
a Comparison of ROC curves in the internal validation set. The best model was Elastic Net trained with SGD solver and calibrated using Platt’s logistic model (sigmoid calibration). The performance of the other models is presented in gray solid lines. The performance of a random classifier is represented in a gray dashed line. The red dot corresponds to the cut-off 0.1925. b Comparison of precision-recall curves in the internal validation set. The Area Under the Precision-Recall Curve (AUC-PR) is a metric used to evaluate the performance of binary classification models, particularly when dealing with imbalanced datasets. It provides a summary measure of the trade-off between the precision and recall for different threshold settings of the classifier. Higher AUC-PR values indicate better overall performance. The baseline performance is represented in a gray dashed line. c Calibration curve. The model showed a fair calibration between 0.1 and 0.4, but systematically tended to be miscalibrated for pCR probabilities greater than 0.4. In the internal validation set, only 4 patients (4%) had a predicted probability above 0.4. d Decision curve analysis and net benefit. The net benefit is a measure that incorporates the true positive rate and false positive rate. Higher net benefit indicates better model performance in terms of clinical decision-making. At low threshold probabilities the model’s net benefit is relatively high, indicating that the model is useful for identifying patients who should be treated. At higher threshold probabilities the net benefit of the model declines. The black dashed line indicates the cut-off 0.1925. e Area under the ROC curve of the Elastic Net model in the external validation set. f Precision-Recall curve of the Elastic Net model in the internal validation set.

a Coefficients of the Elastic Net model. Positive coefficients are plotted clockwise and negative counterclockwise. Age: – 0.036, cN: -0.056, G: 0.059, PR: -0.073, ER: -0.075, cT: -0.075, Ki67: 0.095. b Barplot for SGD Elastic Net permutation importance coefficients. Weights are presented with respective errors. c Barplot of mean SHAP values. The barplot represents the mean global feature importance. The most important features in the dataset were cT and Ki67. d Beeswarn plot for SHAP values. Each patient is represented by a single dot on each feature row. The position of the dot is determined by the SHAP value. Positive SHAP values indicates greater probability of pCR. e SHAP heatmap. In the SHAP heatmap patients are reported on the x-axis and features on the y-axis with SHAP values encoded on a color scale. Patients are ordered in descending order based on the model predicted output and the global importance of each feature is shown on the left barplot. f SHAP decision plot. SHAP decision plots show how the model arrives at its predictions. Each line represents a single patient with corresponding SHAP values for each feature.
The best model’s performance was further validated in an external dataset to test its generalizability. The Elastic Net model with SGD solver achieved an AUROC of 0.81 (95% CI 0.70-0.90) and an AUC PR of 0.29 (95% CI 0.13-0.54, Fig. 3e, f, Supplementary Fig. 5). In this population, using 0.1925 as cut-off, the pCR rate in the patients with positive pCR prediction (precision) was 23%, almost three times the baseline pCR rate. Conversely, pCR rate was 4% in patients with a non-pCR prediction. These findings demonstrate the capability of our machine learning model to fairly predict response to NACT using accessible baseline features.
Clinical tumor size and Ki67 are the two most important features
Model explainability and feature importance was assessed in the internal validation set. In the Elastic Net model Ki67 and cT had the largest coefficients and all features had a negative coefficient except for Ki67 and G (Fig. 4a). Permutation importance analysis showed that permuting Ki67 and cN led to a notable decrease in model performance (Fig. 4b). Consistently, the highest mean Shapley Additive exPlanations (SHAP) values were observed for cT and Ki67, which had the highest impact on model predictions (Fig. 4c, d). In the SHAP heatmap, patients with the higher function had low cT, high Ki6 and low ER (Fig. 4e). The decision plot traces the path of each patient’s data through the model, observing how the cumulative SHAP values led to the final prediction (Fig. 4f). Partial dependence plots and single patients’ predictions are reported in Supplementary Fig. 6-7. In summary, cT and Ki67 were identified as the most critical predictors of treatment response, with consistent results across various methods.
Pathological complete response is prognostic for patients’ survival
In the internal cohort, 556 patients were evaluable for DFS and 564 for OS, with a median follow-up of 57.7 months for both outcomes. A DFS event occurred in 183 patients, 169 in the non-pCR group and 14 in the pCR group. As expected, patients achieving pCR had a significantly longer DFS compared to those who did not achieve pCR (HR 0.39; 95% CI 0.23-0.68, p < 0.001, Fig. 5a). Median DFS was not reached in the pCR group vs 91 months (95% CI 76-NE) in the non-pCR group. Similar results were observed for OS: an OS event occurred in 134 patients, 126 in the non-pCR group and 8 in the pCR group. Coherently, patients achieving pCR had a significantly longer OS compared to non-pCR patients (HR 0.31; 95% Ci 0.15–0.63, p = 0.001, Fig. 5b). Median OS was not reached in pCR group and 140 months (95% CI 98-NE) in the non-pCR group. The prognostic role of pCR was consistent in the internal validation set both for DFS (Supplementary Fig. 8a) and OS (Supplementary Fig. 9a). These analyses confirm pCR as a prognostic factor for survival.

a Kaplan-Meier curves of DFS according to pCR in the whole internal cohort. There were 169 events in pCR No group and 14 events in pCR Yes group. b Kaplan-Meier curves of OS according to pCR in the whole internal cohort. There were 126 events in the pCR No group and 8 events in pCR Yes group. c Kaplan-Meier curves of DFS according to pCR prediction in the internal validation cohort. Predictions were based on the threshold value obtained using MSRS. There were 32 events (57%) in the predicted pCR No group and 12 events (24%) in the predicted pCR Yes group. Since a violation of proportional hazard was graphically suspected and confirmed with Schoenfeld’s test, an exploratory analysis using the p-value for RSMT differences was reported. d Kaplan-Meier curves of OS according to pCR prediction in the internal validation cohort. Predictions were based on the threshold value obtained using MSRS. There were 23 events (40%) in the predicted pCR No group and 9 events (18%) in the predicted pCR Yes group. Again, since a violation of proportional hazard was graphically suspected and confirmed with Schoenfeld’s test, an exploratory analysis using the p-value for RSMT differences was reported. e Kaplan-Meier curves of DFS according to pCR stratified for pCR prediction in patients without pCR in the internal validation cohort. Predictions were based on the threshold value obtained using MSRS. f Kaplan-Meier curves of OS according to pCR stratified for pCR prediction in patients without pCR in the internal validation cohort. Predictions were based on the threshold value obtained using MSRS. MSRS maximally selected rank statistics. RSMT restricted mean survival time.
Model predictions could be independently prognostic of patients’ survival
In the internal validation set, using the defined cut-off of 0.1925, no statistical difference was observed between pCR- and non-pCR predicted patients (HR 0.63, 95% CI 0.28-1.42). Interestingly, we observed an absolute survival difference of 24% at 96 months (68% vs 44%, Supplementary Fig. 8b). Using maximally selected rank statistics (MSRS) we identified 0.1366 as the best cut-off to maximize survival difference (Supplementary Fig. 8c). Applying this value to pCR predictions, we observed a statistically significant survival difference between the two groups (HR 0.42; 95% CI 0.22-0.84, p = 0.01), with a 39% absolute difference at 96 months (71% vs 32%, Fig. 5c). This was confirmed in the exploratory analysis using restricted mean survival time (RMST, p-value 0.001). (Supplementary Fig. 8e). In terms of OS, using 0.1925 as cut-off, no clear difference was observed between patients whose pCR was predicted by the model and those whose pCR was not predicted (HR 0.62, 95% CI 0.24–1.63, Supplementary Fig. 9b). However, using MSRS, we identified 0.1366 as the same cut-off to maximize survival difference (Supplementary Fig. 9c). Applying this cut-off, whereas not-statistically significant (HR 0.50; 95% CI 0.23–1.09, p = 0.08), at 96 months we observed an absolute OS difference of 23% (74% vs 51%, Fig. 5d). At the exploratory analysis using RMST the p-value was 0.004 (Supplementary Fig. 9e).
We further stratified patients according to MSRS model prediction in 3 groups: pCR, no pCR – pCR predicted and no pCR – pCR non predicted. For DFS, a significant survival trend was observed (p-value test for trend 0.04): while pCR patients were prognostically similar to non pCR – pCR predicted patients, a clear difference was detected in the no pCR group according to pCR prediction, with a 34% absolute DFS difference at 96 months (67% vs 33%, Fig. 5e). For OS, whereas the trend was non-significant (p-value test for trend 0.14), at 96 months survival probabilities were 93% for pCR patients, 67% for no pCR – pCR predicted patients and 50% for no pCR – pCR non predicted patients (Fig. 5f).
Despite the relatively short follow-up, these exploratory analyses show how model predictions could have a prognostic impact on patients’ survival, especially providing a stratification in the majority of patients not achieving pCR.
Discussion
In this study, we developed and validated a machine learning model to predict the probability of pCR after NACT in HoR positive/HER2-negative BC patients, based on the contribution of clinicopathological features commonly available at baseline evaluation.
With regard to feature selection, we initially selected ten clinicopathological variables known to be related with pCR in HoR-positive/HER2-negative tumors. Previous research has demonstrated that age and menopausal status are correlated with sensitivity to chemotherapy15,16,17 as well as tumor stage at diagnosis and grading18,19,20,21,22,23. Ki67, ER and PR levels are also important predictive markers of pathologic response to NACT, with tumors that have low Ki67 and strong ER or PR expression associated with limited benefit from chemotherapy8,24. Specifically, in the context of HoR-positive/HER2-negative BCs, a high Ki67 value and PR negativity correlate with pathologic response to NACT9. Recently, low HER2 expression has also been questioned as an additional discriminatory variable of pathologic response to NACT25,26, particularly among HoR-positive tumors27,28,29.
In our study, analysis of the clinicopathological features’ importance suggested that Ki67 and cT are the most significant factors in predicting pCR in the context of HoR-positive/HER2-negative disease, according to different metrics. Of note, even if not included in the final model, feature selection algorithms acknowledged HER2 zero status as having some significance in predicting pCR in this population. On the contrary, menopausal status and tumor histology did not appear to have a substantial impact on the models’ performance.
Interestingly, considering both age and menopausal status, age appears to be a strong predictor of pathologic response, whereas menopausal status does not have a relevant impact on the probability of achieving a pCR. The literature data indicate an overlapping effect of these two parameters in predicting the benefit of chemotherapy in a HoR-positive/HER2-negative population, which is consistent with the correlation between the two variables found in our work16,17. In a HoR-positive cohort, another ML study found that, in the absence of the age variable, menopausal status affects the likelihood of pCR following NACT14. Taken together, these considerations suggest that in HoR-positive HER2-negative disease, age-related circulating estrogen levels may influence the pathological response to NACT16. However, the effect of age as a continuous variable might outweigh that of menopausal status as a binary variable in contributing to the prediction of pCR in a ML model and this could be particularly true for tree-based algorithms. Furthermore, it should be noted that the impact of age may also be attributable to differences in the capacity to complete the planned treatment regimens.
To develop a model that was accurate but also easily generalizable, we chose the clinicopathological features at the baseline of NACT known for predictive value and ready accessibility. In this regard, the two methods for selecting relevant variables have been compared: the expert model, with clinical, pathological, and treatment parameters chosen based on oncologists’ opinions, and the data-driven model, which used factors chosen by the feature selection algorithms12. The variables selected by the data-driven process were equivalent to those made by experts and the performances of the two models were similar. When few variables are considered, training a model to automatically choose a set of features did not increase the prediction performance obtained from variable selection by the expert subjects. Moreover, if the single selection method is not included in a pipeline it could result in a biased cross-validated performance due to information leakage of the cross-validated test folds. In our study we used a hybrid approach: we initially considered a set of variables based on literature data, evaluated feature selection algorithm results and then made the final selection based on domain knowledge.
Regarding pCR, the Elastic Net model obtained an AUC of 0.81 in the external validation set, confirming the good discriminative power observed in the internal validation set despite the differences in patient’s baseline characteristics. The good AUROC value indicates the model learned some meaningful patterns in the training data, which were fairly generalizable in a diverse population. However, the consistent AUROC value coupled with a sensible decrease in the AUC-PR suggests that, while patients unlikely to achieve pCR tend to have similar characteristics and can be consistently detected by the model, the actual ability to predict pCR could be more challenging in different populations. This drop in the AUC-PR performance was expected in light of the results of our preliminary analysis, where a clear separation of patients could not be observed based only on pCR status: while there were regions with a high density of non-pCR patients, in the external validation cohort the only region with a higher density of pCR patients was nested inside a wider non-pCR patients’ region. This means that while non-responders can be predicted with a fair discriminative power, pCR is quite hard to predict based only on clinicopathological characteristics since women with similar features can have different outcomes.
Identifying patients who are unlikely to respond to NACT may hold greater clinical significance in this context: since NACT is the standard therapeutic approach for this population, patients with a high predicted probability of response will still receive the most effective treatment available. On the other hand, the identification of patients with a low probability of pCR is indeed crucial because this is the population that could benefit more from a risk-adapted approach. The analysis of SHAP values and the decision plot highlighted how large tumors with nodal involvement, high PR or ER expression and low Ki67 values were generally associated with low predicted probabilities. In this scenario, the model could potentially be included in the decision framework between an adjuvant or neoadjuvant approach: patients with low scores and small tumors could be the best candidates for upfront surgery, reducing the risk of metastasis for cancers that we have predicted to be insensitive to chemotherapy. Accordingly, patients with low scores due to high hormone-receptor expression could be referred to neoadjuvant endocrine therapy if preoperative downstaging is required. On the other hand, ER-low expression with high Ki67 levels were associated with the highest scores: biologically these tumors are similar to triple-negative BCs and could benefit more from the addition of immunotherapy to NACT30,31,32.
To ensure model accessibility and implementation in clinical practice, we further developed an open-source interactive web app, which is available at https://coralaine-whxxbg8wwtwnntoxbxqjhu.streamlit.app. The predicted pCR can be used to stratify patients into different risk categories. For this scope, we believe that 20% can be considered by clinicians as a useful and easily applicable cut-off to categorize patients into high and low-likelihood groups for achieving pCR. In this scenario, NACT should be proposed to the former group while low-likelihood patients might be considered for alternative treatment strategies or inclusion in clinical trials. Using this cut-off, approximately 20% of patients are predicted to have a high likelihood of pCR. It should be noted that the model is well-calibrated for patients with a predicted pCR probability below 40%, but tends to be miscalibrated for values above 40%. Importantly, this miscalibration affects only a small number of patients, as only 4% of patients in the internal validation set had a predicted probability greater than 40%. This suggests that the model remains reliable and robust for the majority of scenarios.
This is, by our knowledge, the model with the highest performance specifically trained in HoR positive/HER2 negative patients. In general, none of the tested algorithms exceeded 0.85 for AUROC, which on one side explains a significant part of variability but on the other hand suggests that clinicopathological features can only explain part of response patterns and other predictors should be identified, making pCR prediction a complex task. Several regression-based models have been proposed to predict pathologic response to NCT in HoR-positive HER2-negative BCs33,34. Linear models are widely used and easily interpretable, but fail in considering nonlinearity and interactions, unless pre-specified. Machine learning approaches are more adaptable since they can discover patterns directly from the data without presuming any underlying statistical model35,36. The results of our research and the abovementioned papers suggest that while ML methods could be in general more effective, GLMs can still be performant under determinate circumstances12. In our study, the Elastic Net with SGD solver outperformed more complex algorithms such as XGBoost or DNNs, offering a positive trade-off between model complexity and explainability. This trend was consistent independently of the encoding method and the number of features: as confirmed by the small changes in AUROCs. This is not unsurprisingly: when the features tend to have a linear relationship with the outcome and the dataset is relatively small, regularized GLMs can perform well, while more powerful and data-hungry methods can overfit noise in the training data or fail to utilize their full potential. The second-best model was TabPFN, which achieved an AUROC of 0.85 without requiring hyperparameter tuning. This performance is notable, confirming the impact of transformers on tabular classification problems, but it should be noticed how in the scenario a more complex model did not consistently improve the performance of a simpler model.
Exploratory survival analysis according to the pathological response confirmed the well-established prognostic value of achieving pCR in relation to DFS and OS3. While pCR predictions from the base model were not associated with better outcomes, the exploratory analysis using MSRS cut-off revealed how MSRS-based predictions were associated with improved DFS and OS. Remarkably, the same cut-off value was identified for DFS and OS, suggesting a consistent predictive capacity of the model across these survival metrics. These observations suggest that the model could provide a prognostic stratification independently from pCR status: even when the model fails and detects a false positive patient, this prediction could still be valuable since could be associated with a positive impact on a patient’s survival. The different cut-off compared to the one for pCR predictions could indicate that the model captured meaningful patterns within the data that extend beyond pCR achievement. This effect was more noticeable in patients not achieving pCR, the population in which a prognostic stratification is more needed. Limitations of this analysis should be acknowledged: the small sample size and the relatively short follow-up impose cautious interpretation and validation of these observations in a larger external cohort with longer follow-up is needed.
Several limitations remain in our study, such as its retrospective nature: as such, data about CT delivery (dose reductions, administration delays and dose interruptions) or adverse events were not homogeneously collected and were not included in the analysis to avoid availability bias. Another drawback is the lack of information on tumor-infiltrating lymphocytes and BRCA mutational status, which are known to be relevant to the pathologic response following NCT37,38,39. However, both data were not routinely analyzed when the BC patients were diagnosed. Beyond these variables, the inclusion of other features of interest could increase the discriminatory power of the model. A high recurrence risk score of gene expression panels such as the 21-gene assay on diagnostic biopsy has been shown to predict pCR40,41, as well as the assessment of circulating tumor DNA and particularly its early dynamic changes during over the course of NCT42. Furthermore, in the BC NCT setting, ML and deep learning models have been explored to predict the pathological response based on pre-NCT histopathological and radiological images43,44,45. In view of multimodal integration, in addition to the Elastic Net model, we trained the TabPFN, a transformer that harnesses the transfer learning capabilities of deep learning models. This allowed the training of a pre-trained model which can be further fine-tuned for specific datasets, an advantage that is largely absent in tabular data. Whereas this model suffers from quadratic memory complexity scaling (due to the underlining attention architecture), it matches the performance of tree-based models in small datasets, making it is particularly suited in this scenario46. Moreover, survival data are still immature and longer follow-up is needed considering the favorable prognosis of these patients. In this context, analyses on disease-free interval or distant disease-free interval were not included: while these are critical endpoints for evaluating recurrence, we decided not to include them in order to maintain the focus on short-term predictors of pathologic response to NACT. In addition, due to the lack of validation, the MSRS analysis should be considered hypothesis-generating.
In the end, the choice of the external validation set was primarily driven by availability of a high-quality dataset. The different characteristics of the populations can be related to baseline differences in the patients referring to the different centers of to the inter-rater heterogeneity in the assessment of biomarkers. However, it must be noticed that although the external validation set included more patients with lower risk categories, the training set had enough support on this population to retrieve meaningful patterns. To allow independent external validation, the model is freely available using the web app.
In conclusion, we developed and externally validated a ML model to predict pCR following NACT in HoR-positive/HER2-negative BC patients. Results suggest that a combination of easily accessible clinicopathological features can be used to reliably describe and predict response to NACT. Our framework is highly reproducible: the methodologies employed are agnostic and applicable across various types of cancers, making the models scalable to different clinical settings. By restricting the patient population, we were able to show which clinicopathological features have a greater predictive impact and to identify a population of patients that could benefit the most from risk-adaptive strategies. In addition, the patients included in the different cohorts were from different settings and almost the totality of them received an anthracycline and taxane-based NACT, providing reliable real-world evidence. Longer follow-up is needed to validate the prognostic role of model predictions on survival outcomes and, once confirmed, possibly include them in survival models. In the end, we believe that adopting the developed model may help the decision-making in the management of HoR-positive/HER2-negative BCs.
Methods
Patients’ population
The CORALAINE study is a retrospective longitudinal cohort study that describes the development of a prediction model in accordance with the guidelines for transparent reporting of multivariable prediction models for individual prognosis or diagnosis (TRIPOD-AI, Supplementary Table 6)47. The collection of anonymous data was approved by the institutional ethical review board (Prot. ID3315 n.0029524/20, July 15th, 2020).
Patients who fulfilled the following inclusion criteria were included: (1) pathologically confirmed diagnosis of HoR-positive/HER2-negative invasive BC between January 1st 2001 and 31st May 2021; (2) early or locally advanced, stage I-II-III BCs, (3) patients receiving neoadjuvant anthracycline and/or taxane-based chemotherapy, concurrently or sequentially; (4) patients undergoing surgery for primary BC. Clinicopathological information and survival data were retrospectively collected from electronic medical records including reports from multidisciplinary tumor boards (MTB). Clinical data were collected until December 2022, and each patient’s follow-up was updated through January 31st 2023.
Patients treated at two Italian institutions (Unit of Medical Oncology and Unit of Gynaecological Oncology, Fondazione Policlinico Universitario A. Gemelli IRCCS, Università Cattolica del Sacro Cuore, Rome) were considered eligible for the internal cohort. The internal cohort was randomly split into a training set and an internal validation hold-out set. The train set was used as an exploratory dataset for feature selection and to train the ML models. The internal validation set was set aside and used only to test model predictions. A second dataset was used as external validation set: data of patients referring to three Italian institutions in the same time frame were gathered (Medical Oncology ‘A’, Istituto Oncologico Veneto IOV-IRCCS, University of Padova; Medical Oncology, Azienda Ospedaliera Universitaria Integrata, University of Verona and Unit of Oncology, University of Udine).
Clinical data
The following pre-surgery variables were collected: menopausal status, age, primary tumor size, clinical lymph node status, histology, grading, estrogen receptor and progesterone receptor status, HER2 expression, Ki67 value, chemotherapy regimen and timing (concomitant or sequential). Typical combinations included anthracyclines and cyclophosphamide either concomitant or sequential with a taxane.
Women were considered postmenopausal if they met one of the following requirements: (1) age less than 60 years and amenorrhea for at least 12 months in the absence of chemotherapy, tamoxifen or ovarian suppression; (2) previous bilateral oophorectomy; (3) age over 60 years48. Clinical stages were collected from preoperative imaging and were defined according to the criteria of the American Joint Committee on Cancer, 8th Edition49. Specimen handling was performed according to the national guidelines provided by the Italian Ministry of Health. Hormone receptor positivity was defined as ER or PR positivity with a percentage of immunohistochemistry (IHC)-positive nuclei of at least 1%. HER2 positivity was defined as a 3+ score at IHC or 2+ with amplified FISH, according to the 2018 ASCO-CAP guidelines50. HER2 zero was defined as HER score 0 and HER2 low as HER2 1+ or HER2 2+ with non-amplified FISH51. The Ki67 value was calculated using the percentage of nuclei that were MIB-1 positive52. The following post-surgical data were collected: pCR, tumor size (ypT), lymph node status (ypN), G, ER and PR expression, Ki67, HER2, type of surgery and adjuvant hormonal therapy.
The primary endpoint was pCR, defined as the absence of residual invasive cancer on hematoxylin and eosin evaluation of the complete resected breast specimen and all sampled regional lymph nodes following completion of neoadjuvant systemic therapy (i.e., ypT0/Tis ypN0 in the current AJCC staging system)3,53. Pathological stage (ypT and ypN) was defined according to the criteria of the American Joint Committee on Cancer, 8th Edition49. Each assessment was confirmed by at least one expert pathologist in the referring center.
Sample size considerations
Target sample size and events per predictor were calculated as reported by Riley et al. using the R package pmsampsize54,55. The number of candidate predictors was set to 8, the event prevalence to 0.15 and the C-statistics to 0.2, with a shrinkage factor of 0.9. The minimum sample size required for the training set was 435 and the minimally required events per predictor were 8.16, with at least 66 events. The sample size of the whole internal cohort was then calculated considering an 80/20 train/test split, requiring at least 544 patients and 83 events. The minimum sample size of the external validation set was considered equal to the internal validation cohort. Using this approach, 2/3 of the total sample size were used for model training and 1/3 for internal and external validation.
Statistical analysis
Clinicopathological characteristics at baseline were described using standard descriptive statistics. Continuous variables were reported as mean and standard deviation and evaluated with the Student t-test. Categorical variables were reported as frequency and percentage and assessed using a Chi-Square test or Fisher’s exact test, as appropriate.
Exploratory visual analysis of the internal dataset was performed using the RadViz and Parallel Coordinates functions from the yellowbrick package. A UMAP analysis using umap package with different hyperparameters was performed to visually inspect patients’ characteristics and preliminarily identify potential clusters based on clinicopathological features.
Statistical analyses were performed using R Studio (ver 4.2.2) and Python (ver 3.10). All hypotheses were two-sided and p < 0.05 was considered statistically significant.
Pre-processing
The internal cohort was split in a train/internal validation set using an 80/20 split. Variables with zero variance and near-zero variance were grouped with other variables or eliminated, due to the risk of spurious results and non-informative predictors. Age, ER, PR, and Ki67 expression were considered as continuous variables. Menopausal status was categorized as premenopausal and postmenopausal. Clinical tumor size and lymph node status were treated as ordered categorical data. Grading was considered as ordinal and categorized in G1-2 and G3. Histology was divided in three subcategories: ductal, lobular, and others. HER2 status was categorized as HER zero and HER2 low. The pathological response following NACT was considered a binary variable (pCR or residual invasive disease). All categorical variables were encoded using OHE and OE. The OE was conducted according to aggressiveness or to a clinically meaningful order, as appropriate. For example, cT was encoded by assigning an ordinal number for 0 to 3. The exact mapping is listed in Supplementary Fig. 3. All features were scaled using z-score standardization as a preprocessing step. Missing data, covering less than 1% of the total data, were considered missing at random (MAR) and were imputed using chained random forests via the missForest function of the missForest package in R. Missing data were imputed after train/test split and after removing the target column in order to avoid information leakage.
Feature Selection
Univariable logistic regression was performed to identify differences between the pCR and the non-pCR cohorts. Spearman correlation coefficient was used to evaluate the correlation among predictors and between features and pCR. A hierarchical clustering algorithm using single linkage distance was then applied. An absolute value of r > 0.10 was considered for feature selection. Permutation importance was evaluated training a TabPFN classifier with all variables using the eli5 package. A ranking feature selection algorithm was used using the Boruta package, training a RF classifier. All features performing outperforming the best shadow feature were considered as rank one and included. Three RFE algorithms with stratified 5-fold cross-validation were applied: logistic regression (maximizing accuracy and weighted F1) and a random forest classifier with 10 estimators (maximizing weighted F1). A LASSO regression with stratified 10-fold cross-validation was applied and features with non-zero coefficients were retrieved. The number of times each subset of variables was selected by each algorithm was summarized using an UpSet plot. Multicollinearity was inspected using the variance inflation factor (VIF). All analyses for feature selection were conducted using only the train set: none of the models had access to the internal or external validation data during this step.
Model development
At first, the models were trained using the AutoML framework from the H2O package (H2OAutoML). This version trains and cross-validates the following algorithms: XGBoost, GLMs, RF, XRT, GBM and DNN. At the end of the process, additional stacked ensembles are trained using all the base models and only one of the best models from each algorithm family. For each run, the maximum number of models was set to 20 and oversampling was allowed to balance class distribution. For H2O models, hyperparameter tuning was performed using grid search and each model was evaluate using 5-fold cross-validation, using the AUROC as the scoring metric. The model with the best cross-validated AUC was evaluated on the internal validation set. We trained preliminary models using one-hot encoding and ordinal encoding, including both selected variables and all variables as a sensitivity analysis. After identifying GLMs with OE as the best-performing model family, further GLMs (H2OGeneralizedLinearEstimator) were trained with controlled hyperparameter optimization using the optuna package. Other GLMs were then trained using SGD solver from sklearn, including in the pipeline hyperparameter tuning with optuna and sigmoid calibration using Platt scaling, using 25% of the observations of the train set as calibration set. The TabPFN model was trained using the TabPFNClassifier function of the tabpfn package46.
Model evaluation and feature importance
Hyperparameter tuning was performed using 5-fold cross-validation on the train set using the internal validation set only to test models’ performance. We evaluated the confusion matrix, the learning curve and the performance metrics with respective thresholds (AUROC, AUC-PR, F1, accuracy, precision and recall). The decision curve analysis was performed using the statkit package.
The best models were evaluated on the internal validation set using the area under AUROC and the AUC-PR. The calibration curve was also inspected. 2000 bootstrap replicates were adopted to calculate 95% confidence intervals (IC) for the AUROC and the AUC-PR. The F1 score was used to choose the prediction threshold.
Finally, the best model for each strategy was evaluated on the external validation set comparing the confusion matrix, the AUROC and the AUC-PR.
For each model, we inspected variable importance, partial dependence plots (PDP), SHAP values and permutation importance. Feature’s coefficient for the Elastic Net were computed and displayed using a radial bar chart. For TabPFN model, feature importance was evaluated using permutation importance from the eli5 package.
Survival Analysis
DFS was assessed as the time from surgery to local and/or distant relapse or death from any cause. Patients alive without disease recurrence were censored at the last follow-up visit. OS was defined as the time from surgery to death from any cause. The choice of starting OS assessment from surgery was made to minimize the possibility of led-time bias due to different intervals between diagnosis and surgery timings. Patients who were still alive at the last follow-up visit were censored. Both DFS and OS were determined by the attending physician based on reports of disease recurrence, imaging or clinical evaluation. Where relapse/progression date was unclear from radiology reports alone, clinical interpretation was incorporated in the decision.
Survival estimates were evaluated by the Kaplan-Maier method. Differences between groups were assessed by the log-rank test and survival trends by the test for trend. Median follow-up time was calculated by the reverse Kaplan-Meier method. Median survival and survival probabilities at specified time-points were reported, as well as absolute survival differences. Cox proportional hazard regression models were applied to estimate HRs. The Efron method was used to handle ties in the Cox likelihood. The prognostic role of pCR in terms of DFS an OS was assessed in the full internal cohort and then in the internal validation cohort. The prognostic role of the best model predictions in terms of DFS and OS was explored in the internal validation cohort. A cut-point analysis based on MSRS was conducted to evaluate the best cut-off in the probability of achieving pCR that could maximize the survival difference. Proportional hazards assumption was evaluated graphically and tested using Schoenfeld residuals. When the assumption was not met (p < 0.10), we performed a sensitivity analysis using the RMST and the restricted mean time lost (RMTL). The R packages survival and survminer were used for survival curves and diagnostic, maxstat for MSRS and survRM2 for RMST.

 and the impact of repeat biopsies")

Responses