Acoustic impedance-based surface acoustic wave chip for gas leak detection and respiratory monitoring
Introduction
The concept of acoustic impedance helps to understand the behavior of acoustic waves propagating in different media. Controlling the acoustic impedance of the medium can alter the transmission and reflection characteristics of acoustic signals. Acoustic impedance has been widely used in various fields such as acoustic imaging, acoustic stealth, multi-layered medium acoustic communication, and so on1,2,3,4. In these applications, air, water, and human tissues are commonly used as acoustic transmission media, so longitudinal waves are often used as sound sources. However, the transducers used typically face challenges of low frequency or large size.
Here we focus on a mechanical surface acoustic wave (SAW) that excites and propagates on the surface of the piezoelectric crystal. SAW can generate acoustic signals of MHz–GHz5,6,7, and has the characteristics of micro-nano scale and high sensitivity5,7,8 due to its unique structure of interdigital transducers (IDTs) and piezoelectric effect. Therefore, high sensing performance of multi-parameter sensors based on the SAW principle has been developed, including gas detection5,9,10,11,12,13,14, temperature and humidity sensing15,16,17, and pressure and strain measurement18,19,20. The mechanisms in these sensing processes either rely on the mass loading21,22,23, acoustoelectric effect24,25,26,27, viscoelastic effect28,29,30 generated by the combined sensitive materials, or are based on the thermal expansion and elastic effect of the piezoelectric crystal materials themselves6,31,32,33, and most of which achieve ideal capabilities. However, as far as we know, no researchers have paid attention to the influence of the gas medium impedance on the SAW chip and explored its application in the sensing field.
In this paper, we first explore a SAW sensing method based on the acoustic impedance effect and develop an SAW sensing chip to investigate its application effects in gas leakage detection and human respiratory efficiency monitoring. The theoretical model of the sensing mechanism of the acoustic impedance effect is constructed first, and the impact of changes in gas/humidity-sensitive medium concentration on acoustic propagation on the chip surface is analyzed by employing the ideal gas equation and the law of mass conservation. SAW micro-nano chips and acoustic attenuation signal acquisition systems are experimentally prepared and tested. The experimental results show that different gas loadings produce different acoustic propagation attenuation signals, and the response and recovery speed can reach the sub-second level. This capability can also be perfectly used for human respiratory monitoring, accurately reflecting the respiratory state, frequency, and intensity. Therefore, the SAW sensing method and chip based on the acoustic impedance effect proposed in this work has a good application prospect for in-situ detection of gas leakage and precise monitoring of human respiration.
Results and discussion
Acoustic impedance effect
To analyze the acoustic impedance effect on SAW propagation characteristics, the finite element method (FEM) is used to establish a simulation model of a 200 MHz SAW chip based on Y35o X quartz substrate33, and the model is simplified to the single-period model due to the symmetry and periodicity of the SAW chip. The piezoelectric control equation and corresponding boundary conditions are set in the FEM software. According, the propagation frequency of the SAW device is obtained through the eigenfrequency analysis method. The detailed simulation step is in Supplementary Note 1. The simulation results are shown in Fig. 1a. The generated Rayleigh wave energy in the Y35oX quartz is concentrated on the surface of the crystal, and when a gas load is applied to the surface of the quartz, the SAW propagating along the solid surface takes place energy coupling at the gas/solid interface, it radiates acoustic energy into the upper gas, and causes energy dissipation. The resonant frequency of the device changes from real to complex. The imaginary of wavenumber (Ki) shown in Fig. 1b is proportional to the resonant frequency, the conversion to loss reveals that the SAW propagation loss caused by gas loading decreases with the increase of resonant frequency (~3.36 × 10⁻⁴ dB/λ for each 1 MHz rise), in which the least square method is used to fitting the curve. Furthermore, we consider the relationship between the SAW loss and the SAW frequency under different acoustic impedances. As shown in Fig. 1c, the upper gas with a larger acoustic impedance effect induces more SAW energy radiation, causing more SAW propagation loss. Additionally, a higher SAW propagation frequency helps to achieve greater sensitivity to SAW propagation losses (82.2 × 10⁻⁴ dB/λrayls@100 MHz, 84.2 × 10⁻⁴ dB/λrayls@200 MHz, 89.5 × 10⁻⁴ dB/λrayls@400 MHz), where the sensitivity is fitted by the least square method. We can see that there is a good linearity (R2 > 99.99%) between the gas impedance and the loss of the SAW chip, which means that the loss caused by the acoustic impedance effect is a very friendly sensing signal, the acoustic impedance of a gas medium can be perfectly decoupled from the SAW loss signal. This is the so-called SAW sensing mechanism using the acoustic impedance effect proposed in this work.
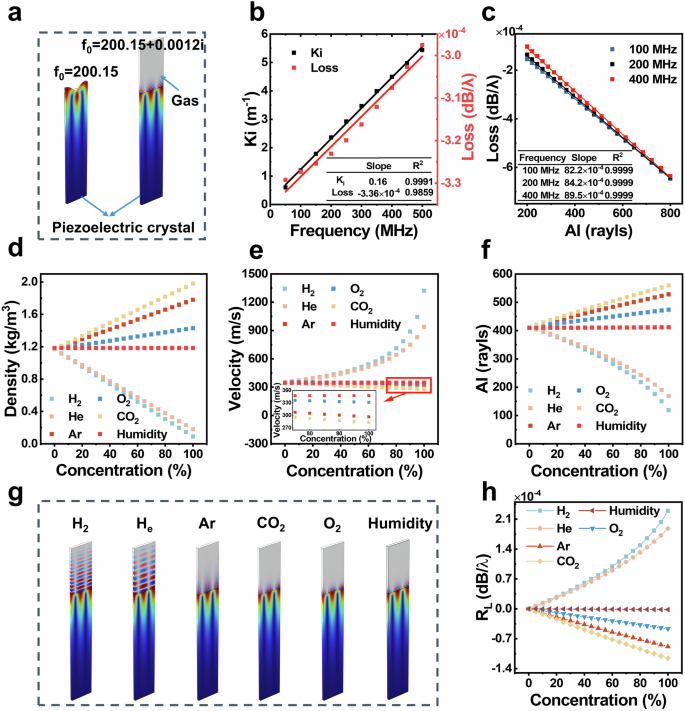
a Wave mode for a 200 MHz single-period SAW chip, both with and without a gas interface. b Imaginary wavenumber and acoustic loss across various operational frequencies. The insert table gives the slope and goodness of fit (R2) of the curve using the least square fitting method. c Influence of acoustic impedance on acoustic loss at different working frequencies. The inset table details the slope and R2 of the fitted curves by the least square method. d Density, e wave velocity, and f acoustic impedance at various concentrations of H2, He, Ar, O2, CO2, and humidity. g Examination of SAW energy propagation at solid/gas interfaces under different upper gas loads. h Response of SAW propagation loss to different concentrations of gases and humidity.
Thus, the SAW propagation attenuation (= insertion loss of SAW chip) can be modulated by the parameters in acoustic impedance (= (rho c)), and (rho ,c) are determined by the composition of the upper gas. So, we induce the relationship between the (rho ,c) and the concentration of different gases or humidity by ideal gas law and law of conservation of mass, as shown in formulas (1–4):
Formula (1) shows the relationship between the mixed gas density ({rho }_{text{mix}}) and the gas concentration c, where ({rho }_{0}) the background gas density, ({rho }_{g}) is the gas density to be measured. Formula (2) gives the relationship between mixed gas velocity ({V}_{text{mix}}) and gas constant R, temperature T, the adiabatic ({gamma }_{text{mix}}) and the equivalent molar mass ({M}_{text{mix}}), where ({gamma }_{text{mix}}) and ({M}_{text{mix}}) is expressed in formulas (3–4), ({M}_{0}) and ({M}_{g}) are molar masses of the background gas and the measured gas, respectively. For air with different humidity, its density and velocity are as follows (5-6)34,35:
In formula (5), ({rho }_{text{RH}}) is the air density with different humidity, where ({P}_{text{air}}) and ({P}_{text{vapor}}) are the pressure of air and water vapor, respectively, and ({R}_{{air}}) and ({R}_{text{vapor}}) are gas constant of dry air and water vapor. Formula (6) gives the velocity of air with different humidity, where ({c}_{0}) is the velocity of dry air under 25 °C, and RH is the relative humidity.
We select five common industrial gases (H2, He, Ar, O2, and CO2) to analyze the wave velocity, density, and acoustic impedance at varying gas concentrations, and to assess the impact of changes in gas concentration on SAW propagation loss. Supplementary Table 1 lists the simulation parameters for the different gases. Figure 1d, e demonstrates a consistent linear relationship between the density/velocity of upper gas and gas/humidity concentration. Additionally, Fig. 1f illustrates significant variations in the acoustic impedance of the gas loading at different gas/humidity concentrations. Consequently, alterations in gas concentration lead to changes in SAW energy. A SAW chip working at the frequency of 200 MHz is utilized to examine the SAW energy coupling at the gas/solid interface. Figure 1g reveals distinct SAW propagation modes under different gas layers, attributed to variations in gas acoustic impedance. In our study, we define SAW loss response as RL = Lc − L0, where Lc and L0 represent the acoustic loss of the SAW chip in the presence of gas (H2, He, Ar, O2, and CO2) and in the background gas. Figure 1h illustrates the SAW loss response at different gas/humidity concentrations. Evidently, changes in SAW propagation loss are positively associated with variations in gas concentration (equivalent to changes in acoustic impedance), enabling accurate decoupling of acoustic impedance changes from SAW propagation loss changes and facilitating the sensing of gas concentration information.
SAW chip based on acoustic impedance effect
To showcase the efficiency of SAW sensing based on the acoustic impedance effect, we fabricated a low-loss delay-line patterned SAW chip (Fig. 2a) by standard semiconductor planar process. 200 MHz was chosen as the working frequency of the SAW chip after considering the gas sensing sensitivity and sensor cost. The fabrication process (see methods and materials, Supplementary Fig. 1a–f) involved depositing aluminum IDTs on the smooth surface of Y35oX piezoelectric Quartz crystal via electron beam evaporation. The transducer adopted single-phase unidirectional transducers (SPUDTs) to control the unidirectional propagation of acoustic waves, thus reducing the SAW chip loss36. The input IDTs with comb structure keep the uniformity of the acoustic velocity to enhance stability within the bandwidth of the SAW chip37. To enhance the acoustic impedance effect, the acoustic propagation path was set to 850λ, λ was the SAW wavelength. As shown in Fig. 2b, the size of the prepared SAW chip was less than 16 mm × 3.5 mm × 0.5 mm. The surface structure of the IDTs, illustrated in Fig. 2c, featured electrode widths of 0.125λ and 0.25λ, respectively, aligning with the SPUDTs structure. The aluminum electrode film exhibited a flat surface with uniform particles (Fig. 2d), and a thickness of 120 nm (Fig. 2e). Further details on the chip structure can be found in Supplementary Table 2. Figure 2f demonstrated a low insertion loss (S21 < −12 dB) at the SAW chip’s center frequency of ~200.03 MHz, enhancing the acoustic sensing stability of the SAW chip9.
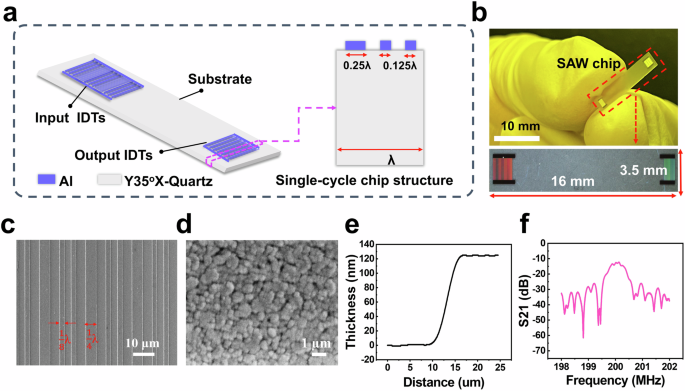
a Structural diagram of SAW chip and single-cycle chip structure based on acoustic impedance effect, b optical image of the prepared SAW chip based on semiconductor plane technology, and the scale of SAW chip is less than 16 mm × 3.5 mm × 0.5 mm. c IDTs structure of SAW chip under optical microscope, d aluminum surface morphology of IDTs characterized by SEM, e electrode thickness of IDTs tested by step meter, and f frequency response of SAW sensor tested by network analyzer.
Gas sensing performances
Wide-ranging and rapid-response gas leakage detection technology was crucial for the energy industry, industrial manufacturing, and various other sectors38. Here, we demonstrated the practical application of a SAW chip utilizing the acoustic impedance effect for gas leakage early warning. Five common industrial gases, namely H2, He, Ar, O2, and CO2, were selected as the sample gases for the SAW chip (referred to Methods and Supplementary Fig. 2 for the SAW sensing system and Supplementary Fig. 3 for the experimental setup). A SAW loss detection circuit with a high signal-to-noise ratio was designed to detect SAW propagation loss (referred to Methods and Supplementary Fig. 3). The system voltage response (Rs) was calibrated at 30 mV = 1 dB (referred to methods and Supplementary Fig. 2). Exposure of the SAW chip to gas concentrations ranging from 95 to 0 v/v% (with a 10 v/v% concentration increment) resulted in rapid changes in the circuit’s voltage response upon gas introduction or removal, as depicted in Fig. 3a. The limit of detection was about 1 v/v% (Supplementary Fig. 8). Furthermore, the amplitude of the SAW chip varied significantly with different gases, attributed to the acoustic impedance differences of the gases (Supplementary Table 1). In Fig. 3b, a comparison between theoretical and experimental results for various gases at different concentrations was presented. Supplementary Note 2 gave the detailed theoretical calculation method of sensor response. The experimental gas detection response closely aligned with the theoretical simulation results, demonstrating consistency, and the detection discrepancies among different gases matched the theoretical expectations from Fig. 1h. The SAW chip based on the acoustic impedance effect had the greatest sensitivity for H2 detection, with a sensitivity of 5.28 × 10⁻² mV/% through one-time linear fitting (Supplementary Fig. 4 illustrated the sensitivity for detecting different gases). The substantial acoustic impedance contrast (Supplementary Table 1) between H2 and the background gas (N2) led to the most significant change in SAW propagation loss. While He and H2 displayed similar impedance trends at varying concentrations (Fig. 1f), the acoustic impedance of Ar, O2, and CO2 gradually increased with rising gas concentration, causing enhanced SAW energy transmission from the piezoelectric crystal into the upper gas and consequently elevating SAW loss. Notably, due to the closer impedance match between CO2 and the piezoelectric crystal, CO2 exhibited a higher reverse response sensitivity during the sensing process (Supplementary Fig. 4 indicated the sensitivity of CO2 was approximately −2.44 × 10⁻² mV/%). Besides, the SAW sensor had a high resolution (Sr) to H2 (~0.001%), He (~0.001%), Ar (0.003%), O2 (~0.008%), and CO2 (~0.002%), which contributed from the high voltage resolution of the SAW sensing system. The SAW chip demonstrated exceptional response speed for five different gases, with a t90 (time to reach 90% of the final equilibrium response) of ~1 s (Fig. 3c), and a rapid recovery speed (t10, time to recover to 10% of the initial voltage) of ~0.5 s (Fig. 3d). Supplementary Fig. 4b, c confirmed the SAW chip’s excellent repeatability (repeatability error < 4%), ensuring sensor stability requirements39. Consequently, the SAW chip, based on the acoustic impedance effect, proved highly competitive in scenarios requiring wide-ranging, rapid response, and recovery capabilities (Supplementary Table 3). For instance, the Sixth Framework of the European Union mandated sub-second rapid response and recovery capabilities for gas detection sensors in H2 concentrations ranging from 4 v/v% to 100 v/v%, a criterion effectively met by the proposed SAW sensing method based on the acoustic impedance effect40. Additionally, a simple experimental platform (Supplementary Fig. 5) and algorithm for calculating the H2 concentration (Supplementary Note 3) were devised to validate the practical application potential of the SAW chip in actual gas leakage scenarios, using H2 as an exemplar. Figure 3e illustrates the real-time response of the SAW chip to H2 leakage, showcasing its prompt detection capabilities and the system’s swift provision of the corresponding leakage concentration value. This excellent H2 leakage detection ability is also due to the small hysteresis error (<0.8%) of the SAW chip (Supplementary Fig. 9). Besides, the measured concentration, lower than that of the hydrogen source, aligned with the diffusion of hydrogen in the air, reflecting a certain concentration gradient41.
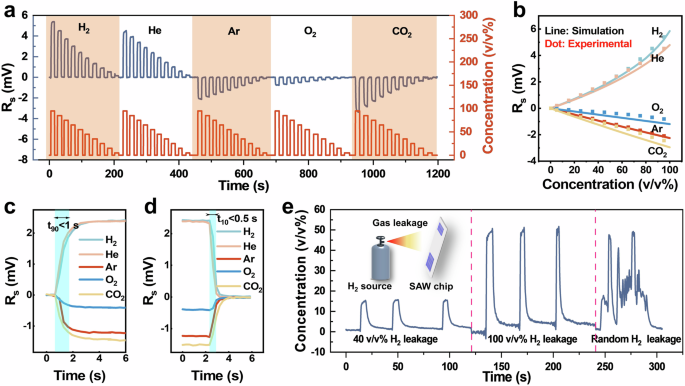
a Transient voltage response of the SAW chip based on acoustic impedance effect at 95–0 v/v% H2/He/Ar/O2/CO2 concentration. b Comparison between theoretical and experimental results of SAW acoustic impedance sensing mechanism. The solid line and the dot represent the theoretical calculation and experimental test results, respectively. c Response time and d recovery time at 55 v/v% H2/He/Ar/O2/CO2 concentration. The blue areas in c and d represent the time intervals of 1 s and 0.5 s, respectively. e Detection of hydrogen leakage concentration of SAW chip under different concentrations of hydrogen leakage sources and arbitrary concentrations.
Respiratory monitoring
Monitoring the breathing rate, depth, and stability of the human body over time offered initial insights into human motion states, physiological conditions, and emotions42,43,44. Generally speaking, the human respiratory cycle lasts 3–4 s, so the sensing element for respiratory detection generally needed a sub-second fast response ability45. Because human exhaled gas was a kind of compound gas that was quite different from the natural environment, the acoustic impedance of the breathing gas was necessarily different from that of the gas initially loaded on the surface of the SAW chip. In order to evaluate the SAW breathing monitoring ability of the acoustic impedance effect adopted in this paper, the volunteer put the SAW sensing system integrated with the SAW chip in a mask (Fig. 4a) and tracked the breathing situation of the volunteer in different human states in real-time (Fig. 4b), including rest state, obstructive sleep apnea syndrome (OSAS), exercise and recovery state. The results revealed varying respiratory intensities (= response amplitudes) of the SAW sensing chip across different human states. Initially, a respiratory response was captured in Fig. 4b. As depicted in Fig. 4c, the amplitude response of the SAW chip exhibited periodic fluctuations corresponding to human exhalation and inhalation. During exhalation, the humidity within the mask increased, leading to elevated SAW loss and decreased response. Conversely, inhalation introduced natural air, reducing mask humidity, lowering SAW loss, and aligning with theoretical humidity response predictions, albeit with some error due to human exhaled gas humidity condensing into water droplets on the sensor surface46 (Supplementary Fig. 6). In addition, real-time feedback on the respiratory rate (RR) of the human body was crucial for medical health monitoring47. We used a systematic algorithm (Supplementary Note 4) to get the real-time breathing rate of volunteers. As shown in Fig. 4d, the breathing rate of the human body was stable at rest, and gradually stabilized after a short acceleration in the OSAS state. However, in the exercise state, the breathing rate of the human body gradually increased with the continuous exercise of volunteers, and the breathing rate slowed down after stopping exercise. Further, we used variance to characterize the stationarity of breathing. As shown in Fig. 4e, the variance of breathing data under rest conditions was the smallest, while the variance under exercise conditions was larger, indicating that the breathing data in Fig. 4b better reflected human breathing stability. As shown in Fig. 4f, Fourier transform analysis of real-time data revealed distinct respiratory frequency information across four human states, with the narrowest bandwidth during rest, broadening during exercise, and reduced amplitude. This variation stemmed from the human body exhibiting a more consistent breathing frequency (fmax = 0.32 Hz) at rest, with short-term apnea in OSAS leading to increased breathing depth and frequency post-recovery, broadening the spectral bandwidth (fmax = 0.36 Hz). The frequency components in exercise and recovery stages indicated urgent and irregular breathing compared to the rest state. In summary, respiratory monitoring based on the SAW acoustic impedance effect effectively tracked human respiratory patterns, providing essential parameters such as respiratory rate, depth, and stability, offering a promising technical approach for human health monitoring.
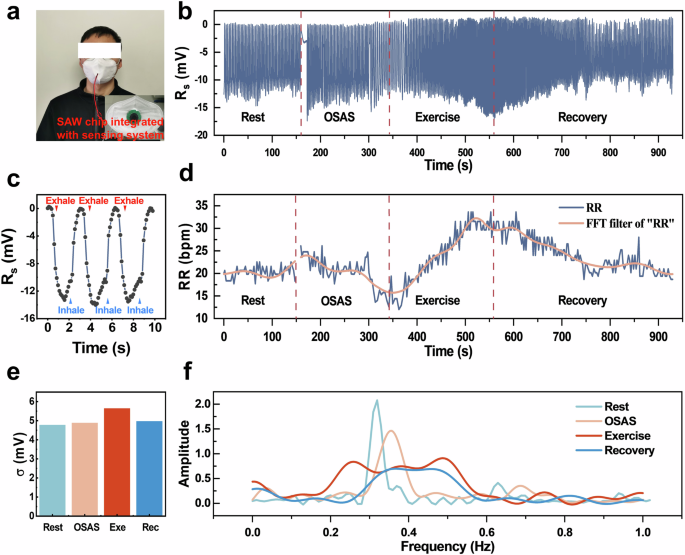
a A SAW chip with an integrated sensing system is placed in the mask worn by volunteers. The surface of the chip is protected by a 3D-printed filter screen. b The real-time response of the SAW chip during the volunteer’s simulated rest, OSAS, exercise, and recovery after exercise. c The dynamic response curve of SAW chip amplification with inhibition and exhaustion of the human body. d The real-time respiratory rate (RR) blue curve of volunteers in different physical states and the RR is smoothed by the Fast Fourier Transform (FFT) filter with a threshold of 100. e The variance is used to represent the breathing stability of the volunteer in different exercise states. f The breathing spectrum of the volunteer in different human states. Note: Informed consent is obtained for the volunteer depicted in this figure.
Conclusion
In summary, the acoustic impedance effect for rapid gas leakage detection and accurate respiratory monitoring by using the SAW chip was first proposed and developed in this study. A SAW sensing model was constructed and proved that an excellent linear relationship existed between SAW propagation attenuation and the acoustic impedance of the gas load on the SAW chip. By applying the conservation of mass and the ideal gas state equation, the corresponding relationship between different gas concentrations and acoustic impedance was derived. Subsequently, a lightweight SAW sensing chip was prepared photolithographically to validate the potential application of the acoustic impedance effect in gas leakage and respiratory monitoring. Experimental findings demonstrated that the SAW sensing chip using the acoustic impedance effect achieved a wide gas detection range (1–100 v/v%), ultra-fast response (t90: 1 s), rapid recovery (t10: 0.5 s), and low detection limit of 1 v/v%. Remarkably, the experiment verified the SAW sensing mechanism based on the acoustic impedance effect. Furthermore, a case of H2 leakage monitoring by a SAW chip using an acoustic impedance effect was successfully realized. Moreover, the breathing detection method, based on changes in gas load on the SAW chip’s surface induced by breathing, enabled real-time monitoring of breathing frequency, depth, and stability in the human body. Consequently, The SAW sensing mechanism and chip proposed in this work, leveraging the acoustic impedance effect, offered a novel approach for on-site gas leakage detection and precise human respiration monitoring.
Methods
SAW device design and fabrication
We used the standard semiconductor planar process to prepare the SAW sensor device based on the acoustic impedance effect. The fabrication process was shown in Supplementary Fig. 1a–g, and Y35X-Quartz33 with low temperature sensitivity coefficient was used as the piezoelectric substrate of the SAW chip (Supplementary Fig. 1a). After washing and drying with anhydrous ethanol, the photoresist was evenly coated on the surface by spin coating (Supplementary Fig. 1b). Using an ultraviolet light source to expose the photoresist after passing through the mask (Supplementary Fig. 1c), the SAW input and IDTs with specific patterns were formed (Supplementary Fig. 1d). Combined with electron beam evaporation technology, aluminum/photoresist/Y35oX-Quartz multilayer medium was deposited on the surface of the device (Supplementary Fig. 1e). Finally, the device used acetone to remove excess photoresist, and the SAW chip with specific aluminum electrode patterns on the surface was obtained (Supplementary Fig. 1f). The electrode thickness was measured by Step meter (KLA-Tencor Alpha-Step IQ), the Al morphology on the electrode surface was collected by atomic force microscope (HITACHI SU8020), and the frequency response of the SAW sensor chip was tested by vector network analyzer (Agilent E5061B).
Gas sensing measurement
Supplementary Fig. 2 was the frame of the SAW gas/humidity sensing test platform. The gas generator (MF-5B) mixed 100 v/v% nitrogen (N2) and 100 v/v% standard gas to prepare the mixed gas of 0–95 v/v% gas to be measured (H2, He, Ar, O2, and CO2) and N2, and the gas flow rate was set at 800 mL/min.
SAW sensing system
Supplementary Fig. 3a collected SAW acoustic attenuation information by amplitude discriminating circuit36. The 200 MHz signal source excited the SAW sensor to generate the SAW propagating along the surface of the substrate, the output interdigital transducer converted the acoustic signal into an electrical signal for output, the amplitude discriminator compared the SAW output signal with the signal source, and the AD converter realized the conversion from analog signal to digital signal. The data was transmitted to the self-made upper computer software to complete the SAW signal acquisition and storage. Supplementary Fig. 3b, c showed that the designed SAW amplitude discrimination sensing system had a small size (<Φ2.5 cm), and the SAW device was packaged in a 500 mL sealed gas chamber to evaluate the real-time gas response of the SAW chip. Supplementary Fig. 3d showed that the SAW sensing system had extremely low baseline noise (Supplementary Fig. 7 for the baseline of the SAW sensing system was about ±15 μV). In addition, the equivalent relationship between the output voltage signal of the amplitude discriminator and the SAW insertion loss was 1 dB = 30 mV, and the response of the SAW H2 sensor (Rs) was defined as Rs = (-30,times,({alpha},-,{{alpha}}_{0})=V,-,{V}_{0}), where α and V were the loss and voltage value of the SAW sensor in the test gas, and ({{alpha}}_{0}) and V0 were the initial loss and voltage value of the device in the background gas, respectively. The SAW gas sensing sensitivity (Sg) was defined as Sg = Rs/con, where con was the gas concentration. The resolution (Sr) of the SAW sensor was defined as Sr = Vr/Sg, where Vr was the voltage resolution of the SAW sensing system.
Responses