Adaptation portfolio – a multi-measure framework for future floods and droughts
Introduction
Climate change will intensify flood and drought events and alter their frequency in conjunction with population growth and economic development1,2,3. Inevitably, to respond to the negative impacts of climate change, there is a persistent need for adaptation planning and implementation, which have continued to increase in at least 170 countries via the formulation of national adaptation plans and policies to enhance their adaptive capacity4,5,6. Despite this significance, quantitative climate change impact studies, including concrete adaptation measures to combat flood and drought events, are limited due to the poor portrayal of human–water interactions in most hydrological models.
In existing hydrological simulation studies, adaptation measures are focused on single hazards7. For example, a number of assessments on adaptation to flood risk have been conducted on global8,9,10 and regional11,12,13 scales. Similarly, the impact of adaptation measures on reducing water scarcity was also quantified14,15,16,17. However, these studies have been limited by considering adaptation measures for either flood or drought hazards, which may limit the ability of the considered measures to combat other types of hazards due to their interplay18,19. Recently, many river basins have experienced both flood and drought events successively. For example, the long-lasted California drought (2011–2016) was followed by a destructive flood in 201720, the rapid transition of the millennium drought (2000–2009) to large-scale flooding in Southeast Australia21, and many more18. Therefore, future adaptation measures should be designed by considering their impacts on both flood and drought, which otherwise inadvertently cause damage from the other hydrological extreme.
Another gap left by earlier studies is that the adaptation measures are constrained to a limited number. Regions vulnerable to hazard risks should be able to adopt at least one potential adaptation measure15. However, this becomes challenging when only a limited set of measures is available, constrained by geographic, environmental, and socioeconomic factors. Furthermore, it has been suggested that the economic losses from floods and droughts would increase substantially unless a more comprehensive approach is taken, which should involve the implementation of multiple adaptation measures in river basins around the world, considering the impact of climate change, population growth, and economic development9,13,15,18,22. Therefore, climate change impact studies with a confined number of adaptation measures focusing on a single hazard will provide limited evidence on the adaptation potential of measures taken to respond to mounting climate hazard risks and their costs, which are critical in regional- or country-scale policymaking.
One approach to overcome these knowledge gaps is developing an adaptation framework comprising a series of adaptation measures that include structural and non-structural options to mitigate both flood and drought risk. This framework should be established with enough flexibility to be easily adapted to different regions because the effects of adaptation measures largely differ due to substantial regional variations in the impacts of climate change4,5. However, such comprehensive hydrological modelling studies are lacking. In this regard, we devised an adaptation framework for alleviating both flood and drought risks under a warming climate by employing the enhanced H08 global hydrological model (GHM; see Methods) that integrates the human-water interaction extensivly23,24,25. The use of the enhanced H08 model enables the evaluation of climate change impacts by incorporating the existing water infrastructures (i.e., prevailing human efforts in the past) and various adaptation measures based on human interventions (i.e., possible human efforts in the future). GHMs are designed for applications including data-sparse regions, which provide flexibility to conduct this study.
The adaptation framework includes a total of seven measures that are based on (i) irrigation efficiency, (ii) retention area, (iii) canal characteristics, (iv) dam capacity, (v) dam operation rule, (vi) dam construction, and (vii) reforestation (Fig. 1). In this study, the term adaptation is defined as the measures taken to combat the climate change impacts in addition to the existing structural and non-structural measures. Based on this definition, three scenarios were constructed as follows: (i) no adaptation (NAD) – existing structural and non-structural measures, (ii) standard portfolio (STD) – NAD together with seven adaptation measures (structural and non-structural) of moderate effects, and (iii) ambitious portfolio (AMB) – NAD together with seven adaptation measures (structural and non-structural) of ambitious effects (if not available, moderate effects were chosen). The AMB portfolio is relatively difficult to achieve economically and socially. Two sub-scenarios, ‘with reforestation’ (AMB-WR) and ‘without reforestation’ (AMB-WOR), were also presented under the AMB scenario (Fig. 1) to investigate the effect of reforestation on water risk reduction (see Methods for the adaptation framework). To carry out the model simulations, three bias-corrected general circulation models (GCMs) combined with two representative concentration pathway (RCP4.5 and RCP8.5) scenarios from 2080–2099 were used along with the historic scenario from 1980–1999 (see Methods).
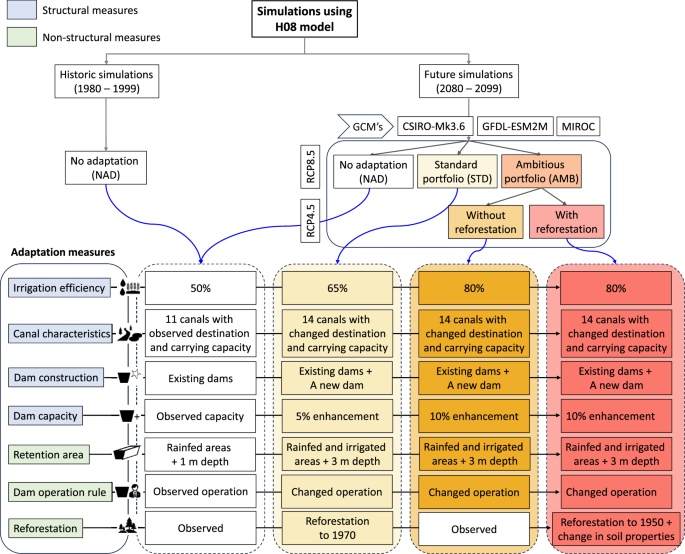
The framework includes three main scenarios of (i) No adaptation (NAD) – existing structural and non-structural measures, (ii) Standard portfolio (STD) – NAD together with seven adaptation measures (structural and non-structural) of moderate effects, and (iii) ambitious portfolio (AMB) – NAD together with seven adaptation measures (structural and non-structural) of ambitious effects (if not available, moderate effects were chosen). The AMB portfolio has been divided into two categories of (a) without reforestation (AMB-WOR) and (b) with reforestation (AMB-WR). The structural adaptation measures are represented by the blue colour, whereas the non-structural measures are illustrated using the green colour. The figure also shows the three general circulation models (GCMs) employed under RCP4.5 and 8.5.
The designed framework was applied in the Chao Phraya River basin (CPRB; see Methods), Thailand, because Southeast Asian countries are recognized as vulnerable to climate change impacts and are projected to suffer more than the global average3,26,27,28. The CPRB is the largest basin in Thailand; it encompasses the capital city of Bangkok and has experienced several hydrological hazards in recent years29,30,31. Some recent studies have evaluated the applicability of various adaptation measures in basin28, including afforestation, reservoir operation, and diversion canal operation13,22,32, but their interactions and integration have not yet been investigated. Simulations were performed to examine the effect of different adaptation portfolios on future flood and drought risks using the number of flooding days and drought month indices (see Methods) in six representative sub-basins within the basin (see Methods for the selection of sub-basins). Four of the six sub-basins are in the upper basin (Ping, Wang, Yom, and Nan), one is in the mid basin (Nakhon Sawan; C.2 in Fig. 2b), and the remaining one is situated in the lower CPRB (Ayutthaya; C.35 in Fig. 2b).
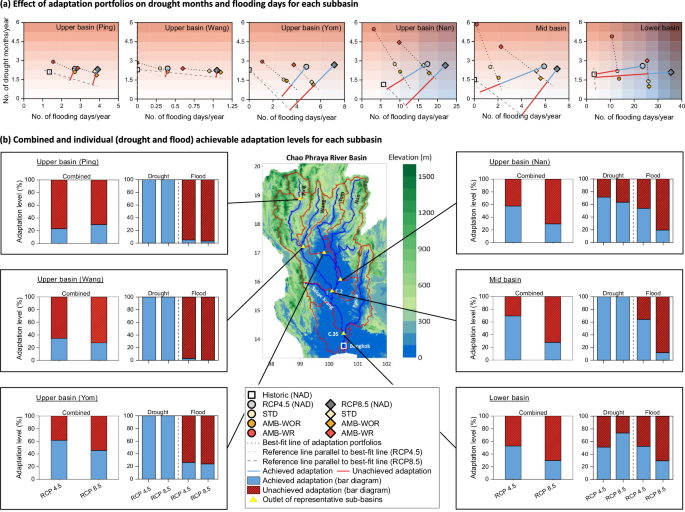
a The effect of adaptation portfolios on the number of flooding days and drought months at the representative sub-basins in the historic (1980–1999) and future (2080–2099) simulations. The x-axis shows the number of annual average flooding days, and the y-axis represents the number of annual average drought months. The background colour of the plot portrays the severity of flood risk (along x-axis) and drought risk (along y-axis). A best-fit line (dotted line) was drawn through the STD, AMB-WOR, and AMB-WR portfolios. The Euclidean distance (blue solid line) between the NAD scenario under RCP4.5 and 8.5 and adaptation portfolios (best-fit line) was estimated. Two imaginary reference lines were drawn through the ‘Historic NAD’ scenario that are parallel to the best-fit lines of RCP4.5 (light grey dashed line) and 8.5 (dark grey dashed line). The Euclidean lines of RCP4.5 and 8.5 were further extended (red solid line) until they intersect with the corresponding imaginary reference lines, which will provide an idea about the additional adaptation required to reduce risk to the present level. The Euclidean line and the extended Euclidean lines were translated into the combined achieved (blue bar) and unachieved adaptation (hatched red bar) levels, respectively, in (b). b Middle panel: The topographic map of the Chao Phraya River Basin with major tributaries of the Ping, Wang, Yom, and Nan in the upper basin and the Pasak and Sakae Krang tributaries in the lower basin. The confluence of the Ping and Nan Rivers at Nakhon Sawan (Station ID C.2) is the beginning of the Chao Phraya River. The map also shows the selected representative sub-basins: upper basins of the Ping, Wang, Yom, and Nan; mid basin of Nakhon Sawan; lower basin of Ayutthaya (Station ID C.35) in the basin with the location of the Bangkok City. Left and right panels: Combined and individual (drought and flood) adaptation levels under RCP4.5 and 8.5 derived from the adaptation portfolios.
Results
Flood risk
The effects of different adaptation scenarios (NAD, STD, AMB-WOR, and AMB-WR) on flood risk (the x-axis of Fig. 2a) were evaluated in selected representative sub-basins of the CPRB. The results indicate that the flood risk will increase in the future driven by climate change (NAD scenario), with high flood severity in the upper (Nan) and lower sub-basins, where flooding can occur for nearly 3–5 weeks annually under the extreme warming scenario (RCP8.5). This can be attributed to the very flat terrain (middle panel of Fig. 2b) combined with the low river channel carrying capacity in these sub-basins (890 m3/s and 1179 m3/s in the Nan and lower sub-basins, respectively; Supplementary Fig. 1), irrespective of the substantial runoff received. The annual average basin runoff was projected to increase drastically by 31% and 48% under RCPs 4.5 and 8.5, respectively, with higher values occurring near the mid and lower sub-basins (Supplementary Fig. 5j–l). In the remaining sub-basins, flooding can occur for a maximum of one week per year under RCP8.5.
Owing to the implementation of several adaptation portfolios in the model simulation, the number of flooding days decreased substantially in the STD portfolio, except for the Ping and Wang upper sub-basins (Fig. 2a). The effects of the STD and AMB-WOR portfolios were similar in reducing the number of flooding days, whereas a differing behaviour was noted for the AMB-WR portfolio, which exhibited the greatest flood risk reduction. The AMB-WR portfolio succeeded in reducing the flood risk (i) to the historic level under RCP4.5, except for the lower sub-basin, and (ii) to the RCP4.5 level under RCP8.5 in all sub-basins. Under the AMB-WR portfolio, the basin-wide increase in evapotranspiration and decrease in runoff were nearly 11% and 26% under RCP4.5 (7% and 15% under RCP8.5), respectively, which resulted in an enormous reduction in flood risk. The effect of reforestation was limited in the lower sub-basin due to quite limited reserves in the river channel carrying capacity, with a slight difference between the number of flooding days under the AMB-WOR and AMB-WR portfolios.
Although an extensive reduction in the total number of flooding days was achieved under the AMB-WR portfolio (Fig. 3a), this intense portfolio was inadequate for managing extreme flood flows (flows above the Q1 value – the 99th-percentile flow values) in the basin, especially in historically flood-prone areas (Fig. 3b). Aside from the extreme flood flows, the AMB-WR portfolio was able to decrease the number of moderate flooding days (flood flows between Q1 and Q5) by 78% and 42% under RCP4.5 and RCP8.5, respectively (Fig. 3c). However, flood risk remained in the flood-prone upper (Nan) and lower sub-basins with one and two weeks of flooding in a year, respectively. Considering the number of small flood flows (flood flows below Q5), the flood risk was entirely mitigated by the portfolios under RCP4.5 and RCP8.5, except for the lower sub-basin, which experienced prevailing flooding for one week under RCP8.5 (Fig. 3d). As noted earlier, the adaptation portfolios were meagre in reducing extreme flood events below the river channel carrying capacity corresponding to 50- and 100-year return periods (Supplementary Fig. 12). The mid and lower sub-basins had similar discharges for the 5-, 10-, 50-, and 100-year return periods (Supplementary Fig. 12); however, excessive flood risk was noted in the lower sub-basin due to the relatively low carrying capacity (Supplementary Fig. 1b).
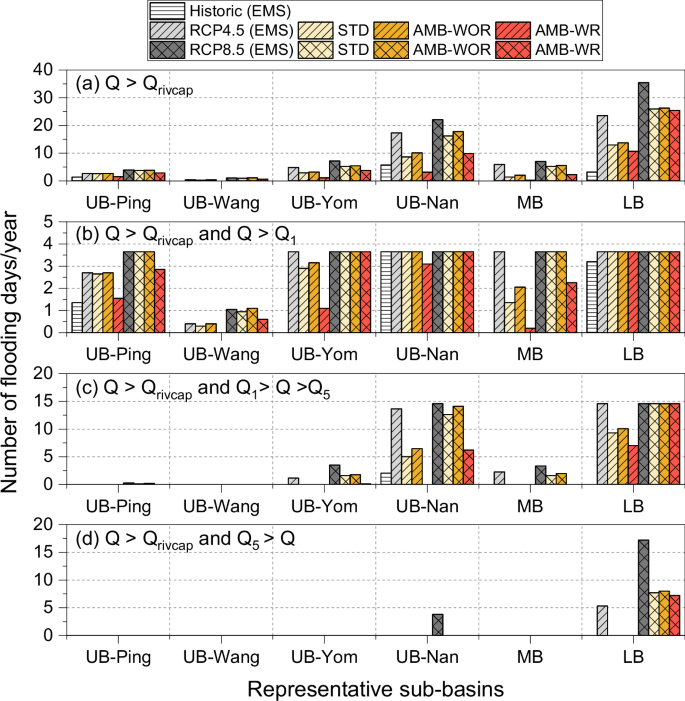
a All floods – the total number of flooding days counted as whenever the daily discharge (Q) exceeds the river channel carrying capacity (Qrivcap), b Extreme floods – the number of days during which the daily discharge exceeds both river channel carrying capacity (Qrivcap) and 1-percentile extreme values (Q1), c moderate floods – the number of days during which the daily discharge exceeds the river channel carrying capacity (Qrivcap) and falls between the 1-percentile (Q1) and 5-percentile values (Q5), d small floods – the number of days during which the daily discharge exceeds the river channel carrying capacity (Qrivcap) and falls below the 5-percentile values (Q5). The panels b–d are the breakdown of panel a, which is same as the horizontal axis of Fig. 2a. The UB, MB, and LB abbreviations in the x-axis represent the upper basin, middle basin, and lower basin, respectively.
Drought risk
The selected representative sub-basins will experience an increase in the number of drought months from 1-2 months (historic scenario) to 2-3 months (future scenario) in a year due to the individual effects of climate change (the y-axis of Fig. 2a). For the mitigation of drought risk to the historic level, the AMB-WOR portfolio seems to be the best strategy under both RCP4.5 and RCP8.5, except for in the upper Nan sub-basin. The effects of the AMB-WOR and STD portfolios were almost identical but with a slightly elevated performance by the AMB-WOR portfolio. The AMB-WR portfolio critically enhanced the number of drought months, reaching a maximum of 3 months in the upper sub-basins (Ping, Wang, and Yom) and 5-6 months in the remaining sub-basins under RCP4.5, which can be ascribed to the increased basin-wide evapotranspiration (11%) resulting from land use change. The adaptation was found to be more effective under RCP8.5 due to the increased basin-wide water availability resulting from increased projected basin-average precipitation (20%) and reduced evapotranspiration (7%) compared with those under RCP4.5 (13% and 11%, respectively; Supplementary Fig. 5d–f, g–i).
Effect of adaptation on flood-drought interaction
The effectiveness of the STD and AMB-WOR adaptation portfolios were reasonably similar in mitigating the flood and drought risk (Fig. 2a) and portrayed positive feedback on both hazards. On the contrary, the AMB-WR portfolio exhibited positive and negative feedback on flood and drought risks, respectively. This difference in performance between the three portfolios can be mainly attributed to three adaptation measures (Fig. 1): (i) irrigation efficiency improvement, (ii) dam capacity enhancement, and (iii) reforestation.
An increase in efficiency to 80% in the AMB portfolio resulted in a substantial cutback of 32% in the withdrawn basin-wide irrigation water compared with a decrease of 19% under an efficiency improvement of 65% in the STD portfolio (Supplementary Fig. 7). Both options resulted in increased water availability (Supplementary Fig. 9a, b and Supplementary Fig. 10a, b) but also intensified the flood risk (Supplementary Fig. 8a). Reforestation, however, showed great potential for alleviating future flood risk, with flood discharge reduction rates of 5–10% and 15–40% under the STD and AMB–WR portfolios, respectively (Supplementary Fig. 8e), while having a negative impact on water availability due to exacerbated evapotranspiration (Supplementary Fig. 9i, j and Supplementary Fig. 10i, j). These effects may have regional differences based on the irrigated area (Supplementary Fig. 4c, d), which is highest for the mid and lower sub-basins. The trade-offs between the adaptation measures of irrigation efficiency improvement and reforestation were stark, particularly in the STD portfolio, which showed slightly better flood protection compared with the AMB-WOR portfolio (Fig. 2a), which lacks reforestation measure. On the other hand, the AMB-WOR portfolio provided greater protection against drought in all the considered sub-basins (Fig. 2a). In the AMB-WR portfolio, the efficiency improvement measure cannot compensate for the reforestation due to the extensive evapotranspiration and eventually exacerbated water scarcity.
The dam capacity enhancement from 5% (STD) to 10% (AMB) had little impact on future flood and drought risk reductions compared with the other adaptation measures based on dams (Supplementary Fig. 8b, Supplementary Fig. 9c, d, and Supplementary Fig. 10c, d). This indicates that a 5–10% capacity enhancement of small- or large-scale dams cannot offer notable protection. Some previous studies have shown that river basins could benefit from the doubled storage capacity of dams13,14, which may raise the bar for feasibility.
Although efficiency improvement and reforestation measures have cascading effects on flood and drought risk reductions, respectively, the remaining adaptation measures portrayed positive feedback on both flood and drought risk. The modified reservoir operation rules reduced the water risk to a greater extent in the upper (Nan), mid, and lower sub-basins. Decreases of nearly 16% (RCP4.5) and 14% (RCP8.5) in flood discharge were observed in the mid-basin (Supplementary Fig. 8c) due to additional water storage in the existing large-scale dams (Bhumibol and Sirikit Dams; Supplementary Fig. 1 and Supplementary Table 1). Simultaneously, this increased storage from the wet season enhanced the water availability in the subsequent dry season (Supplementary Fig. 9e and Supplementary Fig. 10e) and reduced the number of drought months. The construction of a large-capacity dam attenuated the flood discharge (Supplementary Fig. 8c; on average 8% reduction in both RCP scenarios) and water scarcity issues (Supplementary Fig. 9f and Supplementary Fig. 10f) to a large extent; however, its effect diminished further downstream, and similar findings were reported in previous studies13,33,34. Canal systems demonstrated considerable potential for flood mitigation by diverting an additional 13% (3.35 km3/year) and 18% (5.14 km3/year) of river flow under RCP4.5 and RCP8.5, respectively, although they were highly region-specific (Supplementary Fig. 8d). The retention areas reduced the flood risk by providing storage space of 9640 (times)106 m3, which was nearly 9 and 6 times greater than that under the NAD scenario (1037 (times)106 m3) and observed (1702 (times)106 m3) retention storage, respectively. This increased water diversion and retention storage complemented the irrigation water supply, but only in the lower basin where most of the canals are located (Supplementary Fig. 9g, h and Supplementary Fig. 10g, h).
The results indicate that the measures implemented to reduce flood hazard may inadvertently result in an increase in drought risk, which was noted in earlier works18,35. Developing adaptation measures will, therefore, be challenging because some basins could experience an increase in both flood and drought hazards, whilst others may see an increase in one hazard and a decrease in the other. Therefore, this study underscores the necessity for (i) shared adaptation measures that can be beneficial to both floods and droughts due to their interrelated nature and (ii) measures that maintain a trade-off in controlling the flood and drought risk.
Adaptation levels
The effect of adaptation portfolios was site-specific, making it difficult to evaluate how effective the implemented adaptation measures were on an aggregate scale. To quantify this difference, Euclidean distance (ED)36 was used to estimate the achieved adaptation level in different sub-basins (see Methods for the calculation of ED and adaptation level). The combined achieved and unachieved adaptation levels are illustrated as the green and red solid lines, respectively, in Fig. 2a. However, due to the difficulties in interpreting the adaptation levels from Fig. 2a because of different x-axis scales, a bar diagram illustrating the combined achieved and unachieved adaptations was plotted corresponding to each sub-basin (bar diagram in Fig. 2b). All the sub-basins were able to adapt to more than half of the required adaptation under RCP4.5, except for the upper sub-basins (Ping and Wang). However, under the RCP8.5 extreme warming scenario, the adaptation potential was significantly reduced to nearly 30% due to the increase in extreme events. This stark reduction in adaptation potential underscores the severe impact of extreme events on the basin’s water risk, even with the AMB portfolio in place.
Further, to quantify which hazard is minimizing the adaptive capacity of sub-basins, individual drought and flood adaptation levels were estimated from the combined adaptation levels as shown in Fig. 2b. In most of the sub-basins, the droughts were adaptable either to the present level or below the present level, whereas the adaptation failed to mitigate floods and hence the achieved flood adaptation levels were smaller in comparison with achieved drought adaptation levels (Fig. 2b). Hence, it is clear that the unachieved adaptation (combined) was mainly emerging from the unadaptable floods in the sub-basins. In such basins, the priority could be flood adaptation because the drought adaptation seems relatively effortless based on the adaptation portfolios.
Economic analysis
Climate change adaptation tends to be costly. The implementation cost of the STD portfolio was nearly 30.8 billion USD (Supplementary Fig. 11), of which 72% is the combined cost of the structural measures, the measures with the highest expected cost estimates37. The cost of the STD portfolio constitutes approximately 6% of the Thai gross domestic product (GDP) of 2021. The total cost of the AMB-WOR portfolio is around 25.9 billion USD (nearly 5% of the Thai GDP). The exclusion of reforestation measures from the AMB-WOR portfolio reduced the implementation cost by nearly 16% compared with the STD portfolio. Conversely, the AMB-WR portfolio topped the list with a share of nearly 12% of the Thai GDP (59.8 billion USD). This high share mainly originated from the large-scale reforestation in the CPRB. The reforestation alone costs approximately 33.9 billion USD and the exclusion of reforestation from the AMB-WR portfolio drastically reduces the adaptation cost by 57%. Despite the considerable impact of reforestation measures on flood control, the challenges of changing the vast current land use to forest areas make this measure seemingly unattainable. However, this study has examined the maximum level of achievable adaptation from reforestation. In general, non-structural measures take precedence over structural measures due to their lower cost (Supplementary Fig. 11), with the exception of reforestation. The specifics of the cost analysis can be found in Supplementary Table 4.
Among the three adaptation portfolios, both STD and AMB-WOR portfolios offered similar flood and drought risk protection (Fig. 2a) at relatively low and comparable cost (Supplementary Fig. 11). The AMB-WR portfolio, while having the highest potential to mitigate flood risk, faced economic feasibility limitations. Furthermore, it does not mitigate the future flood risk (under RCP 8.5) to the present level at the considered sub-basins (Fig. 2a), even with its extensive implementation cost. Therefore, for the flood-vulnerable CPRB, the STD portfolio emerges as the most effective option, providing slightly better flood protection for an additional cost of 4.9 billion USD compared with the AMB-WOR portfolio. Despite the relatively higher implementation cost of adaptation portfolios compared to the climate adaptation funding needed by developing countries37, it is a reasonable investment. This is particularly evident when considering the staggering damage cost of 46.5 billion USD (12.6% of the Thai GDP) resulting from the 2011 floods in Thailand13, underscoring the urgent need for effective adaptation strategies.
Discussion
Many of the climate change impact assessment studies conducted in the past overestimated the flood and drought risks by neglecting human interactions (i.e., existing infrastructures) and adaptations (i.e., additional measures that will be taken) with the water cycle in the modelling system19,26. In this study, this fundamental issue was solved by synchronizing various anthropogenic activities into the H08 macroscale hydrological model, and the model was further expanded by incorporating different adaptation portfolios designed to mitigate both flood and drought risks in the context of climate change. The portfolios were primarily effective in mitigating water scarcity to the present level but not flood risk under future scenarios (Fig. 2), which is consistent with previous studies that demonstrated a large increase in flood frequency in Southeast Asia3,26,27,28. The projected increases in the basin’s annual average precipitation were nearly (on average and ±standard deviation across GCMs) 13.4 ± 6.1% under RCP4.5 and 20.2 ± 12.3% under RCP8.5, which made the basin vulnerable to floods.
Similar to CPRB, many basins/regions around the world are naturally flood-prone due to the heavy precipitation38, low channel carrying capacity39, and topography40. Regardless of how intensively the adaptation measures were taken, not all disasters can be prevented in the future41, particularly in flood-vulnerable regions. In CPRB, the implemented adaptation measures will be sufficient to mitigate the flood risk if the intermediate warming scenario (RCP4.5) is the case in the future, whilst if the extreme warming scenario (RCP8.5) is close to reality, additional protection measures are essential. For such regions, physical flood occurrence cannot be prevented, whilst the loss and damage can be further reduced through additional measures such as early warning systems41, migration from the affected areas to reduce the population exposure to flood hazard18, social protection and risk financing instruments42, spatial planning of new urban areas by enforcing building restrictions in flood-prone areas12, raise the floor levels of the buildings43, availability of relocatable dwellings43, etc.
Although the basin is flood-vulnerable, the adaptation measures taken should maintain a trade-off to reduce the flood and drought risks using a holistic risk management approach, a necessity that was identified by earlier studies18. Despite this fact, studies on water risk reduction usually focused on either the effects on floods or droughts by neglecting the fact that these are two hazards of the same hydrological cycle that could mislead policymakers because it extracts only one side of the basin water management. For instance, although the AMB-WR portfolio offered higher flood protection than the other portfolios, it exacerbated water scarcity due to the increased basin-wide evapotranspiration resulting from reforestation. It was reported that reforestation can lead to decreased dry season flow due to increased evapotranspiration and cause water scarcity18,32,44, which is the case for the CPRB. Such drought conditions could decrease subsequent flood occurrence due to the slow revival of the depleted subsurface storage and make drought-to-flood events less extreme through drought-flood interaction45. Human interventions can largely affect this drought-flood interaction by altering the storage depletion and land-surface conditions46. Reforestation measure can also be implemented for drought risk reduction by increasing the soil water infiltration, which will further enhance groundwater recharge and provide springs and rivers with baseflow during dry period18,47,48,49.
The changes in river discharge are non-linearly sensitive to global warming50,51, and the level of required adaptation highly varies with the warming scenarios used to simulate the river discharge. Developing adaptation portfolios will become complex for such regions because the right combination of measures varies substantially, subject to levels of risk, funding, and political will41. Indeed, these portfolios should include region-specific optimum solutions to fit diverse geography, hydrology, and climate change impacts. However, often, this local implementation of adaptation measures may not be sufficient in mitigating the underlying causes resulting from global factors52 although it could mitigate the hazard regionally. Besides, flood mitigation solutions may not be available to all regions, especially in low- and middle-income countries, due to socioeconomic and environmental constraints.
Uncertainties are unavoidable in climate change simulations. The sources of uncertainties in this study can be outlined as follows: (i) The outcomes depend strongly on the warming scenarios (RCP4.5 and RCP8.5) and the GCMs used in the simulation. Although this study employed three GCMs under each warming scenario, uncertainties remain on how extreme and severe the future discharge can be. The assessments can be made more reliable by enhancing the number of GCMs, which further reduces the uncertainty in the outcomes. (ii) The socio-economic conditions within the basin are kept unchanged for future simulations, which may attribute some uncertainties to the discharge prediction by the H08 GHM. (iii) The spatial and temporal resolutions of the enhanced H08 model were five arcminutes and one day, respectively. An improvement in these resolutions could limit the simulation uncertainties. (iv) Lastly, the operation of existing infrastructures (e.g., the capacity of dams and canals) is assumed to be maintained throughout the simulation period, which could also propagate notable uncertainties.
Although such uncertainties remain, to the best of our knowledge, this is one of the most comprehensive studies that developed a multi-measure-multi-hazard adaptation framework comprising ten options with moderate and ambitious effects to combat future floods and droughts. This framework was designed with enough flexibility to adapt to different regions and hydrological models. Our findings increase the understanding of interactions and feedback between adaptation measures that would contribute to improved flood and drought management and augment future studies predominantly focusing on multiple hazards. This study also provides a warning signal to the river basins around world that a highly regulated river system with as much as infrastructures was unable to adapt to future floods, so as the moderately regulated and pristine rivers.
Methods
Enhanced H08 model
H08 is one of the pioneering global hydrological models (GHMs) that explicitly considers human–water interactions23,24. The model consists of six modules—land surface hydrology, river routing, crop growth and irrigation, reservoir operation, environmental flow, and anthropogenic water withdrawal—to distinctly represent human water abstraction23,24,53 The standard spatial and temporal resolutions of the model are 0.5° × 0.5° and one day, respectively, on a global scale. One of the remaining challenges of the H08 model was the inclusion of diversion canal operation, which plays a critically important role in reducing flood and water scarcity risks (by diverting river flows and supplying the same to agricultural lands).
To overcome this limitation, the authors recently implemented diversion canal systems and associated retention areas by considerably modifying the original river routing module of the H08 model25. The diversion canal system reflects the major channels and bifurcated tributaries in the CPRB. Afterwards, the modified river routing module and the other five modules were coupled to build the enhanced H08 GHM for the CPRB. Furthermore, to include region-specific information, other adjustments were also made to the global setup of the H08 model. First, instead of the global parameters, the eight key parameters of the land surface hydrology module were derived for the CPRB region, in which the parameters were calibrated at Nakhon Sawan (Supplementary Table 3). Second, we adapted the model to the calculation domain of 13–20°N and 97–102°E at a finer spatial resolution of 5′ × 5′ on a longitudinal and latitudinal grid. Finally, the generic operation rules of reservoirs in the global setup were improved by including the wet and dry season release rates and the upper rule curve based on the observed historical operation of reservoirs in the CPRB. This upgraded reservoir operation model can be implemented easily elsewhere if long-term operation records are available13,54. This enhanced H08 model was intensively calibrated and validated using in-situ observations25. For simulations in the present study, the same model setup for the CPRB from our previous study was maintained13,22,25, except for the introduction of implicit canal systems. Implicit canal systems were also implemented in the enhanced H08 model to enable water transfer to grid cells that are far from the river channel regardless of the existence of canals. This method allows water transfer to a maximum of five grid cells ahead (approximately 50 km), representing small-scale irrigation canals and water work pipelines seen everywhere in the world. For a detailed explanation of the implementation of the implicit canal scheme, see Hanasaki et al.55.
Chao Phraya River Basin
The Chao Phraya River basin (CPRB) is the largest basin in Thailand, which is the second-largest economy in Southeast Asia and has incurred severe economic losses (more than USD 1.75 billion), mainly from floods, storms, and droughts during 1989–2002, of which 71% of these losses are from the agricultural sector28. A major share of the country’s agricultural areas, which have an area of approximately 158,000 km2, is cradled by the CPRB. The river basin includes Thailand’s capital city, Bangkok, where 50% of the basin’s population is located; this region generates almost 80% of the basin’s gross domestic product56 and has experienced several hydrological hazards in recent years29,30,31. The upper CPRB has four tributaries, Ping, Wang, Yom, and Nan, and these tributaries meet at Nakhon Sawan (C.2 station in Fig. 2b), where the Chao Phraya River begins and gradually empties into the Gulf of Thailand. Two other tributaries of the Pasak and Sakae Krang Rivers join the Chao Phraya River in the lower basin. Large reservoirs and diversion canal systems highly regulate the river flow in the CPRB. The existing water infrastructures in the basin, including dams and canal systems, are shown in Supplementary Fig. 1.
Reservoirs
Existing reservoirs considerably influence the hydrology of Thailand. The Global Reservoir and Dam Database (GRanD57) lists 39 dams in Thailand. Among them, eight large-scale reservoirs in the Chao Phraya River system, with a storage capacity greater than 0.1 (times)109 m3, were used for the analysis (Supplementary Fig. 1; Supplementary Table 1). Bhumibol (in the Ping River) and Sirikit (in the Nan River) are the two major reservoirs in the CPRB, with a combined storage capacity of 23 (times)109 m3. The reservoir operation data of the eight existing reservoirs were obtained from the Electricity Generating Authority of Thailand (EGAT) and the Royal Irrigation Department (RID).
Canal systems
The CPRB is a complex river network with several natural and artificial diversion canals. These canals are operated to alleviate flood risk in the wet season and to supply irrigation water during the dry season. In the basin, 11 existing canal systems were identified to have a direct water intake from the river channel (Supplementary Fig. 1; Supplementary Table 2) by literature review58,59 and based on maps collected from the RID. Among the 11 canals, two are located in the Yom basin and divert floodwater from the Yom River to the Nan River, downstream reaches of the Yom River, and nearby low-lying paddy fields during floods (Supplementary Fig. 1a). The remaining nine canal systems are in the lower CPRB. The Chao Phraya diversion dam allocates water into five canal systems, namely, Chainat–Pasak, Makhamthao–Uthong, Tha Chin, Noi, and Chainat–Ayutthaya lying upstream of this dam to alleviate downstream flooding and irrigation in its command area. Downstream of the Chao Phraya Dam, there are four more canal systems, namely, Lopburi, Bang Kaeo, Phong Pheng, and Bang Ban. The observed river and canal carrying capacities at various locations in the CPRB are shown on the right-hand side of Supplementary Fig. 1. The carrying capacity of the river progressively decreases from Nakhon Sawan (C.2 station) to Ayutthaya (C.35 station), which will create frequent flood issues in the lower basin (Supplementary Fig. 1b). Further details of the existing canal systems in the basin can be found in our previous study25.
Representative sub-basins
Six economically active representative sub-basins in the CPRB with distinct hydrological characteristics were selected to assess the effect of adaptation portfolios. The Ping and Wang sub-basins lie in the upstream mountainous part of the basin, with multiple small-scale dams upstream that moderately regulate the flow (Supplementary Fig. 1). The largest dam in the CPRB, the Bhumibol dam (with a storage capacity of 13,462 (times)106 m3), is located in the middle part of the Ping River. The Yom and Nan sub-basins have flat terrain in the lower reaches (Fig. 2b), which makes them prone to flooding. The Yom sub-basin has no major upstream dams, while the Nan sub-basin has a large-scale dam (Sirikit dam with a storage capacity of 9510 (times)106 m3) upstream for flow regulation. In addition to the dam, two major canal systems that divert floodwater from the Yom sub-basin to the Nan sub-basin also manage the river flow in these sub-basins. The Nakhon Sawan (C.2 station in Fig. 2b) is the confluence of the two upstream tributaries in the mid-basin, where the upstream dams heavily influence the flow. Downstream of Nakhon Sawan is a flat terrain where the Ayutthaya sub-basin (lower basin) is located. The Ayutthaya sub-basin is vulnerable to flooding due to its small river carrying capacity and proximity to the sea. This lower sub-basin flow is highly regulated by upstream dams and canal systems.
Adaptation framework
Seven adaptation measures were constructed in this framework to combat future flood and drought risks due to climate change impacts. For flood hazard, there are three basic solutions, namely, more-storage (through retention storage, new dam construction, dam capacity enhancement, and changing the dam operation rule), faster/safer-drainage (by changing the canal characteristics), and less-runoff (through reforestation). For drought hazard, there are basically demand-side and supply-side solutions. The former includes (i) increasing the irrigation efficiency to reduce water loss, and the latter includes (ii) retention storage, (iii) new dam construction, (iv) dam capacity enhancement, (v) changing the dam operation rule, and (vi) changing canal characteristics measures to enhance sectoral water supply. They are described below in detail.
Irrigation efficiency (structural measure)
The surface-water irrigation system in the CPRB has 50% efficiency60,61 and the remaining 50% of the undelivered water can be categorized into return flow to the river and conveyance loss24. The use of efficient irrigation systems can reduce conveyance loss and increase water availability. Eventually, this enhances the irrigation efficiency, indicating a shift from prevailing surface irrigation to micro-irrigation systems and transport through pressured pipelines instead of open channels14. A previous study14 evaluated the effectiveness of improving irrigation efficiency in reducing water scarcity in five South Asian River basins. Based on that, in this study, two levels of irrigation efficiency improvement were considered as adaptation options based on their impact: (i) moderate, in which the efficiency increased to 65%, and (ii) ambitious, in which the efficiency increased to 80%. The moderate level represents an adaptation strategy that is relatively easy to achieve, whereas the ambitious level indicates the maximum level of adaptation achievable in that region. The efficiency increases were spatially uniform within the basin, irrespective of regional differences for simplicity.
Retention area (non-structural measure)
In the base model22,25, the areal fraction of rainfed croplands62, presumably located near the canal route (Supplementary Fig. 1), was regarded as the areal fraction of retention areas because in most Southeast Asian countries, rainfed cropland comprises low-lying paddy fields that are natural floodplains and cannot be cultivated during the rainy season because of flooding33. The depth of water storage in these retention areas was assumed to be 1 m based on recommendations from the RID25. In this study, the retention areas were enhanced as an adaptation measure to increase water storage as follows:
-
a.
Increased depth of retention areas: According to Haruyama et al.63, the depth of floodwater inundation in the basin ranges between 1 and 5 m based on geomorphology. Therefore, an average water holding depth of 3 m was assumed for the retention areas instead of 1 m21.
-
b.
Areal extension of retention areas: The adaptation of irrigated agricultural lands to retention areas is one of the flood countermeasures proposed by the Strategic Committee for Water Resource Management (SCWRM), Thailand master plan64. Generally, at the time of flooding, no irrigation is applied to paddy fields. Therefore, in addition to rainfed croplands59, irrigated paddy fields located near canal routes were also considered as retention areas.
The above two options together constitute the retention area adaptation measure with moderate effect, and there is no ambitious option for this measure. Furthermore, to increase protection against climate change effects, water supply from retention storage was enabled to meet domestic, industrial, and irrigation water demands.
Canal characteristics (structural measure)
Three moderate adaptation options were designed to increase the resilience of the canal systems to cope with the increased future flood and drought risks. There is no ambitious option for this measure.
-
(a)
Increasing the canal carrying capacity: To reduce the future water risk, the RID plans to increase the carrying capacities of canals with a maximum 3-fold increase65. Taking this into account, the carrying capacity of each canal shown in Supplementary Fig. 1 was doubled (irrespective of location, purpose, and type) for the estimation of the maximum level of adaptation achievable through canal capacity enhancement. The operation criterion of canal systems is that whenever the river discharge is greater than the river channel carrying capacity, an amount equal to the original canal carrying capacity is diverted to the canal system (Supplementary Fig. 2). The diversion gradually increased until the discharge reached the combined capacity of the river channel and the canal system. Once the full capacity is reached, an amount equivalent to the doubled canal carrying capacity is diverted (Supplementary Fig. 2). Simultaneously, a discharge equal to 10% of the river carrying capacity was maintained in the river channel to augment the environmental flow.
-
(b)
Changing the destinations of canals to the Gulf of Thailand: There are nine canals in the lower CPRB, among which the Tha Chin (canal No. 5 in Supplementary Fig. 1b) terminates at the Gulf of Thailand. This water diversion from the main channel to the Gulf of Thailand will reduce the flood intensity downstream of the diversion point and can increase the water availability by canal water supply through its route. Recently, the Japan International Cooperation Agency (JICA)65 reported that water diversion from the Pasak River (located within 150 km from the Gulf of Thailand) to the Gulf of Thailand yields a benefit‒cost ratio of nearly 1.5 and is economically feasible. Therefore, the Chainat-Pasak, Lop Buri, and Noi canals were shifted to drain into the Gulf of Thailand (Supplementary Table 2) because their current destination is <150 km from the Gulf of Thailand. Three other canals are tributaries of the Lop Buri (Bang Kaeo) and Noi (Phong Pheng and Bang Ban) canals; hence, their destinations were also regarded as the Gulf of Thailand. The current destination of the Chainat-Ayutthaya canal was maintained because it lies at a greater distance from the Gulf of Thailand than do the other canals.
-
(c)
Addition of new canals (under planning): The impacts of three additional canals that are under planning were also investigated. These three additional canals include the (1) West diversion canal. This canal was planned by SCWRM64 to divert 1200 m3/s water westwards from upstream of the Chao Phraya Dam to the Gulf of Thailand59 (canal No. 12 in Supplementary Fig. 1b). (2) Ayutthaya bypass – A 19-km-long bypass channel (canal No. 13 in Supplementary Fig. 1b) from upstream of Ayutthaya to upstream of Bang Sai, which is the confluence of the Noi and Chao Phraya Rivers, was proposed by the JICA59 to divert floodwater because the river segment between Bang Sai and Ayutthaya is extremely narrow and would be difficult to widen. (3) Pasak–Gulf of Thailand canal – This canal was proposed by the RID to divert 600 m3/s water from the Pasak River to the Gulf of Thailand with a length of 136 km65 (canal No. 14 in Supplementary Fig. 1b). This canal diversion diminishes the flood risk in the Pasak River as well as in the Chao Phraya River by diverting floodwater to the sea by gravity.
Dam capacity (structural measure)
A previous study conducted by Biemans et al.14 concluded that the adaptation measure of doubled storage capacity of dam reservoirs could offset water scarcity by creating a buffer for the dry period. In addition, our previous work also revealed that the enhancement of the storage capacity of reservoirs is a good strategy for reducing flood peaks13. Referring to these previous studies, two levels of dam reservoir storage capacity enhancement are considered herein as adaptation options: (i) a 5% increase (moderate) – 5% capacity enhancement for all the reservoirs in the basin, and (ii) a 10% increase (ambitious) – an increase in the storage capacity by 10%. These levels were chosen by calculating the difference between the dam height and the maximum reservoir water level, which was 1 m and 7 m for the Bhumibol and Sirikit reservoirs, respectively59. This additional space can be utilized for storing water in the future as an adaptation strategy. The average additional water level from Bhumibol and Sirikit was 4 m, which was further multiplied by the water surface area of each reservoir to estimate the maximum increasable storage capacity. A 10% increase in the storage capacity was noted for an increase of 4 m in the water level for the Bhumibol and Sirikit reservoirs. Therefore, for simplicity, a 10% increase in storage capacity was considered as the ambitious level of adaptation measure. Although a 10% capacity enhancement may be possible for large reservoirs such as Bhumibol and Sirikit, it looks challenging for small reservoirs in the basin. Therefore, a 5% increase in storage capacity was set as the moderate level of adaptation.
Dam operation rule (non-structural measure)
The reservoir operation rules in the base model are based on Mateo et al. (2014)46, in which the rule curve is derived from the upper storage curve of historical reservoir operation until the 2011 flood. In this reservoir operation, the maximum storage at the beginning of January was gradually decreased to 75% of the effective storage capacity by the end of July (Supplementary Fig. 3), after which the reservoir was allowed to fill during the latter half of the year (mainly during the rainy season from August to October). This provided a free space equal to 25% of the effective storage capacity. During 2011, heavy rainfall occurred and resulted in increased inflow to the reservoirs, and the allocated free space was insufficient. Therefore, the reservoir operation was modified by altering the upper curve to provide more storage space for future flood flows during the wet season by considering the impacts of the 2011 flood. Therefore, in this adaptation strategy, the maximum storage capacity gradually decreased to 25% of the effective storage capacity by the end of July, which further generated a free storage space of 75% (Supplementary Fig. 3). This adaptation measure with moderate effect was implemented for all the dams in the basin to evaluate its effect on flood peak reduction and water availability. There is no ambitious option for this measure.
Dam construction (structural measure)
In the CPRB, the Yom River remains as the only tributary that has no major dams for flow regulation. The absence of major flow regulation structures, the gentle slope in the downstream parts, and the reduced channel carrying capacity in the Yom basin make the region highly prone to flooding66. Therefore, the effect of a hypothetical dam reservoir located in the upper reaches of the Yom River (Supplementary Fig. 1a) was considered as a moderate adaptation measure33,34, and there is no ambitious option for this measure. The storage capacity of the hypothetical new dam reservoir is given in Supplementary Table 1 that was assumed to be similar to that of the Kaeng Sue Ten (KST) reservoir, which has been under debate for a long time and has not yet been built due to CPRB inhabitants’ protests. Please see our previous work for detailed modelling information13.
Reforestation (non-structural measure)
Reforestation is considered as an adaptation measure in the water sector that could attenuate flood risk by reducing runoff as well as a mitigation option against global warming due to its ability to reduce greenhouse gases in the atmosphere18,67. In the CPRB, most of the croplands are distributed in the lower plain areas that considerably expanded in the late 20th century32. It was reported that the cropland fraction in the basin (derived from Hurtt et al.68.) was nearly 20% smaller during the 1970s than in the base year (set as the year 2000), and those areas were covered with forestlands (potential vegetation extracted from Ramankutty and Foley69). Similarly, during the 1950s, the cropland distribution in the basin was less than 2%, and most of the cropland expansion occurred after 1950 in areas that were forests. Forests are rich in litter, which enhances the formation of organic soil layers and develops soil structure to increase water retention, but takes several decades to form refs. 32,70. Takata and Hanasaki32 investigated (i) the effect of changing the land use in the basin from croplands to forest areas to replicate the conditions during the 1970s and (ii) the combined effect of the changes in soil properties and the reforestation effect in the 1950s to estimate their effects on water risk reduction using the MATSIRO land surface model.
In the present study, data on the effects of reforestation on runoff and evapotranspiration were extracted from Takata and Hanasaki32. These effects were translated into the H08 model by slightly altering the bulk transfer coefficient parameter (CD) of the land surface hydrology module that controls the rate of evaporation (Supplementary Table 3). Two levels of reforestation scenarios were designed herein: (i) the reforestation scenario from 1970 (moderate option), which was achieved by changing the CD from 0.013 to 0.014 (under RCP4.5) and 0.0136 (under RCP8.5), and (ii) the reforestation scenario from 1950 with changed soil properties (ambitious option). This effect was applied to the model by changing the CD from 0.013 to 0.02 (under RCP4.5) and 0.017 (under RCP8.5). A basin-wide uniform parameterization was implemented for simplicity. Although these adaptation measures are extremely difficult to attain socially and economically for the entire basin, they were implemented to estimate the maximum level of adaptation achievable from reforestation.
Adaptation portfolios
Apart from these individual adaptation measures, the possibility of several combinations was also assessed and can be described as follows: (i) standard (STD) portfolio – a combination of all structural and non-structural adaptation measures with moderate effects in addition to the existing measures, and (ii) ambitious portfolio (AMB) – a combination of all structural and non-structural adaptation measures with ambitious effects in addition to the existing measures (if not available, moderate effects were chosen). Two sub-scenarios, one with reforestation (AMB-WR) and one without reforestation (AMB-WOR), were also established under the AMB scenario (Fig. 1) to investigate the effect of reforestation on water risk reduction.
Effect of Adaptation measures at sub-basin level in the portfolio
Adaptation portfolios encompass all these seven adaptation measures; however, the availability of measures at each sub-basin makes the portfolio effect different in that sub-basin. For instance, among the above-mentioned seven adaptation measures, the measures of increasing irrigation efficiency and reforestation were spatially uniform within the basin, and hence, the effect of these measures is applicable to all sub-basins. Of the remaining five adaptation measures, three are based on dams, whose positions in the basin are shown in Supplementary Fig. 1. These dam adaptation measures (except the new dam construction measure) are available to all the sub-basins because there is at least one dam (existing or under planning) upstream of each sub-basin. The planned new dam construction measure was in the Yom basin (Supplementary Fig. 1); however, the Yom, Nan, mid, and lower sub-basins will benefit from this dam construction because all these sub-basins lie downstream of this planned dam. The two remaining adaptation measures are the changes in canal characteristics and the enhancement of the retention area. The canal systems and associated retention areas are mainly located in the Yom, Nan, and lower sub-basins within the basin (Supplementary Fig. 1), and these measures are available to all sub-basins except for Ping and Wang. Overall, out of seven adaptation measures, three measures in the portfolios are not available for the Ping and Wang sub-basins, and they are the (i) new dam construction, (ii) changes in canal characteristics, and (iii) enhancement of retention areas. For the remaining sub-basins, all adaptation measures in the portfolio are available.
Meteorological data
Two meteorological datasets were used to perform the simulations presented in this study: (i) Integrated Study Project on Hydro-Meteorological Prediction and Adaptation to Climate Change in Thailand (IMPAC-T) Forcing Data (IFD) – this historical climate dataset consists of seven meteorological variables of temperature, specific humidity, shortwave radiation, longwave radiation, atmospheric pressure, wind speed, and precipitation, from 1980 to 1999 at a spatial resolution of 5 arc minutes and a temporal resolution of one day71. In this dataset, the variables of temperature, specific humidity, shortwave radiation, and longwave radiation were derived from Hirabayashi et al. 72. The reanalysed climate data of JRA25 were used to estimate the atmospheric pressure and wind speed73. The daily precipitation data (T12) were generated from the recorded precipitation (measured at field gauging stations) provided by the RID and the Thai Meteorological Department (TMD)71. (ii) IMPAC-T Driving Data (IDD) – this future climate dataset includes ten bias-corrected GCM outputs from the Coupled Model Intercomparison Project—Phase 5 (CMIP5)74, from which three GCMs, namely, CSIRO-Mk3.6, GFDL-ESM2M, and MIROC5, were selected under RCP4.5 and 8.5 from 2080 to 2099 to perform the simulations. The spatial and temporal resolutions of the seven IDD variables are the same as those of the IFD. The meteorological data used in the study are available from the IMPAC-T project website (http://impact.eng.ku.ac.th/cc/).
Geographical and other data
In the standard H08 model, a single grid cell is divided into four sub-cells (i) double-crop irrigated, (ii) single-crop irrigated, (iii) rainfed cropland, and (iv) non-cropland, and the calculations are carried out separately in each of these sub-grid cells75. The irrigated area map for the CPRB was derived from Siebert (2006)62, and the crop type map was obtained from Monfreda (2008)76, as shown in Supplementary Fig. 4. The irrigation efficiency and cropping intensity for the CPRB were set to 50% and 1.5, respectively60,61,77. The domestic and industrial water demand was estimated by national estimates for the year 2000 provided by AQUASTAT (www.fao.org/nr/aquastat/). These national estimates were spatially interpolated and weighted by the population distribution of the Center for International Earth Science Information Network (CIESIN), Columbia University and Centro Internacional de Agricultura Tropical (CIAT)78.
A double cropping system (two different types of crops are grown) was adopted for modelling. The paddy and maize were selected as the first and second crops of the basin, respectively, because these are the two major crops in the basin (Supplementary Fig. 4). The cropping calendars were set in accordance with the observed basin pattern in which the planting of the 1st crop starts in early August and the crop is harvested at the end of November. Similarly, the planting of the 2nd crop starts in early February and is harvested at the end of May. Full irrigation was provided to the 1st and 2nd crops, which was maintained at 75% of the field capacity for the crops, while soil moisture was maintained at a saturated water content to express paddy inundation23.
The simulated annual average irrigation water withdrawal for the above settings was 41.8 km3/year, which was almost 81% of the reported irrigation water withdrawal of 51.8 km3/year for Thailand28,61. This is nearly double the irrigation water requirement reported for the year 1993 (20.3 km3/year) in the CPRB79. In general, the agricultural potential of the basin cannot be fully utilized, as the available water resources are limited in the basin and, on average, allow irrigation of half the irrigable area80. Following this, we set a 50% smaller irrigated area than that of Siebert62. It was also shown that deficit irrigation at various levels might help growers cope with a decline in water availability during the growing season without considerable yield loss. Therefore, 10% and 25% deficit irrigation were maintained for the 1st (paddy) and 2nd (maize) crops, respectively. Then, the irrigation water withdrawal for the basin was simulated, which further resulted in a reasonable water withdrawal of 19.2 km3/year for the basin (37% of irrigation water withdrawal for Thailand), which is comparable to the value reported by JICA (20.3 km3/year)79.
Model simulation
In this paper, all the simulation experiments were conducted for two periods: (i) from 1980 to 1999, the historic simulation, and (ii) from 2080 to 2099, the future simulation under two warming scenarios, RCP4.5 and RCP8.5. For the historic period, a ‘existing measures’ (NAD) simulation (including the effects of existing structural and non-structural measures) was carried out that represents the present conditions in the basin without any adaptation measures. For the future scenarios, under each warming scenario, NAD simulation (base simulation) and adaptation simulations (Fig. 1) were conducted for each of the three selected GCMs. Furthermore, to investigate the effect of each adaptation option on water risk reduction, individual adaptation measure simulations were also performed by enabling each of them in the NAD scenario. A total of 97 simulations were carried out under both historic and future scenarios. The equilibrium for each meteorological variable was achieved using spin-up calculations.
Validation
Our recent study conducted in the CPRB25 has successfully calibrated the H08 model for reproducing the pristine flow at the Nakhon Sawan station (C.2 station in Supplementary Fig. 1) with a monthly Nash-Sutcliffe efficiency (NSE) value of 86.07%. This study validated the reservoir operation and irrigation water withdrawal reasonably well. Therefore, for future NAD simulations, variables such as the cropland distribution, crop types, crop calendar, calibrated parameters of the land surface hydrology module, storage capacity of reservoirs, carrying capacity of canals, extent and water holding depth of retention areas, and population were fixed to their values in the base year (1980–1999; historic simulations). Necessary changes in the above variables were made to conduct the adaptation simulations. The following additional assumptions were also made in the future simulations: (i) existing dams and water diversion canals will be operating at the end of the century, (ii) dam releases will increase in accordance with the increased future inflows to the reservoir, and (iii) the sedimentation load will be effectively removed, and the storage capacity of reservoirs will remain the same throughout the simulation period.
Risk analysis
In the present study, flood and drought risks were analysed using various indicators.
Flood risk
Flooding occurs when the river discharge exceeds the river channel carrying capacity, driving flows overbank81,82. Hence, in this study, a flood is defined as the daily discharge that is greater than the river channel carrying capacity (i.e., when river discharge generally spills over riverbanks). The flood risk was mainly evaluated using the number of flooding days index. A day is counted as a flooding day whenever the daily discharge is greater than the channel carrying capacity. The number of flooding days indirectly represents the inundation scenario. If the number of flooding days is high at a station, the flood risk will be high at that station. In addition to the number of flooding days, flood events were described as T-year floods, which are defined as river discharges with a probability of exceeding 1/T in any given year. To calculate the T-year floods, the time series of annual maximum daily discharge from 1980–1999 and 2080–2099 under two warming scenarios (20 years) were first arranged in ascending order and then fitted to the Gumbel probability distribution function. The probability distribution function was applied to return periods of 5, 10, 50, and 100 years.
Drought risk
In this study, drought is defined based on whether the water demand is met or not. A month is regarded as a drought month only if 70% of the withdrawal-based potential water demand is not met. The monthly accumulated water abstraction from different sources must be at least 70% of the monthly withdrawal-based demand to count a month as a non-drought month. The drought risk was evaluated mainly using the number of drought months. If the number of drought months is high at a station, the water availability will be very low at that station. To count the number of drought months, we calculated the ratio of the simulated monthly water abstraction from renewable sources to the monthly withdrawal-based potential water demand for a month of the year83. It is suggested that (i) if the ratio is greater than 0.8, it indicates low or no water stress; (ii) if the ratio is between 0.5 and 0.8, it denotes medium stress; and (iii) if the ratio falls below 0.5, it represents high stress83. Hence, for the present study, a moderate water stress scenario was used to depict a drought month, which can be defined as the month during which the accumulated water abstraction (numerator) falls below 70% of the withdrawal-based potential water demand (denominator). Note that the model computes the demand and withdrawal values for each day but stores only the monthly aggregates to keep file sizes manageable; hence, the number of drought months was considered in the present study.
Adaptation level
Adaptation level indicates the risk reduction achieved after implementing the adaptation portfolios. For the present study, combined and individual (drought and flood) adaptation levels were computed and are described below in detail.
Combined adaptation level
The effect of adaptation portfolios was entirely different at representative sub-basins. Even at each sub-basin, the adaptation levels will vary with respect to the adaptation portfolio because some portfolios offered better drought protection, whereas the others provided greater flood protection. Hence, it is necessary to investigate the minimum possible achievable adaptation level for each sub-basin under whatever adaptation portfolio is implemented. To quantify this, Euclidean distance (ED) was used, which is a metric that evaluates the relative closeness between two variables36. In the present study, a larger ED among the sub-basins portrays a higher adaptation (Supplementary Fig. 6). To calculate the ED, initially, a best-fit line was drawn (dotted line in Supplementary Fig. 13) through the adaptation portfolios (STD, AMB-WOR, and AMB-WR) by assuming that any developed portfolio could possibly lie on this line. Then, the distance between the ‘future NAD’ scenario and the best-fit line was calculated as the ED (solid green line in Supplementary Fig. 13), which illustrates the shortest distance between the ‘NAD scenario’ and the adaptation portfolios with optimized benefits on both flood and drought risk reduction. This ED can be termed as the ‘combined achieved adaptation’ hereafter in this text. This ED was further extended until it intersects with the imaginary reference line (dashed black line in Supplementary Fig. 13) drawn parallel to the best-fit line through the ‘Historic NAD’ scenario. This extended ED (solid red line in Supplementary Fig. 13) will provide an idea about the additional adaptation required to reduce the risk to the present level (‘Historic NAD’ scenario) even after the implementation of adaptation portfolios. Hence, this extended ED is referred to as the ‘combined unachieved adaptation’ hereafter in this text. The achieved and unachieved adaptations (ED and extended ED, respectively) were further realized into bar diagrams (in %) as shown in Fig. 2b.
Individual adaptation level
The combined achieved adaptation levels differed by sub-basins, and this can be mainly attributed to the differences in the drought and flood adaptations. To investigate which hazard is contributing the most to the unachieved adaptation levels, we further separated the effects of combined adaptation levels into individual (flood and drought) adaptation levels. For this purpose, the achieved flood and drought adaptations were calculated from the combined achieved adaptation by transforming the ED into a right-angled triangle and the base of the triangle (dashed green line in Supplementary Fig. 13) represents achieved flood adaptation and the perpendicular of the triangle (dashed green line in Supplementary Fig. 13) indicates achieved drought adaptation. This achieved flood and drought adaptation lines were further extended until it meets the ‘Historic NAD’ scenario (dashed red lines lines in Supplementary Fig. 13). These extended lines portray the additional adaptation required to reduce the risks to the present level and hence termed as the unachieved flood and drought adaptations. The individual flood and drought adaptations were further converted into bar diagrams (in %) for each sub-basin as shown in Fig. 2b.
Economic analysis
The economic analysis carried out in this study compares the adaptation measures and only approximates the cost. The cost of increasing the irrigation efficiency was calculated based on the type of micro-irrigation system that could be implemented to achieve the desired level of efficiency. This will represent the reference cost of the most efficient but costliest irrigation equipment. It was assumed that drip irrigation is the most efficient system and can achieve an irrigation efficiency of at least 80%, whereas the sprinkler irrigation system could operate with an efficiency of 65%84. The unit costs of the drip and sprinkler irrigation systems were 610 €/ha and 357 €/ha, respectively84. The total cost of irrigation efficiency improvement was then estimated by multiplying the unit cost by the irrigated area. The cost of retention area enhancement (improving/adapting irrigated agricultural areas into retention areas with increased water holding depth) for the basin was extracted from the JICA report85, which was nearly 60 billion baht. For the cost estimation of canal systems, no concrete data were available. The total costs of the three proposed canals of the Ayutthaya bypass, West Diversion canal, and Pasak to Gulf of Thailand canals were derived from the JICA Report59, from which the unit cost for 1 km to carry 1 m3 of water within 1 s was estimated to be 0.79 million baht. The total construction cost for each canal was then calculated using the canal carrying capacity and length of the canal system. For existing canal systems whose capacity doubling is under planning, half of the total construction cost was considered.
The unit dam construction cost/m3 of reservoir storage capacity was procured for different types of dams, such as the rock embankment, concrete gravity, earth embankment, and concrete arch86. The total construction cost was calculated based on the storage capacity of each dam reservoir. To estimate the cost of 5% capacity enhancement, the total construction cost was recalculated with a 5% enhanced storage capacity. The difference in construction cost with respect to the original storage capacity and 5% enhanced capacity was regarded as the cost of 5% capacity enhancement. The same procedure was repeated for the cost estimation of 10% storage capacity enhancement of the dams. To change the reservoir operation rule, a no-cost assumption was made for the calculations. The construction cost of a new dam in the Yom sub-basin was retrieved from the JICA Report as 25.4 billion baht59. The cost of the reforestation scenario was extracted from the news report published in Bangkok Post in August 2019 (Supplementary Table 4). The unit cost to plant and maintain trees is 6.85 million baht/km2. The total cost was computed based on the extent of the reforestation scenarios considered in the study. The estimated cost values were converted into USD to standardise the cost calculation. The total construction cost (in billion USD) for each of the adaptation options is presented in Supplementary Table 4.
Responses