Addressing genome scale design tradeoffs in Pseudomonas putida for bioconversion of an aromatic carbon source

Introduction
Computational and data-driven approaches in synthetic biology enable strain performance improvements typically inaccessible using traditional strain engineering approaches. One successful paradigm uses growth coupling design algorithms to query genome-scale metabolic models (GSMM) to reroute the metabolic flux towards a desired outcome, inactivating competing reactions that divert the substrate away from product synthesis. By implementing the required gene deletions predicted by the algorithms, metabolism is rewired so that the production of a target metabolite is concomitant with microbe growth. Thus growth is paired to the synthesis of the chosen product and can substantially improve the productivity of the targeted metabolite. This approach can also be used in tandem with other tools like serial passaging for laboratory evolution and with rational strain engineering1,2,3. Growth coupled production has been demonstrated using relaxed thresholds for product yield4,5,6,7 and with model carbon substrates (i.e., glucose)8,9, but there are fewer examples of such approaches for non-sugar carbon streams10,11,12 from renewable bioenergy streams like depolymerized plastics or aromatics from plant-derived lignocellulosic biomass.
The challenge of using growth coupling algorithms for alternative carbon streams is that while co-utilization of several non-sugar carbon molecules has been described in many reports13,14,15,16,17, the existing metabolic data has yet to capture how carbon flows through various metabolic routes or account for enzyme constraints in specific multi-deletion mutant strains expressing heterologous gene pathways. This is especially true outside of glucose (or sugar) catabolism, where the understanding of carbon flux is less robust. When modeling does not reflect true cellular metabolism, these approaches are more likely to generate gene deletion targets that are ineffective. Growth coupling algorithms that promise substantial improvements to yields, making production essential for growth are termed “strong” growth coupling4,8. These algorithms require numerous gene modifications which are challenging to achieve in practice. Both partial and complete implementation of such designs, again oftentimes in conjunction with other approaches, have shown useful applications for bioproduction8,18,19,20 and reveal key insights into the host strain physiology.
We use a previously developed strong growth coupling design in Pseudomonas putida KT2440 that pairs a lignin-derived monomer, p-coumarate (p-CA) to glutamine21 (Fig. 1), a valuable platform chemical22,23,24. We further use the heterologous expression of a non-ribosomal peptide, indigoidine, an alternative for industrial indigo25,26,27. Indigoidine is generated by condensation of two glutamine molecules using two molecules of ATP, one Mg2+ and two flavin mononucleotides (FMN) as cofactors (Fig. 1E), and it is often used as a proxy for glutamine since it can be measured using quantitative colorimetric assays for efficient strain prototyping26,28,29. Non-model carbon sources pose a challenge for growth-coupled strategies, as substrate toxicity (pertinent for p-CA) can be a challenging baseline for strain engineering30. We used constrained minimal cutsets (cMCS), a computational approach4,8 that provides strong coupling solution-sets or cutsets, where each cutset consists of reactions (and the corresponding genes) that need to be deleted for the growth coupled production phenotype. For bioconversion to glutamine/indigoidine, we showed that a partially implemented cutset (three out of the four demanded genes were deleted) enabled phenotypic growth coupling but as expected, generated the product at lower levels than the predicted yield21. As we encountered unexpected strain behavior after three of the four deletions were introduced, we used an ensemble of methods to characterize the triple deletion strain. However, since implementation of the complete cutset was not accomplished, a hypothesis that emerged is that a full cutset may allow higher productivity as predicted for the strong growth coupling design without additional refinement, or provide key insights into the role of the reactions involved in this design.

A Yield envelope for this study. The complete growth coupling solution described with the orange fill area (Design 1b) has a potential for 76% of the predicted maximum theoretical yield (MTY) of indigoidine from p-CA. The yield is shown for a range of substrate uptake rates from 0 to 10 mmol/gDCW/h. For comparison, the predicted biomass formation rate and yields for a partial cutset21 are included for comparison as the gray area fills in the yield envelope. B Simplified metabolic map showing the four required gene interventions necessary to implement the Design 1b cutset in P. putida. Three genes are involved in fumarase hydratase activity, and one permease must be deleted. C The encoded reactions and genomic locations of the three genes involved in fumarase hydratase activity. D The different approaches taken to modulate the expression of PP_0897, another fumarate hydratase gene, need to be deleted for a complete cutset implementation. E Schematic representation of the indigoidine production module using two molecules of l-glutamine converted to the blue pigment, a non-ribosomal peptide.
Here, we characterize an engineered P. putida strain containing the complete cutset and corresponding heterologous final product formation. We demonstrate that the fourth gene in this cutset, PP_0897, is involved in cellular activity beyond its annotation as a fumarate hydratase. The approaches involved promoter titration analysis, gene and metabolite complementation, DNA damage sensitivity analysis, and comparison of strain growth rates. Concomitantly, constraint-based analyses using proteomics data also showed limitations of growth and production on p-CA medium and were in good agreement with the experimental results.
Results
The work in this study has three key aspects. First, we were able to delete all four genes necessary to generate a full cutset for pairing p-CA as a substrate to glutamine as the metabolite. Next, we used proteomics analyses and variable expression of the fumarate hydratase enzyme to show that this reaction is required at a low level. In parallel, we used comprehensive media supplementation analyses to examine metabolites that are impacted due to the removal of the fumarate hydratase reaction. We show that p-CA consumption and metabolism present aspects of toxicity and metabolic cross-feeding not captured by the genome scale model.
A completed p-CA/indigoidine cutset and modulating PP_0897 gene expression impacts strain growth, production and proteome response
The complete intervention design (cutset) requires deletion of four genes: an α-ketoglutarate/3-oxoadipate permease PP_1378; and three class I and II fumarate hydratases—PP_0897, fumC1/PP_0944, and fumC2/PP_1755. This design was reported in Eng et al.21 where a partial implementation deleting only PP_1378, PP_0944, and PP_1755 was used and the corresponding strain was further engineered using data-driven approaches for production improvement (Fig. 1A, B). The conceptual foundation from this design was an appealing starting point to test our initial hypothesis. By including one additional deletion (PP_0897) we could complete the cutset, potentially revealing growth coupling at the predicted product yield without additional model refinement. We started with the strain P. putida KT2440 PBAD-Sc.bpsA, Bc.sfp, Ps.glnA ∆PP_1378 ∆PP_1755 ∆PP_0944 ∆fleQ21, i.e. Design 1b glnA ∆fleQ (see strain table, Supplementary Table 1, abbreviated and hereafter referred to as “D1b_gf”). The fumarate hydratases in the design are associated with the FUM reaction in the P. putida GSMM (Figs. 1B and C). Deletion of either or both the non-essential fumarate hydratases, PP_1755 and PP_0944 had no impact on cell viability in either rich or M9 p-CA minimal media cultivation21.
We tested if PP_0897 was an essential gene in P. putida by targeting this gene alone for deletion via CRISPR/recombineering. PP_0897 deletion mutants were recovered at a comparable frequency expected for our established recombineering protocol (Materials and Methods). P. putida ∆PP_0897 cells are viable on both rich and p-CA minimal salt medium but form smaller, slower-growing colonies (Fig. 2A). This implies PP_0897 alone is dispensable for growth in both rich and M9 p-CA minimal medium conditions.
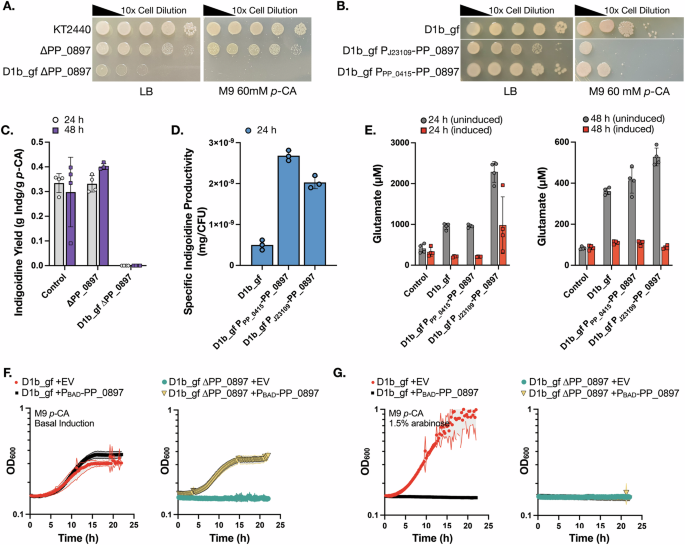
A Serial dilution plating for growth on solid agar medium supplemented with rich (LB) or p-CA minimal medium. Abbreviated genotypes are indicated to the left of each image. B The native PP_0897 promoter was replaced with two different low abundance promoters and the impact on viability in rich medium or M9 p-CA minimal medium was quantified. C P. putida strains assayed for indigoidine production in M9 60 mM p-CA medium at the indicated time points following induction with 1.5% arabinose (w/v). Control is WT P. putida harboring genome integrated indigoidine pathway cassette and ∆PP_0897 is the single gene deletion strain. Strain D1b_gf ∆PP_0897 did not grow nor produced in M9 p-CA medium. D P. putida strains with promoter-varied PP_0897 expression assayed for indigoidine production. Specific indigoidine yield (mg/CFU) was calculated by normalizing the indigoidine with the number of total viable cells at 24 h. E P. putida strains with promoter-varied PP_0897 expression with or without induction of the indigoidine pathway in M9 60 mM p-CA, sampled at 24 h and 48 h for glutamate and indigoidine (Supplementary Fig. 2). F, G Strains D1b_gf with or without ∆PP_0897 were transformed with an empty vector plasmid or a plasmid containing a PBAD-PP_0897 construct. F Growth in M9 60 mM p-CA medium with basal BAD promoter induction without inducer (F) or with 1.5% (w/v) arabinose (G) in 24 well microtiter dishes. Strain genotypes are indicated above each panel. Measurements are average of at least three independent replicates. Error bars represent mean ± S.D. (n = 4) in (C–E). The shaded area represents mean ± S.D. (n = 3) in (F, G).
Since PP_0897 was dispensable for growth in rich media conditions, this suggested completing the cutset might be feasible, and prompted exploring if additional gene deletion combinations leading to a completed cutset could be obtained. A partial cutset strain with both ∆PP_0897 ∆PP_0944 edits retained growth on the M9 p-CA medium, but a strain with all three known fumarate hydratases deleted failed to grow, indicating flux through this node of the TCA cycle was required for p-CA utilization (Supplementary Fig. 1). By introducing the PP_0897 deletion to the D1b_gf strain we completed the cutset and observed similarly that this strain was slow growing on LB medium and also failed to grow on M9 p-CA medium agar plates (Fig. 2A and Supplementary Fig. 1) and, therefore, it did not produce any final product (Fig. 2C). To test if serial passaging would restore both growth and production of a completed cutset, we subjected D1b_gf ∆PP_0897 to adaptive laboratory evolution. We failed to recover any improved mutant clones after three months of serial passaging on rich or minimal medium, at which point the experiment was discontinued.
As an alternate strategy to adaptive lab evolution, we next asked if a reduced PP_0897 expression strain would permit growth and glutamine/indigoidine production with p-CA as the carbon source. The endogenous PP_0897 promoter was replaced using recombineering with either a low activity pJ23109 promoter from the Anderson collection31 or the low abundance PP_0415 promoter sequence identified in Eng et al.21 (Fig. 1D). PP_0897 abundance was strongly reduced ~8 fold as expected in both PP_0897 promoter titration strains (Supplementary Fig. 4B). While D1b_gf PPP_0415-PP_0897 had a modest growth reduction compared to the base engineered strain (WT harboring an integrated indigoidine production pathway, control strain), strain D1b_gf PJ23109-PP_0897 required an additional 24 h incubation on LB agar medium to form colonies (Fig. 2B). Mutations were consistently detected in the J23109 promoter with a G/A point mutation in the -22 position upstream of the PP_0897 start codon. This suggests the chosen Anderson promoter expression level was below the threshold necessary for growth in a rich medium and favored the spontaneous accumulation of the point mutant. In contrast to D1b_gf ∆PP_0897 strains, both of these PP_0897 promoter variants enabled growth on M9 p-CA (Fig. 2B) without serial passaging, providing us with a route to investigate the role of this gene further.
Next, we examined the impact of the various PP_0897 edited configurations on the accumulation of the target metabolite, glutamine, and indigoidine production. We observed that the single deletion strain, ∆PP_0897, showed similar product yields to the basal pathway engineered strain while D1b_gf ∆PP_0897 did not show any production (Fig. 2C). In contrast, the reduced expression promoter mutants accumulated similar amounts of indigoidine to the parental control strain (Supplementary Fig. 2). By accounting for the number of viable cells present during a production run, we observed that the specific indigoidine yield in the promoter variants was up to 5-fold higher compared to the parent D1b_gf strain (Fig. 2D).
The promising per cell increase in indigoidine led us to further investigate the lack of growth on the defined p-CA medium. Since the growth-coupling design targets glutamine, we measured total glutamine and glutamate pools via LC-MS, but the glutamine concentrations were below the detection limit for all samples in this study. This absence of detectable glutamine could be explained by the spontaneous hydrolysis of glutamine to glutamate and ammonia due to pH changes above or below the isoelectric point of glutamine32. As such glutamate concentrations were used as an indirect measure of glutamine levels, since glutamate is a key precursor for glutamine. Consistent with growth coupling, the promoter-varied strains showed increased glutamate pools (Fig. 2E). These results met the model predictions because a more constrained and reduced flux through the FUM reaction corresponded to an increase in glutamate pools. The strain D1b_gf PJ23109-PP_0897 had the highest glutamate pool increase of 2.4-fold relative to the control strain. Induction of the indigoidine production pathway depleted the glutamate pools in all three growth-coupled strains. In these cases, glnA is also induced as part of the optimized heterologous pathway used in the D1b-derived strains. In contrast, the control strain showed no detectable change in glutamate levels as it lacks an additional, inducible copy of glnA (Fig. 2E). However, despite the overall depletion of glutamate upon induction of indigoidine production, the increased glutamate concentration did not necessarily correlate with additional indigoidine, and indigoidine yields were similar across strains (Supplementary Fig. 2). The cap on improvement in indigoidine could be reflective of insufficient cofactors and ATP to complete the cyclization of glutamine by BpsA, limiting additional conversion of this intermediate. Additional evaluation of redox balance and ATP requirement for these strains are required to confirm this hypothesis. The HPLC analysis confirmed the complete depletion of the supplied p-CA in the media in the PP_0897 promoter variants within 24 h post inoculation, and no additional secreted metabolites were detected in any of the intermediate timepoints. These results indicate that native PP_0897 activity in the strain D1b_gf is necessary for robust biomass formation, suggesting that, while the FUM reaction node is necessary for growth-coupling, it comes at the cost of disabling growth.
To rule out the impact of secondary mutations in the D1b_gf strain background on the failure to grow in the M9 p-CA medium when PP_0897 is deleted, we designed new plasmids to reintroduce PP_0897 under an inducible promoter (Materials and Methods). This allowed us to investigate the association of PP_0897 and the synthetic lethal phenotype observed in D1b_gf ∆PP_0897. We observed that the PBAD-PP_0897 restored the growth of D1b_gf ∆PP_0897 strains, confirming genetic linkage by complementation with basal induction. The control strain D1b_gf (containing two copies of PP_0897) showed no difference in growth rate (Fig. 2F). However, inducing PP_0897 with arabinose (1.5% w/v) inhibited growth in both D1b_gf and D1b_gf ∆PP_0897 strains (Fig. 2G), revealing a cellular sensitivity to dosage level.
Indigoidine titers were also complemented in the D1b_gf ∆PP_0897 strain, showing similar titers as the D1b_gf strain with empty vector control (Supplementary Fig. 3A). In the D1b_gf strain, the PBAD-PP_0897 plasmid reduced indigoidine titers by 3.8-fold compared to the empty vector control even though there was no difference in growth rates in the basal induction condition (Fig. 2F). Proteomics analysis of samples taken during the production run corroborated the PP_0897 plasmid-based expression, as well as Sfp and BpsA, enzymes needed for the conversion of glutamine to indigoidine (Supplementary Fig. 3B–D). In summary, these results suggest that the accuracy of a predicted cutset cannot account for potential conditional synthetic lethal interactions or gene dosage requirements among the required deletion mutants.
To characterize global perturbations on cell metabolism from reduced PP_0897 protein levels, we used proteomics to map proteins with differential abundance among the ~2000 proteins quantified, comparing the promoter variants to the parental D1b_gf strain. Only 28 metabolic and 63 non-metabolic proteins exhibited distinct abundance levels in the PJ23109 strain and similarly, only 19 metabolic and 37 non-metabolic proteins had different abundances in the PPP_0415 strain (Supplementary Fig. 4A). As both strains down-titrated PP_0897 expression and had similar impacts on growth and production, we reasoned that biologically relevant changes would be common between both mutants and their biological replicates. However, there was little overlap between the two datasets (Supplementary Data S2): for example, Edd/PP_1010, a glycolytic protein involved in the Entner-Doudoroff pathway was upregulated in the PJ23109 strain but unchanged in the other. Only 13 proteins showed matching amplitudes of varying abundance (i.e., both up or down). Several proteins fell into two broad categories: substrate transporters and metabolic enzymes, while three were of unknown function. PP_3736/VanA, a vanillate monooxygenase converting vanillate to protocatechuate, was highly downregulated, but no other aromatic-catabolism pathway proteins were impacted. A beta-ketoacyl-acyl-carrier-protein and l-carnitine dehydratase were weakly upregulated. The transporters were similarly diverse in function, where two probable importers for acetate or copper were upregulated, and a broad-substrate amino acid importer was downregulated. The remaining proteins were a stress response protein and two DNA or transcriptional regulatory proteins; overall it was unclear how these broad-cellular effectors were related to down-regulating a node in the TCA cycle.
Finally, we cross-referenced these proteins against reported barcoded transposon fitness data, and found no commonalities for fitness defects in this set for inactivating transposon mutants measured under a diverse set of conditions (Supplementary Fig. 4C). At best, vanA mutants have strong fitness defects on vanillate as a carbon stream, but show no defect for p-CA. Owing to VanA’s limited role in p-CA catabolism, the proteomic impact on growth and indigoidine production is likely due to the concerted impact of the other 12 proteins showing distinct levels of abundance through an unknown mode of action, or repurposes constitutive protein activities without changing their abundance, eluding characterization in a differential proteomic analysis. Additional comparisons are included in the Supplementary data file Data S2, and the complete proteomics data have been deposited to the ProteomeXchange Consortium via the PRIDE partner repository33 with the dataset identifier PXD050285.
Context-specific GSMM for strains with various growth coupling implementations explains the highly constrained design space
Our empirical evidence suggested that modulating PP_0897 activity was not reflected in the GSMM-based designs for p-CA conversion to glutamine. Thus, we hypothesized that the metabolic model and cMCS based yielding predictions for growth-coupled strategies were over-constrained in experimental scenarios using p-CA with metabolic and non-metabolic processes that are unaccounted for. One solution is to refine the models to account for complex multilayered networks for regulation using functional genomics data as well as regulatory network information34. Here, we specifically used context-specific models generated using proteomics data for the two promoter-varied strains as an alternative approach.
Our permissible flux space analysis confirms a narrow range of permissible flux through the FUM reaction that would result in strong growth coupled glutamine production, i.e. a fixed amount of glutamine flux at all times while generating biomass for the engineered strains when utilizing p-CA as the sole carbon source (Fig. 3). We found this by utilizing differential proteomics data as new constraints for the D1b_gf reduced model (iMATD1b539) which has 558 reactions and 539 genes21. This generated two different context-specific models for the PJ23109 strain (iMAT_pJ23109_PP_0897, 522 reactions) and the PPP_0415 strain (iMAT_PP_0415p_PP_0897, 522 reactions) (Fig. 3A, refer to Proteomics data integration to create context-specific models section in Methods). Proteomics data analysis for the two promoter-based variants, PJ23109 strain and PPP_0415 strain showed that there were 27 and 18 proteins, respectively, that had a significant differential protein abundance compared to the D1b_gf strain. Based on previous data21 we were able to derive growth, glutamine, and indigoidine flux for the two context-specific models. The predicted maximum specific growth rate was 1.14/h, and the maximum glutamine flux was 8.77 mmol/gDCW/h (i.e., 0.88 mol/mol) using p-CA as the sole carbon source. Next, using flux variability analysis (FVA) and robustness analysis, we observed that the balance between glutamine and biomass reaction flux was highly sensitive to a finite fumarase (FUM) reaction flux for the promoter-based strain-specific models compared to the GSMM as well as the D1b_gf reduced model (Fig. 3B–D). For maximal glutamine production, FUM carried a flux of 19.88 mmol/gDCW/h, which resulted in a 0.43 /h specific growth rate, whereas for maximal specific growth rate, the FUM reaction carried 26.44 mmol/gDCW/h flux that resulted in a negligible glutamine flux. Increasing the FUM flux by a small fraction resulted in growth coupled production phenotype, i.e., constraining the FUM flux to 20 mmol/gDCW/h results in 0.45/h specific growth rate led to a coupled production of 8.61 mmol/gDCW/h (i.e. 0.86 mol/mol) glutamine. This suggests a potential tradeoff between maximal growth and production and also that a nominal change in FUM flux under the defined medium conditions and proteomics constraints could result in the desired growth coupled phenotype.
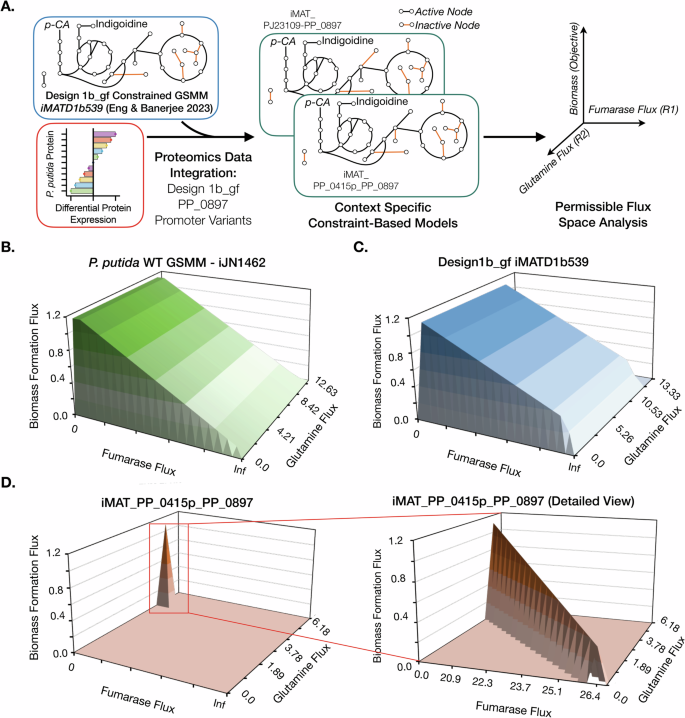
A Overall workflow of the simulations performed to model the permissible flux space limiting growth coupled production. Proteomics data, the D1b_gf reduced model, and the iMAT algorithm are used to develop context-specific models, which are then used for sensitivity analysis. A double robustness analysis is applied to determine the tradeoff between growth represented as biomass formation flux, fumarase flux, and glutamine exchange reaction flux, removing glutamine from the system represented as glutamine flux. Double robustness analysis 3D plots of the genome-scale metabolic model (GSMM) of P. putida WT (iJN1462) (B), context-specific D1b_gf reduced model (C) and context-specific D1b_gf PPP_0415-PP_0897 model (iMAT_PP_0415p_PP_0897) (D). A red box indicates the region of interest replotted in the detailed view. The units for fumarase and glutamine flux are mmol/gDCW/h, and the unit for biomass is h−1. Infinity (Inf) represents unconstrained flux for the reaction and may have a variable value based on the definition of bounds for a GSMM.
To assess the interplay between all three parameters (growth, the FUM reaction, and magnitude of production) in the entire available flux space for the context-specific models, we performed double sensitivity analysis (via double robustness simulation, see Methods). In contrast to the unconstrained GSMM and the D1B_gf model, double sensitivity analysis predicted a single point FUM flux (Fig. 3D) that allowed strict growth coupled production of glutamine. Both the context-specific models for the promoter-based strains, i.e., iMAT_pJ23109_PP_0897 and iMAT_PP_0415p_PP_0897, showed similar trends. As expected for the growth coupled design, we observed similar balance and narrow permissible FUM flux trends for indigoidine production (Supplementary Fig. 5). The narrow flux peak visualized could explain the failure to recover ALE strains for D1b_gf ∆PP_0897 because this flux may be biologically infeasible with the demand for both reasonable biomass formation and coupled production with p-CA as the sole carbon source.
Metabolite supplementation in the completed cutset does not restore p-CA catabolism
The computational and experimental evidence indicated that reducing the flux through the FUM node in the TCA cycle, while detrimental to growth, could improve glutamine synthesis in the growth-coupled design. Given that the complete inactivation of this reaction abolishes growth on p-CA, we investigated whether this growth defect could be rescued by supplementing the growth media with malate, the product of fumarate hydratase. A similar approach in E. coli for the growth-coupled production of itaconic acid showed that a glutamate auxotrophy could be satisfied with exogenous glutamate and provide high-yield itaconic acid production35. Drawing a parallel, we hypothesized that exogenous malate addition may support biomass formation and enable high-yield indigoidine production in our completed cutset strain.
However, in contrast to the predicted growth from the constraint-based modeling of the promoter-titrated strains, the strain D1b_gf ∆PP_0897 failed to grow in M9 60 mM p-CA, even with malate supplementation (Fig. 4A). This result also contrasts with the complementation analysis, where the PP_0897 fumarate hydratase coding sequence introduced on a plasmid was sufficient to restore growth in ∆PP_0897 strains in both M9 p-CA (Fig. 2F) and M9 p-CA malate (Fig. 4A), suggesting a malate auxotrophy does not fully explain the observed growth defect in ∆PP_0897 strains. Furthermore, malate supported growth as the sole carbon source in control strains, indicating malate transport was not a limiting factor (Supplementary Fig. 6).
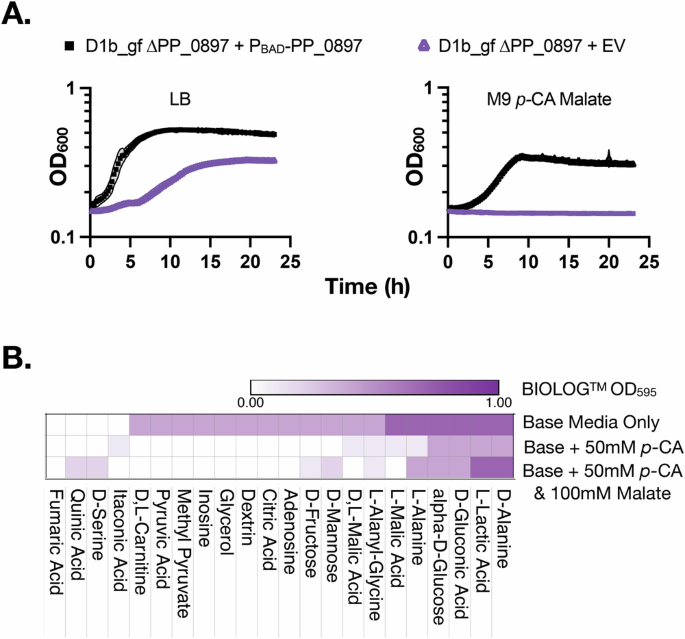
A Initial auxotrophy analysis and complementation via ectopic plasmid expression of the Design 1 cutset strain, D1b_gf ∆PP_0897 transformed with PBAD–PP_0897 Refer to Fig. 2F for complementation of the PP_0897 deletion mutant on M9 p-CA medium. B Heatmap showing selected BIOLOGTM metabolite sources that rescued growth under different media conditions including basal media supplemented with 50 mM p-CA and/or 100 mM l-malate.
These findings prompted us to evaluate if alternate functions outside of disrupting a node in the TCA cycle could explain the growth defect in ∆PP_0897 strains. Reports in the literature implicate PP_0897 homologs and related metabolites in a broad range of activities including chemotaxis, the DNA damage response, and growth under iron limitation36,37,38,39. Hydroxyurea is a bacterial anti-metabolite that impairs nucleotide synthesis (leading to DNA damage via stalled replication forks), and fumC activity has been reported for strain viability in the presence of this stressor40,41. We tested the role of PP_0897 in the DNA damage response since proteomics analysis of the PP_0897 promoter-titration strains had also identified a heat shock protein and a nucleotide synthesis protein encoded by PP_1964 (Supplementary Data S242,). Two ∆PP_0897 mutant strains were subjected to hydroxyurea treatment and here we observed a role for PP_0897 in the stress response and nucleotide biosynthesis pathways. Both the single ∆PP_0897 mutant as well as the D1b_gf ∆PP_0897 strains are resistant to hydroxyurea in rich nutrient growth conditions, whereas the same strains with a native copy of PP_0897 were not (Supplementary Fig. 7). This observation suggests ∆PP_0897 strains are more competent to utilize nucleotide scavenging pathways40,41 compared to WT. The single mutant ∆PP_0897 strain has a partially active TCA cycle with two fumarate hydratase isomers present, implying that PP_0897 has a dominant role in maintaining the cellular nucleotide pool over its isomers and deletion of these isomers in D1b_gf did not confer such a phenotype (Supplementary Fig. 7). This result solidifies that PP_0897 encodes an activity beyond its canonical role as a fumarate hydratase and suggests additional activities are important when p-CA is used as the sole carbon source.
Returning to the failure of malate supplementation to restore growth of the D1b_gf ∆PP_0897 growth strain in the M9 p-CA medium, we searched for additional missing nutrients using BIOLOGTM phenotyping microarray plates. Additional media amendments supplementing p-CA as the sole carbon source could hint at the missing activity encoded by PP_0897. These BIOLOGTM plates contain 190 metabolites arrayed in two 96-well microtiter plates enabling rapid nutrient utilization profiling. P. putida KT2440 was reported to utilize 47 of 95 of the metabolites in PM1 plate43, while a “∆ flagella” strain lost the phenotype to utilize d– or l-alanine44. In contrast, our strain D1b_gf ∆PP_0897 was able to utilize both alanine isomers, even though it contains a comparable ∆fleQ edit, inactivating the master regulator for flagella biosynthesis. D1b_gf ∆PP_0897 lost the utilization phenotype for 20 metabolites and resulted in the highest signal of cellular respiration with an OD595 above 0.7 for six metabolites—d-glucose, d-alanine, l-alanine, l-malic acid, d-lactic acid, and d-gluconic acid (Fig. 4B). Fumarate supplementation was not detected as a growth-enhancing metabolite, in contrast to some previous reports in Arabidopsis thaliana45 that fumarate hydratase can catalyze both the forward and reverse reactions.
As the objective of these experiments was to identify metabolites that restored growth of the D1b_gf ∆PP_0897 strain where both p-CA and malate were supplied, we completed a third BIOLOGTM respiration analysis with this specific condition. We finally observed rapid color formation indicative of respiration with both p-CA and malate added to the media in BIOLOGTM wells containing d– or l-alanine, l-lactic acid, glucose, serine, or quinic acid. Alanine, lactic acid, and glucose were previously identified as respiratory-competent in the previous iterations of this assay with either the base media alone or with p-CA supplementation; the amount of colorimetric respiration was much lower and kinetically slower to detect with the serine or quinic acid conditions which were not detected in the other conditions (Fig. 4B). Alanine and L-lactic acid have no known relation to known PP_0897 activities and it was unclear how these metabolites enabled growth from p-CA and malate. Overall, this respiratory data identified several routes that potentially restored cellular growth in the presence of p-CA, but the mechanism underlying this result would be clearer after HPLC analysis of p-CA consumption in the following section.
Next, we cross-validated the growth phenotypic data against the GSMM using FBA to determine model fidelity for substrate utilization in a completed Design 1 strain (also see Supplementary Results). Across the 190 unique carbon substrates in plates PM1 and PM2A, the prediction accuracy for substrate utilization was 78% accurate, using only minor modifications to the existing GSMM (Materials and Methods, Fig. 5A). Model false positives included acetic acid and serine, structurally different molecules with no obvious explanation for this behavior. This result indicates most substrate utilization profiles are accurately predicted using the P. putida GSMM in a growth-coupled strain and that the inability to accurately predict p-CA utilization is an outlier. In the p-CA supplementation data, fewer substrates were able to drive respiration in the growth phenotyping assay, reducing the number of true positive compatible metabolites from 18 to 6, including ɑ-D-glucose, D-gluconic acid, L-alanine, D-alanine and L-lactic acid (Fig. 5A, red dots). Serine, identified as a compatible metabolite for the p-CA malate condition but not the p-CA alone condition, was a false positive in the FBA model.
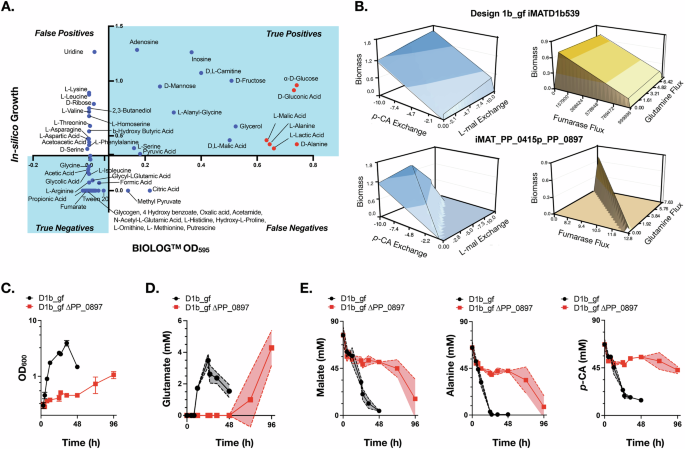
A Model validation using BIOLOGTM phenotyping. Blue dots indicate each of the 190 metabolites tested (refer to Supplementary Table 4 for details), and the light blue shaded region shows the accurately predicted metabolites, including 16 true positives and 75 true negatives. Red dots indicate the subset of metabolites6 that successfully rescued growth when fed both p-CA and l-malate. B Double robustness analysis on mixed carbon source utilization for growth and production. C–E Strains D1b_gf and D1b_gf ∆PP_0897 were fed three carbon sources, 50 mM p-CA, 100 mM malate, and 100 mM alanine. Samples were analyzed at the indicated time points for growth and metabolic profiles. C Optical density (OD600) was monitored every 4 h. D Glutamate concentrations for strains D1b_gf and D1b_gf ∆PP_0897, intracellular and extracellular values pooled together. E Consumption profiles of the three carbon sources (malate, alanine, and p-CA) from the culture medium were monitored at the indicated time points using LC–MS. Error bars represent mean ± S.D. (n = 3) in (C). The shaded region represents mean ± S.D. (n = 3) in (D and E).
As FBA prediction for p-CA utilization did not match the experimentally validated no-growth phenotype, we returned to the sensitivity analysis method to model the relationship between p-CA and malate flux across different flux rates in the PP_0897 promoter titration strains where growth on p-CA is observed (Fig. 5B). We compared these results with our earlier findings to identify trends with the glutamine and fumarate flux space in a mixed carbon-feed regime with cells fed only p-CA (Fig. 3D). While the Design1b_gf_iMATDb539 has an unconstrained utilization space where both p-CA uptake and malate flux are possible, the robustness analysis here indicated the promoter titration strains would have substantially overconstrained permissible flux space for growth and production when its p-CA and L-malate compared to Design1b_gf_iMATDb539. The presence of malate further constrains the sensitivity analysis for glutamine or fumarase flux (Fig. 5B).
Since D-alanine supported robust metabolic respiration in all conditions assayed, it was selected to test whether it would rescue the growth of D1b_gf ∆PP_0897 in the presence of p-CA and malate. We determined a media composition with 50 mM p-CA, 70 mM l-malate and 70 mM d-alanine was optimal for restoring growth of the strain D1b_gf ∆PP_0897 but even under these conditions, the strain was slow-growing and required 72 h to reach a maximal OD600 of ~1.0 (Fig. 5C). Metabolite analysis of the culture supernatants revealed that the growth of D1b_gf ∆PP_0897 was mainly supported by the co-consumption of l-malate and d-alanine, while p-CA use was limited (Fig. 5E). In contrast, the growth of the parental strain D1b_gf was robust in the same medium and all three carbon sources were depleted within 48 h. While the D1b_gf strain metabolized a wider set of available carbon sources with an overall increase in supplied carbon, indigoidine production increased only 1.2-fold compared to M9 60 mM p-CA alone, suggesting most of the carbon was utilized to support biomass formation (Supplementary Fig. 8). D1b_gf ∆PP_0897 produced 10-fold lower indigoidine than the D1b_gf strain under the same media conditions. Glutamate cellular pools quantified by LC–MS show the trends for growth and indigoidine precursor accumulation (Fig. 5D). In the strain D1b_gf the increase in glutamate pools was observed between 12 h and 24 h (Fig. 5D). This increase coincided well with the growth dynamics (Fig. 5C) and all three substrate–medium depletion profiles (Fig. 5E). In contrast for strain D1b_gf ∆PP_0897, the glutamate and glutamine pools accumulated after 48 h of cultivation which coincided with a significant increase in growth after 48 h of growth and consumption profiles of malate and alanine, but not p-CA. This result suggests that the cellular production of glutamine/glutamate is strongly linked to the strain growth and that the co-metabolites did not enable p-CA degradation.
To understand the global changes as a result of the additional deletion of PP_0897 in addition to a medium containing multiple carbon sources, we sampled the two strains at comparable OD600 of 0.8 and analyzed the proteomics profiles (Supplementary Fig. 9 and Supplementary Data S2). Overall, the strain D1b_gf ∆PP_0897 compared to D1b_gf in M9 p-CA d-alanine l-malate (pAM) medium had 146 abundantly distinct proteins (“Materials and methods”). Fifty-three proteins were associated with metabolic functions, including aromatic compound catabolism via the beta ketoadipate pathway, TCA, oxidative phosphorylation, and branched-chain amino acid metabolism. Of these, proteins associated with p-CA catabolism were downregulated with the exception of PcaF in the D1b_gf ∆PP_0897 strain. An additional 58 proteins associated with a broad range of regulatory functions including stress response (PP_2745, PP_3237, PP_3288, and PP_3290, all downregulated), peroxidase activity (PP_1686, Ahpf, and AhpC, all upregulated) and transcriptional regulation activity (PP_0876 and PP_4602, highly upregulated while PP_4400/Bkdr, PP_0175, and PP_1313, were downregulated) exhibited different abundance levels upon complete inactivation of the fumarate-malate TCA node in this strain.
When we characterized the impact of p-CA in the media by comparing the strain D1b_gf ∆PP_0897 in M9 pAM medium versus M9 d-alanine l-malate medium (Supplementary Fig. 9 and Supplementary Data S2), we observed an overall similar trend of proteins with varying abundance in the earlier comparison. Of the 167 differentially expressed proteins, 72 proteins were associated with metabolic functions, and 95 were associated with regulatory functions. The addition of p-CA resulted in an increased abundance of many early p-CA catabolism-related proteins (Ech, Fcs, Vdh, highly upregulated), but PobA, PcaH, and PcaC remained unchanged while CatA was highly downregulated, suggesting these reactions could be rate-limiting p-CA catabolism as their protein abundance was no longer responsive to the aromatic. Other proteins with differential abundance were associated with processes including oxidative phosphorylation (cytochrome-family proteins PP_0103, PP_3822, PP_3823, PP_4258 and PP_5378, all highly downregulated), ABC transport systems with the exception of PP_0615 and PP_5196, were mostly downregulated (PP_4428 and PP_1015), and stress response (PP_1269, upregulated, and PP_3290, downregulated), suggesting p-CA was inducing a larger set of metabolic changes to accommodate cellular stress. In summary, the proteomics data indicated a suboptimal p-CA catabolism response, corroborating the lack of p-CA consumption. Growth coupling to indigoidine could not be maintained. Alanine and malate were the primary carbon sources consumed with p-CA degradation at a much lower rate than in the parent strain, and cellular stress responses suggested the strain became sensitized to grow on this aromatic carbon source.
Discussion
Fumarate and fumarate hydratase play a crucial role in connecting central metabolism to many cellular functions that are not captured by the genome-scale metabolic model. Deletion analyses of homologous fumC fumarate hydratases have been used to probe its function in many processes; a P. aeruginosa PAO1 homolog of PP_0897 was shown to have promiscuous activity on converting mesaconate to (S)-citramalate46. PP_0897 homologs in other species, including E. coli and yeast have been reported to indirectly enhance the DNA damage response to double-strand breaks; the metabolite fumarate modulates the bacterial chemotaxis response37,38,39. Deletion strains of the eukaryotic yeast homolog of PP_0897, FUM1, are viable but growth on non-fermentative carbon sources requires medium supplementation with either aspartic acid, asparagine, or serine47, parallel with our observations on nutrient auxotrophy in the D1b_gf ∆PP_0897 strain. However, in this study, implementation of this final deletion resulted in a strain that did not grow nor produced per the predicted design. While modulation of the PP_0897 gene enabled systems that recovered growth and production phenotypes, some aspects of the results require additional studies for a better mechanistic understanding. Measurement of glutamine and glutamate levels revealed that glutamate cellular pools could be modulated by changing PP_0897 levels in the D1b_gf strain. However, we did not observe a stoichiometric conversion of these intermediates to the final product indigodine, suggesting cofactor imbalances or other growth and pathway protein expression impacts that remain obscure. In this regard, proteomics data proved instrumental in understanding the strain behavior when PP_0897 activity was altered and could be used to develop context-specific models that confirmed the narrow flux required for the FUM reaction. Ultimately, the best experimental solution obtained from the Design 1 strains is those that permitted some activity through this reaction, outperforming strains where the node was fully inactive. Flux through this node is required for biomass formation as well as specific final product yields demanded by the growth coupling design.
The key insight of this study comes from the double sensitivity analysis that enabled the evaluation of a single gene intervention representing a limiting enzymatic reaction on both growth and production. Specifically, double sensitivity analysis maps the production of the target metabolite and implementation of a gene deletion while optimizing for growth and fitness. In the ideal situation, the ratio of biomass to final product remains consistent irrespective of specific growth rates. In contrast, we find an inconsistent growth rate to product formation rate ratio. An intervention of up to three steps yields a configuration with a broad permissible growth and acceptable indigoidine production space, whereas titrating down the expression of the last gene, PP_0897 changes the ratio of growth rate to indigoidine yield. These results imply that the PP_0897 deletion in the cutset is inviable because the permissible space for growth and production is constrained below a threshold acceptable for biological function. As a result, neither production nor growth can occur. While such a double sensitivity analysis is not a conventional approach used to analyze growth-coupled designs, it accurately recapitulates post hoc the experimental evidence in this study. The data-curated model from the promoter titration strain exhibits the overconstrained permissible design space for the growth-coupled phenotype in these scenarios.
Advancement in bioproduction and biomanufacturing necessitates the implementation of large sets of gene interventions for strain design and the solutions encountered here may be generally applicable for other final products and hosts. Non-model hosts (e.g., P. putida48, P. taiwanensis49, Vibrio natriegens50), non-canonical carbon sources (e.g., lignin-derived aromatics17, the C1 carbon, formate51) or poorly studied growth formats (e.g., membrane or other alternative bioreactors formats52,53) are increasingly found advantageous in these biomanufacturing scenarios. Our methods characterizing p-CA as a carbon source highlighted a limitation in applying predictions from GSMMs. Extending these methods to other non-model hosts, non-canonical carbon sources, and growth formats mentioned may also require a similar understanding of the designs from computational predictions to enable experimental implementation.
As a learning from this strain development cycle, we propose that a stringent threshold for evaluating cutsets may reconcile imperfections in models with their implementation. Enzymatic reactions selected for removal are mapped back to their corresponding coding sequences. Previously, we assumed reactions in the metabolic model mapped to genes encoding only one biological activity and excluded only those that were potentially essential. While we now know that fumarate hydratase PP_0897 is not an essential gene in P. putida, its activity (or its isozymes) was still required for growth when using nonconventional carbon streams like p-CA in the D1b_gf strain background. As such cutsets should be filtered to remove essential genes, known multi-functional enzymes, and sequences where multiple proteins are encoded in the same DNA sequence in a sense-antisense configuration54. An analysis of available RB-TnSeq55 datasets indicates several other TCA cycle enzymes may result in a dependency similar to that observed for PP_0897. Specifically, when a gene locus is absent from the P. putida RB-TnSeq library, it may suggest that a transposon in that locus is lethal and represents an essential gene. However, targeted genetics and corresponding mutants in homologs have been reported in other Pseudomonads and suggest that a mutant in that gene could be recoverable under the appropriate conditions. For example, it is likely that attempts to fully inactivate the citrate synthase or succinate dehydrogenase, for example, would also be difficult. These additional precautions will preserve cutset fidelity as enzymatic reactions are translated to encoded genes selected for strain engineering. Algorithms that output potentially over-constrained solutions via strong growth coupling are a powerful approach to obtaining strong production phenotypes that are able to meet the stringent titer, rate, and yield demands necessary for an economically viable bioconversion process using renewable carbon streams56. These approaches will become more valuable as additional catabolic profiles are discovered and introduced into host platforms49,57,58. Modifying the current growth coupling workflow that accounts for these additional findings in conjunction with functional genomics and ALE could enable streamlined strains for biomanufacturing.
Materials and methods
Cultivation of Pseudomonas putida
Strains used in this study were propagated using conventional laboratory cultivation protocols for P. putida KT244059,60,61. Engineered strains were grown in a modified M9 minimal medium as previously described21, and p-CA (Sigma-Aldrich, Product No. C9008), l-malic acid sodium salt (Sigma-Aldrich, Product No. M1125) and d-alanine (Sigma-Aldrich, Product No. A7377) were used at the concentrations indicated in the figure legends. All analytes were prepared at a concentration of 0.5 M using reverse osmosis water and filter-sterilized (0.2 mm SFC, Nalgene, Cat. No. 291–4520). The pH of l-malic acid and p-CA was adjusted to 6 and 8, respectively, using NaOH pellets (Sigma-Aldrich, Product No. S8045) before filter sterilization. Strains and plasmids used in this study are described in Supplementary Table 1 and Supplementary Table 2.
For production runs, strains were prepared for growth in M9 minimal salt medium with two adaptations as described in ref. 21. In total, 30 mM 3-(N-Morpholino)propanesulfonic acid (MOPS) (Sigma-Aldrich, Product No. 69947) was used as a buffering agent at pH 7 during the experimental time course. l-arabinose (Sigma-Aldrich, Product No. A3256) was added to induce genes under the BAD promoter at a concentration of 1.5 w/v% unless otherwise indicated. Transformation of plasmids and oligos in P. putida strains was conducted using standard electroporation techniques described in ref. 7, and strains harboring the overexpression plasmids were kept for no more than two weeks before regeneration. Kanamycin (50 µg/mL) or gentamicin (30 µg/mL) was supplemented to the culture medium as indicated in the respective figures when required.
Construction of plasmids and targeted genomic mutants via recombineering
In-frame genomic deletions and promoter substitutions were generated exactly as described in ref. 60. All recombineering 90-mer ssDNA oligos and gRNA targeting sequences were synthesized by IDT (Integrated DNA Technologies, Redwood City, CA) and are described in Supplementary Table 3. Clones were genotyped with colony PCR to detect loss of the precise open reading frame with primers at least 40 base pairs downstream of the sequences chosen for use in the recombineering oligos. PCR reactions were carried out with NEB OneTaq (New England Biolabs (NEB), Product No. M0482L) following incubation in 20 mM NaOH at 94 °C for 30 min with PCR conditions exactly as described by the manufacturer Synthetic promoter substitutions were verified by sequencing the targeted locus (Azenta Life Sciences, Burlington, MA).
All DNA constructs and oligos were designed using Snapgene (BioMatters Ltd.). Amplification of DNA fragments by PCR was conducted using Q5 polymerase (NEB) following the manufacturer’s guidelines. Plasmids were assembled using HiFi assembly (New England Biolabs (NEB), Ipswitch, MA) following the manufacturer’s guidelines. Whole plasmid sequencing (Primordium Labs, Monrovia, CA) and Sanger sequencing (Genewiz Inc, South Plainfield, NJ) were used to verify constructs as necessary.
Indigoidine colorimetric quantification and specific indigoidine yield assessment
Indigoidine extraction and measurement were described previously in ref. 21 and modified slightly. Briefly, the pH of the culture was adjusted to 7 before sampling if necessary. Samples were then collected and centrifuged at 6010×g for 3 min to precipitate the insoluble indigoidine fraction and cell debris. The cell pellet was resuspended in 100% DMSO pipetting up and down thoroughly, and the mixture was vortexed for 45 min in a Plate Incubator (Benchmark Scientific, Product. No. H6004). Solubilized indigoidine was then separated from the cell debris by centrifugation at 21,130×g for 1.5 min and its concentration was measured by detecting its absorbance at 612 nm using a microplate reader and converted to g/L by applying the standard curve previously generated with purified indigoidine21. This study was conducted concurrently alongside Eng et al.21 and shares the same base strains and purified indigoidine used for the standard curve generated using P. putida fed p-CA.
Strains D1b_gf, D1b_gf PJ23109-PP_0897, and D1b_gf PPP_0415-PP_0897 were tested for indigoidine production in M9 60 mM p-CA as described above. 24 h post-inoculation, the concentration of the synthesized indigoidine was measured. To calculate specific indigoidine titers (mg/CFU), cultures were diluted 50,000-fold and plated on LB agar to allow colony formation. Colonies were counted 24 h post incubation at 30 °C. The indigoidine titer (mg/L) was normalized to the total number of viable cells (CFUs/L).
Glutamine, glutamate, p-CA, l-malate, and d-alanine quantification by UV–vis HPLC and LC–MS
Culture samples were taken and centrifuged at 6010×g for 3 min at the designated timepoints and supernatants were harvested and frozen at −20 °C until their analysis to quantify the substrate consumption of the engineered strains to calculate the indigoidine production yields (g/g).
When p-CA was used as the sole carbon source, its concentration in extracellular supernatant samples was analyzed by HPLC as previously described21,62. Supernatant samples were defrosted at room temperature and diluted in the mobile phase, a solution of 10 mM Ammonium Acetate (Sigma-Aldrich, Cat. No A1542) and 0.07% Formic Acid (Sigma-Aldrich, Cat. No F0507) in HPLC-grade water (Honeywell, Cat. No LC365). A Diode Array Detector (G4212, Agilent Technologies) was used to measure UV absorption at 254 nm, 310 nm, and 280 nm with an Eclipse Plus Phenyl-Hexyl column (250 mm length, 4.6 mm diameter, 5 μm particle size, Agilent Technologies). The flow rate was set to 0.5 mL/min for a 70/30 combination of the mobile phase in water and acetonitrile (Sigma-Aldrich, Cat. No 34851), respectively.
LC–MS was used to monitor substrate co-utilization in M9 minimal media containing p-CA, d-alanine, and l-malic acid. Supernatants were obtained and preserved as indicated above, and the analytes were quenched with 100% methanol (Sigma-Aldrich, Cat. No 34860) and diluted to a final concentration of 50% methanol. For the quantification of glutamine/glutamate pools, both the supernatant and the cell pellet were quenched together with methanol and also analyzed by LC–MS. Due to the spontaneous conversion of glutamine to glutamate at physiological pH values32,63, we report a summed value of both glutamine and glutamate due to the potential for intracellular spontaneous conversion of glutamine back into glutamate.
LC–MS analysis of these analytes was conducted on a Waters Acquity UPLC BEH Amide column, (100-mm length, 2.1-mm internal diameter, and 1.7-μm particle size; Waters Corporation, Milford, MA, USA) using a 1290 Infinity II UHPLC system (Agilent Technologies, Santa Clara, CA, USA). A sample injection volume of 1 μL was used throughout. The sample tray and column compartment were set to 4 °C and 30 °C, respectively. The mobile phase was composed of 10 mM ammonium acetate, 0.2% ammonium hydroxide (Sigma-Aldrich), and 5 µM medronic acid (Sigma-Aldrich) in water (solvent A) and 10 mM ammonium acetate, 0.2% ammonium hydroxide (Sigma-Aldrich), and 5 µM medronic acid (Sigma-Aldrich) in 80% acetonitrile and 20% water (solvent B). The solvents were of LC–MS grade and were purchased from HoneyWell Burdick & Jackson (Charlotte, NC, USA). Analytes were eluted via the following gradient conditions: held at 100%B for 0.5 min, linearly decreased from 100%B to 75%B in 2.43 min, linearly decreased from 75%B to 70%B in 0.35 min, held at 70% B for 0.55 min, linearly decreased from 70%B to 50%B in 0.2 min, held at 50%B for 0.3 min, linearly increased to 100%B in 0.2 min, and held at 100%B for 2.47 min. The flow rate was held at 0.36 mL/min for 4.33 min, linearly increased from 0.36 mL/min to 0.5 mL/min in 0.2 min, and held at 0.5 mL/min for 2.47 min. The total UHPLC run time was 7 min. The UHPLC system was coupled to an Agilent Technologies 6545 quadrupole time-of-flight mass spectrometer (for LC-QTOF-MS). The QTOF-MS was tuned with Agilent Technologies ESI-L Low concentration tuning mix (at a tenth of its concentration) in the range of 50–1700 m/z. Electrospray ionization via the Agilent JetStream Source (AJS) was conducted in the negative ion mode (for [M–H]− ions), and a capillary voltage of 3500 V was utilized. Drying and nebulizer gases were set to 10 L/min and 20 lb/in2, respectively, and a drying-gas temperature of 300 °C was used throughout. AJS sheath gas temperature and sheath gas flow rate were set to 350 °C and 12 L/min, respectively, while the nozzle voltage was set to 2000 V. The fragmentor, skimmer, and OCT 1 RF Vpp voltages were set to 100 V, 50 V, and 300 V, respectively. The data acquisition rate was set to 0.86 spectra/s. The data acquisition range was from 60–1100 m/z. Data acquisition (Workstation B.08.00) and processing (Qualitative Analysis B.06.00 and Profinder B.08.00) were conducted via Agilent Technologies MassHunter software. Glutamate was quantified via a nine-point calibration curve from 0.39 to 100 μM whereas malate, p-CA, and alanine were quantified via seven-point calibration curves from 0.78 to 50 μM with R2 coefficients of ≥0.99.
BIOLOG phenotype microarray
A BIOLOGTM phenotype microarray assay (Cat. No. 12111, & Cat. No. 12112, Hayward CA) was conducted using strain D1b_gf ΔPP_0897. These plates use a tetrazolium dye to detect respiratory products rather than bulk changes in biomass formation rate as a proxy for cellular growth64,65 and have been used to characterize various P. putida strains43,44,66,67. A freshly grown single colony was isolated from an LB agar streakout plate after overnight growth from cryostorage and used to inoculate an overnight liquid LB culture at 30 °C. A 1.5 mL aliquot was harvested by centrifugation and washed once with 500 µL M9 medium to remove trace media. Phenotyping plates were prepared exactly as described using the manufacturer’s protocol and incubated at 30 °C without shaking. Redox dye formation was monitored at OD595 24 h and 48 h post inoculation using a Filtermax F5 plate reader (Molecular Devices LLC, San Jose, CA).
Shotgun proteomics analysis
The D1b_gf strains designed in this study were grown in triplicates in M9 60 mM p-CA, or M9 50 mM p-CA supplemented with 70 mM d-alanine and 70 mM l-malate when indicated, using 10 mL culture tubes. The strains were back-diluted to a starting OD600 of 0.05 from a saturated culture, and samples were harvested when cells reached mid-log phase (OD600 = 0.8–1) and stored at −80 °C until sample preparation. After all samples were collected, protein was extracted from harvested P. putida strain cultures and tryptic peptides were prepared by following established proteomic sample preparation procedures68. Briefly, cell pellets were resuspended in Qiagen P2 Lysis Buffer (Qiagen Sciences, Germantown, MD, Cat. 19052) for cell lysis. Proteins were precipitated with the addition of 1 mM NaCl and 4× volume acetone, followed by two additional washes with 80% acetone in water. The recovered protein pellet was homogenized by pipetting mixing with 100 mM ammonium bicarbonate in 20% methanol. Protein concentration was determined by the DC protein assay (BioRad Inc, Hercules, CA). Protein reduction was accomplished using 5 mM tris 2-(carboxyethyl)phosphine (TCEP) for 30 min at room temperature, and alkylation was performed with 10 mM iodoacetamide (IAM; final concentration) for 30 min at room temperature in the dark. Overnight digestion with trypsin was accomplished with a 1:50 trypsin:total protein ratio. The resulting peptide samples were analyzed on an Agilent 1290 UHPLC system coupled to a Thermo Scientific Orbitrap Exploris 480 mass spectrometer for discovery proteomics69. Briefly, peptide samples were loaded onto an Ascentis® ES-C18 Column (Sigma–Aldrich, St. Louis, MO) and separated with a 10 min LC gradient (10% Buffer A (0.1% formic acid (FA) in water)—35% Buffer B (0.1% FA in acetonitrile)). Eluting peptides were introduced to the mass spectrometer operating in positive-ion mode and were measured in data-independent acquisition (DIA) mode with a duty cycle of 3 survey scans from m/z 380 to m/z 985 and 45 MS2 scans with a precursor isolation width of 13.5 m/z to cover the mass range. DIA raw data files were analyzed by an integrated software suite DIA-NN69. The database used in the DIA-NN search (library-free mode) is the latest Uniprot P. putida KT2440 proteome FASTA sequence plus the protein sequences of heterogeneous pathway genes and common proteomic contaminants. DIA-NN determines mass tolerances automatically based on first-pass analysis of the samples with automated determination of optimal mass accuracies. The retention time extraction window was determined individually for all MS runs analyzed via the automated optimization procedure implemented in DIA-NN. Protein inference was enabled, and the quantification strategy was set to Robust LC = High Accuracy. Output main DIA-NN reports were filtered with a global FDR = 0.01 on both the precursor level and protein group level. A jupyter notebook written in Python executed label-free quantification (LFQ) data analysis on the DIA-NN peptide quantification report and the details of the analysis were described in the established protocol70. Differentially expressed proteins were binned as statistically significant with a p-value ≤0.03. To be binned as downregulated or upregulated, protein fold expression changes had to meet a minimum threshold of log2 fold change of >2.5 for upregulated or log2 fold change of <−2.5 for downregulated proteins.
Constraint-based modeling and simulations
The P. putida KT2440 genome-scale metabolic model (GSMM) iJN146371 and constraint-based modeling methods72 were used to simulate the experimental scenarios. Aerobic conditions with p-coumarate (p-CA), which is represented as Trans-4-Hydroxycinnamate (T4hcinnm) in the GSMM, was used as the sole carbon source to model growth in p-CA minimal medium conditions. The lower flux bounds for ATP maintenance demand and p-CA exchange were 0.97 mmol ATP/gDCW/h and −10 mmol p-CA/gDCW/h, respectively. Flux balance analysis (FBA)73 was used to validate the BIOLOGTM phenotypes observed for the engineered strain by customizing the GSMM to best represent the engineered strain. Excretion of byproducts was initially set to zero, except for the reported secreted products specific to P. putida (gluconate, 2-ketogluconate, 3-oxoadipate, catechol, lactate, ethanol, methanol, CO2, and acetate) that had an upper flux bound of 1000 mmol/gDCW/h. The heterologous two-gene indigoidine production pathway was also added to the GSMM, and all four Design One cutset gene targets (PP_0944, PP_1755, PP_1378, and PP_0897) were deleted. For each of the BIOLOGTM carbon sources, an uptake flux of −10 mmol/gDCW/h was set for the respective exchange reaction and we used FBA to maximize the biomass reaction, which was selected as the objective function. The production envelope was generated using robustness analysis using the Design One cutset configured GSMM and p-CA as the sole carbon source, biomass reaction as the objective function, and indigoidine as the control reaction74,75. For the glutamine production simulations, pseudo reactions for external export (DF_gln__L) and exchange (EX_gln__L_e) were added to the model, and the EX_gln__L_e reaction was used as the objective when simulating glutamine production.
Double Robustness analysis74,75 was performed to check for sensitivity of biomass objective function towards the change in flux magnitude through a pair of reactions, i.e., glutamine or indigoidine biosynthesis reaction (EX_gln__L_e or EX_ind_e) and the fumarase reaction (FUM). COBRA Toolbox v.3.072 in MATLAB R2017b (Mathworks Inc., Natick, MA, USA) was used for FBA and Double Robustness analysis simulations with Gurobi Optimizer 10.0 (http://www.gurobi.com/) as the solver. The custom scripts used are included in the supplementary data (Supplementary Data S1).
Proteomics data integration to create context-specific models
The proteomics data and the P. putida D1b_gf reduced model, iMATD1b539, were used to extract context-specific models for the two promoter-based strains. We used the integrated metabolic analysis tool (iMAT) algorithm76, which uses discrete levels for expression values: low, medium, and high. iMAT allowed the integration of proteomics data into the GSMM and maximized highly and minimized lowly expressed reactions from the model. We used the log2 fold changes for protein counts with respect to D1b_gf in PJ23109 and PPP_0415 strains to perform this classification with a cutoff of half a standard deviation above the mean of the log2FC values, for active reactions, and half a standard deviation below for inactive reactions. We used the iMAT algorithm to iteratively search for a set of active reactions within the cutoff range linked to the levels of the associated proteins that simultaneously are able to result in biomass and indigoidine production. Simulations were performed using the iMAT implementation in the COBRA Toolbox v.3.072 in MATLAB R2017b (Mathworks Inc., Natick, MA, USA) and CPLEX 12.8 as the solver. Any other versions of the Toolbox, MATLAB, or solvers may result in infeasible or different results and will need to be troubleshooted accordingly. The custom scripts used are included in the supplementary data (Supplementary Data S1).
Responses