Addressing the challenges in journal evaluation during the “covidization” of scientific research era : insights from the CAS journal ranking

Introduction
Citation-based journal ranking systems, such as Journal Impact Factor and CiteScore, play a fundamental role in academic evaluation, influencing institutional performance assessment, academic promotions, and funding decisions. The accuracy and stability of these evaluation systems have long been a critical concern in scientometrics research, with particular emphasis on achieving a balance between indicator robustness and sensitivity.
The COVID-19 pandemic has fundamentally disrupted the global scientific ecosystem, profoundly affecting research priorities (Yong 2020; Hill et al. 2021; Shapira 2020; Ioannidis et al. 2021), funding allocation (Medical Research Council 2020; National Natural Science Foundation of China 2020; National Institutes of Health 2020), collaboration patterns (Cai et al. 2021; Cunningham et al. 2021; Abramo et al. 2022), and publication practices (Horbach 2020; Aviv-Reuven & Rosenfeld 2021; Forti et al. 2021; Bürgi and Wohlrabe 2022). This disruption, characterized by massive production and high citation rates of COVID-19-related publications – a phenomenon termed “covidization” of scientific research – has significantly impacted quantitative evaluation systems, including journal evaluation.
Traditional journal metrics like JIF and CiteScore have shown substantial fluctuations during this period, affecting the stability of their ranking systems. However, the CAS Journal Ranking, China’s most influential journal ranking system, has demonstrated notable resilience, maintaining relatively stable journal rankings throughout the pandemic. This differential response to crisis-induced citation patterns presents an important opportunity to examine the features that contribute to indicator stability.
Given that journals are viewed as clustered entities requiring robust evaluation outcomes, understanding how journal ranking systems perform during major crises becomes crucial. This study comprehensively analyzes the performance of CAS Journal Ranking during the COVID-19 pandemic, identifying the key elements that contribute to its resilience. Our findings aim to inform the scientometric community’s efforts to refine existing indicators and design new ones that can maintain stability during future disruptions to the scientific enterprise.
Literature Review
Fluctuations in journal evaluation indicators
The COVID-19 pandemic has exposed significant challenges in quantitative journal evaluation, particularly due to the surge in highly cited pandemic-related papers. Recent studies have documented substantial changes in various journal citation impact indicators during this period.
Analysis of Journal Citation ReportsFootnote 1 data shows widespread increases in JIF due to COVID-19 publications (Zhang et al. 2022; Maillard and Delory 2022; Delardas and Giannos 2022; Park et al. 2022; Li and Ding 2022). This impact extended beyond medical journals to publications in biology, chemistry, economics, and agriculture (Liu et al. 2023). While some journals saw dramatic JIF increases, research indicates that the impact per individual COVID-19 paper actually decreased as more pandemic-related papers were published (You et al. 2023).
Different metrics showed varying levels of stability during this period. Mondal et al. (2022) found substantial increases in both JIF and SNIP for pediatric journals in 2020, while Eigenfactor remained stable. Fassin (2021) predicted the pandemic’s impact on h-index and JIF would persist until at least 2024. Zheng and Ni (2024) discovered that journals with substantial COVID-19 publications experienced notable increase in their JIF, SJR, and SNIP rankings. Interestingly, Sjögårde (2022) found that field normalized citation scores (FNCS) of non-COVID-19 papers generally increased after removing COVID-19 papers, even in fields with low pandemic-related publication rates.
These findings highlight a critical issue: using citation impact metrics during crisis periods may create unintended disparities among journals and misrepresent their true scholarly impact. This situation emphasizes the need for more robust evaluation methods that can maintain reliability during periods of unusual citation patterns.
CAS Journal Ranking
CAS Journal Ranking system plays a significant role in academic publishing in China, with nearly 500 universities and research institutes using it to guide publication submissions and evaluate research (Huang et al. 2021). This ranking system significantly influences where Chinese researchers choose to submit their work (Quan et al. 2017; Kulczycki et al. 2022; Li et al. 2023). The system’s importance is further highlighted by its integration into Elsevier’s Journal Finder, a widely-used journal recommendation platform.
Data and methods
Journals and publication data
We analyzed 11,950 journals consistently included in JCR 2020 to 2022 and indexed in SCIE and SSCI. From these journals, we collected over 3.5 million article and review papers published in 2018–2019, which increased to nearly 3.9 million for 2019–2020, and reached 4.2 million for 2020–2021. Using the World Health Organization COVID-19 Database search criteria, we identified 119,227 COVID-19 related papers within this dataset. Throughout this study, we use JCR year (Y) as our reference point, which counts citations received in year Y for papers published in years Y-1 and Y-2. This means COVID-19 papers first appeared in JCR 2021 calculations, which covered publications from 2019–2020.
The classification system data
We use the JCR subject category and CWTS paper-level classification system to compare the effect of normalization system on journal ranking. The CWTS classification system assigns individual publications to a field at three levels of granularity—macro, meso, and micro. This is done based on a large-scale network community detection of hundreds of millions of citation relations between publications.Footnote 2 We primarily utilize the meso-level containing around 838 topics and the micro-level with approximately 4159 topics. The JCR journal-level classification system puts journals into 254 subject categories, allowing each journal to be assigned to one or more categories.
Journal citation impact indicators
In this paper, we compared the performance of JIF, FNCSI and CNCI in response to the impact of “covidization” of research within both the CWTS and the JCR classification systems. Similar to the data employed in calculating JIF, the data used for calculating the FNCSI and CNCI indicators contains citations in year Y of articles and reviews published in Y-1 and Y-2. More details about FNCSI and CNCI will be introduced in the section below.
-
Field Normalized Citation Success Index (FNCSI)
FNCSI is the indicator used in CAS Journal Ranking. It extend the Citation Success Index (CSI) (Milojević et al. 2017) to field normalization version with a paper-level classification system. FNCSI is defined as the probability that a randomly selected paper from a particular journal will have a higher citation count compared to a randomly selected paper on the identical topic and document type from other journals (Shen et al. 2018; Tong et al. 2023). For instance, in the case of journal A, we compare the citations of each paper published in journal A with the citations of papers on the same topic (micro-level fields) and of the same document type. This allows us to assess the impact of each paper within its respective topic. Finally, we aggregate these individual impacts at the journal level to obtain the FNCSI of journal A, denoted as FNCSIA:
$${{FNCSI}}_{A}={sum }_{t,d}Pleft({A}^{t,d}right)Pleft({c}_{a} > {c}_{o}left|ain {A}^{t,d}right.,oin {O}^{t,d}right)$$(1)Where ({c}_{a}) is the citation count of a single paper in journal A, where t belongs to the set of topics {topic1, topic2,…}, and d belongs to the set of document types {article, review}. Let ({A}^{t,d}) denote the papers in topic t with document type d that belong to journal A, and O denote the papers from all other journals.
-
Category Normalized Citation Impact (CNCI)
CNCI,Footnote 3 also named Field-Weighted Citation ImpactFootnote 4 (FWCI) is calculated by dividing the actual count of citing items by the expected citation rate for documents with the same document type, year of publication and subject area. Based on this, the CNCI of a set of documents, for example the collected works of a journal, institution or country/region, is the average of the CNCI values for all the documents in the set. Here, the CNCI value for journal A is determined as:
$${{CNCI}}_{A}=frac{sum _{t,d}{sum }_{ain {A}^{t,d}}{c}_{a}/{mu }_{t,d}}{{N}_{A}}$$(2)Let ({mu }_{t,d}) denotes the average citation count of publications within topic t and document type d. CNCI indeed represents one family of indicators, Journal Citation Indicator (JCI) is one instance.
By combining the classification system, four indicators are obtained: CWTS-FNCSI, JCR-FNCSI, CWTS-CNCI and JCR-CNCI. To be consistent with the calculation of the JIF, the above indicators are based on a two-year citation window.
Results
Journal impact indicators are expected to maintain temporal stability since journals’ reputation and quality control typically remain consistent across consecutive years. As Rousseau (2002) notes, citation-based journal rankings remain valid when fluctuations in impact reflect genuine changes in journal quality rather than random processes or noise. Additionally, robust indicators should demonstrate minimal sensitivity to changes in the underlying publication set used for calculation. Our analysis therefore focuses on temporal changes in various indicators and the stability of journal rankings before and after excluding COVID-19 papers.
Changes of indicators over time
JIF has known vulnerabilities to “random effects”, including the inflation of cited reference lists (Althouse et al. 2009), and the sudden rise of “unforeseen hot papers” (Gorraiz et al. 2012). Figure 1 represents JIF changes across 11950 journals from 2020 to 2022. The JIF data published in the last two years in JCR reveals significant fluctuations. Compared to the year 2020, in 2021, over 66% of the journals increased in JIF, with 86 journals increasing by more than 10 points, and 348 journals showing growth exceeding 100%. These increases reflect the academic community’s rapid response to the COVID-19 pandemic. However, by 2022 a reversed trend emerged. 64% of the journals experienced JIF decreases, with 164 journals declined over 60%.

Changes in JIF from 2020 to 2022.
To quantify the volatility of journal indicators, we calculate the standard deviations of JIF, FNCSI, and CNCI across the same journal set during 2020–2022. Figure 2 presents the standard deviation distributions for the various indicators over three years using box plot. This visualizes the median, variability, and range of standard deviations, providing insights into the fluctuation of indicators. FNCSI exhibits a much smaller range of standard deviations compared to CNCI. JIF shows the widest standard deviation range. FNCSI demonstrates greater robustness and resistance to external factors, regardless of the classification system used. These findings suggest that the choice of indicator plays a more crucial role in maintaining evaluation stability than the classification system, though the latter remains a contributing factor to indicator performance.
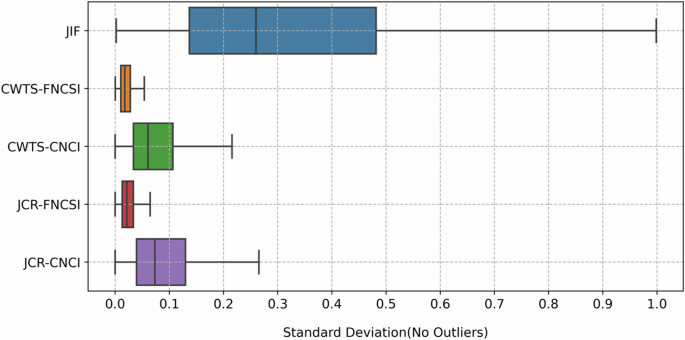
Distribution of standard deviations for various journal indicators from 2020 to 2022.
Stability of journal indicators analysis through COVID-19 paper exclusion
An indicator’s robustness refers to the non-sensitivity to changes in the underlying publication set used for calculation. To measure how journal impact indicators are affected by COVID-19 pandemic, we compared the original indicator values with recalculated values after excluding all COVID-19 papers.
Figure 3 presents the change in JIF after removing COVID-19 papers and the contribution rate of COVID-19 papers to JIF. The contribution rate of COVID-19 papers is defined as (frac{{JIF}-{JIF}({rm{after}}; {rm{removing}}; {rm{COVID}}-19;{rm{Papers}})}{{JIF}}). COVID-19 papers significantly boosted journal metrics with contribution rates exceeding 50% for many journals. In 2021, COVID-19 papers positively contributed to 30% of journals JIFs with 2,372 journals (20%) achieving higher JIFs than in 2020 due to pandemic-related papers. While overall JIF values declined in 2022, COVID-19 papers continued to positively impact about 45% of journals, maintaining substantial contribution rates across many publications.
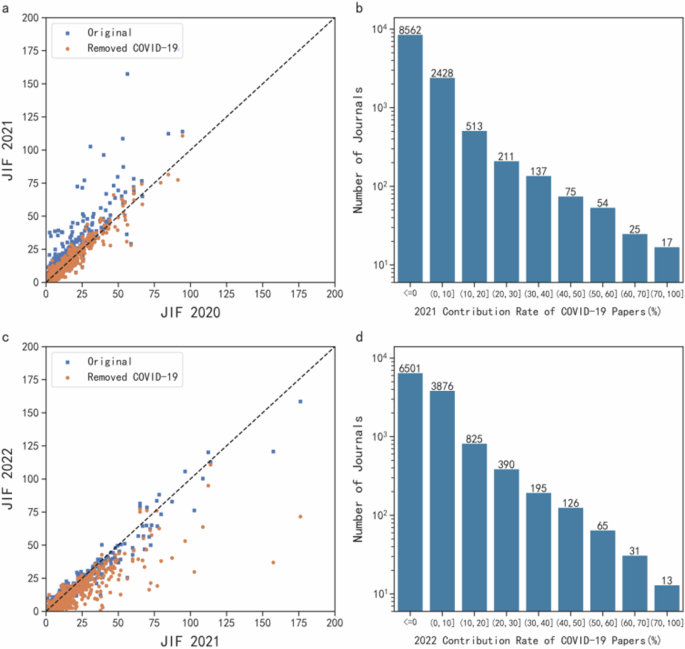
a Comparison of JIF 2021 and JIF 2020 before and after removing covid-19 publications. b Distribution of contribution rate of covid-19 papers for JIF 2021. c Comparison of JIF 2022 and JIF 2021. d Distribution of contribution rate of covid-19 papers for JIF 2022.
Figure 4 compares journal rankings before and after removing COVID-19 papers. The visualization shows two key patterns: First, FNCSI rankings (orange dots) remain closer to the diagonal line in both 2021 and 2022, while CNCI rankings (blue squares) show wider dispersion. This indicates that FNCSI maintains more stable rankings when COVID-19 papers are removed. Second, FNCSI shows smaller ranking changes when using the CWTS paper-level classification system compared to the JCR journal-level system. This suggests that paper-level classification contributes to more stable journal evaluations.
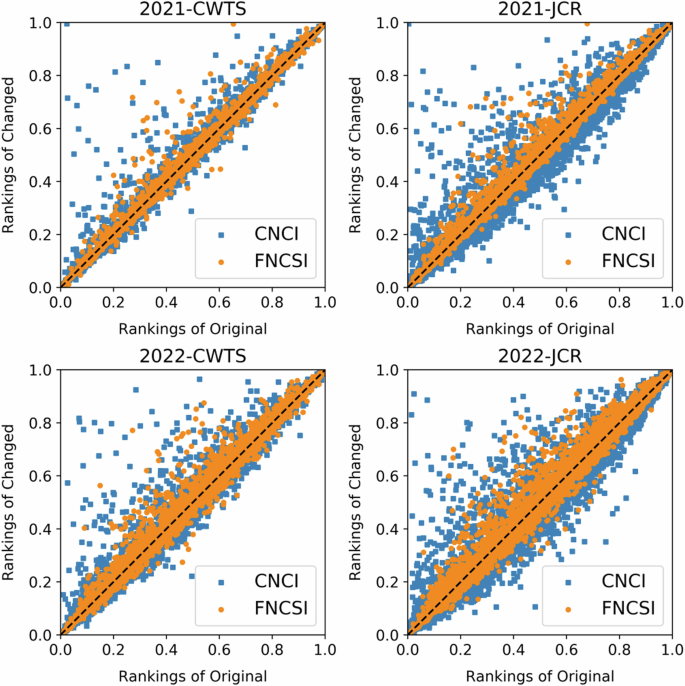
All rankings are normalized by the total number of journals.
Figure 5 displays the distribution of journal ranking changes for different indicator – classification system combinations. The 2021 analysis reveals that JCR-CNCI combination (the blue dashed line) is more severely affected by COVID-19 papers, showing a peak at larger changes with 4.3% of journals shifting over 1,000 ranks. In contrast, the CWTS-FNCSI combination (orange solid line) demonstrated greater stability, with over 85% of journals shifting less than 100 ranks. In 2022, while all distributions showed larger changes, CWTS-FNCSI maintained better stability (71% of journals changing less than 100 ranks) compared to CWTS-CNCI (64%). The CWTS-CNCI distribution also showed more extreme ranking changes, as indicated by its longer right tail. These patterns demonstrate the superior stability of the CWTS-FNCSI combination.
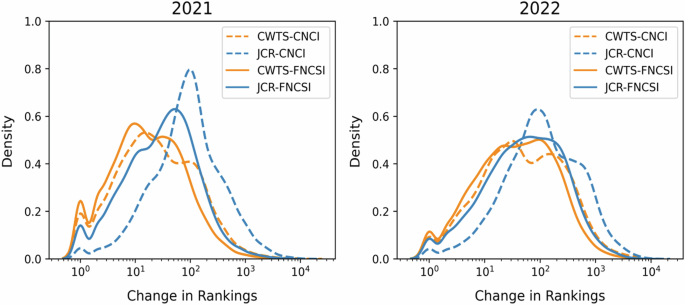
The x-axis shows the change in journal rankings, where 102 indicates that the journal rankings have increased or decreased by 100 positions after removing COVID-19 papers.
To validate our findings, we conducted sensitivity analyses by systematically removing different proportions (10%, 20%, and 50%) of COVID-19 papers. Figure 6 demonstrates that the FNCSI-CWTS combination consistently shows the smallest ranking change across all removal scenarios. The analysis reveals a dual pattern of stability: FNCSI demonstrates superior robustness compared to other indicators regardless of the classification system used, while the CWTS classification system enhances the stability of both CNCI and FNCSI metrics compared to the JCR system. These incremental removal experiments corroborate our findings from the complete COVID-19 paper removal analysis, reinforcing the robust nature of the FNCSI-CWTS combination in maintaining ranking stability even under significant perturbations to the underlying dataset.
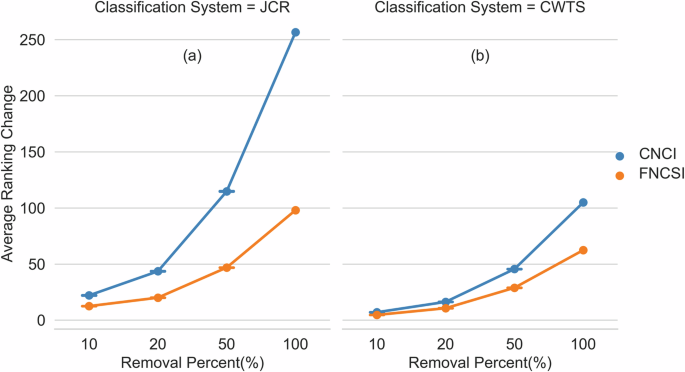
a represents the analysis under the JCR journal-level classification system. b represents the analysis under the CWTS paper-level classification system. The data are averaged over 100 simulations of random removal.
Understanding the resilience of CWTS-FNCSI combination
This section examines why the combination of CWTS classification and FNCSI demonstrated robust performance during the COVID-19 pandemic. Our analysis focuses on two key components: the characteristics of FNCSI as an impact indicator and the advantages of the CWTS paper-level classification system.
The resilience to highly-cited papers of FNCSI
The above analysis shows that when keeping the classification system fixed, the FNCSI is more stable than CNCI. This is because compared with average citation based indicators (e.g., JIF, CNCI), CSI-related indicators are less sensitive to highly-cited papers (Tong et al. 2023).
The rapid “covidization” of scientific research has significantly skewed citation patterns and led to an unusual surge in highly-cited papers. The concentration of citations within COVID-19 research is striking: over 40% of references in COVID-19 publications cite other COVID-19 papers, and more than 80% of citations come from within the COVID-19 research domain (You et al. 2023). While COVID-19 papers made up only 4% of all publications in Scopus by August 1, 2021, they garnered 20% of all citations. In 36 scientific disciplines, COVID-19 papers received over 30% of citations, with General and Internal Medicine seeing the highest proportion at 79.3%. The dominance is further illustrated by the fact that 98 of the top 100 most-cited papers between 2020 and 2021 focused on COVID-19 (Ioannidis et al. 2022). Additionally, 8.54% of COVID-19 papers published in 2020 and 2021 were classified as highly-cited papers in ESI, far exceeding the global average of 1% (Liu et al. 2023).
Figure 7a displays CELL’s citation distribution from JCR 2018 to JCR 2022. During the COVID-19 period (JCR 2021 and JCR 2022), there was a marked increase in papers receiving more than 100 citations. As shown in Fig. 7b, the count of highly-cited papers (those with over 100 citations per year) increased by approximately 2000 papers compared to previous years, representing a significant rise in proportion. This surge in COVID-19 papers and their exceptional citation rates has substantially altered both the journal’s citation distribution pattern and its derived evaluation indicators.
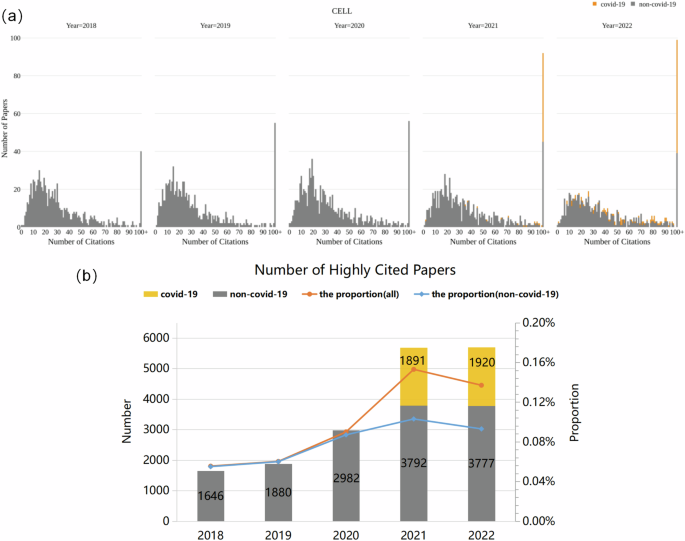
a Citation distributions of CELL from JCR 2018 to JCR 2022. Gray bars represent the citations for non-COVID-19 papers and the orange bars represent the citation distribution of COVID-19 papers. b Number of highly-cited papers (papers with more than 100 citations) across years. The two lines represent the proportion of highly-cited non-COVID-19 papers (blue line) and all highly-cited papers (orange line) relative to the total number of published papers.
Figure 8 shows that approximately 300 journals, representing about 28% of the sample, had all their highly-cited papers devoted to COVID-19 research. Among the top affected journals shown in Table 1, the impact varied significantly by field and journal tier. Prestigious multidisciplinary journals showed different levels of COVID-19 influence—while Science and Nature experienced substantial decreases in highly-cited papers when excluding COVID-19 research, these papers still comprised less than 40% of their total highly-cited works. CELL showed greater COVID-19 dependence, with related papers reaching 60.6% of highly-cited works by 2022. The effect was even more pronounced in major medical journals, where COVID-19 papers accounted for over half of all highly-cited papers in Lancet, NEJM, JAMA, and BMJ by 2022. Some specialized journals, such as the Journal of Medical Virology, Psychiatry Research, and Brain Behavior and Immunity, became entirely dependent on COVID-19 research for their highly-cited papers.
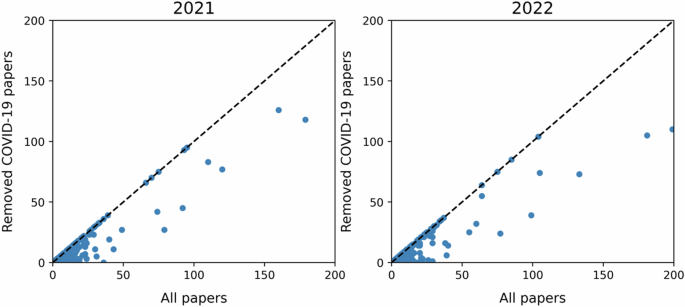
The scatter plot shows individual journals as blue dots, where the x-axis displays the total count of highly-cited papers, while the y-axis shows the remaining count after excluding COVID-19 papers.
The above analysis demonstrates that the “covidization” of research led to a surge in highly-cited papers, significantly impacting citation distributions. Indicators that are sensitive to highly-cited papers and citation distributions were substantially affected during the COVID-19 period. JIF and CNCI, being average-citation-based metrics, are highly sensitive to the inclusion of highly-cited papers in their calculations, with their impact proportional to citation frequency. In contrast, FNCSI assigns a weight of only 1/n to each highly-cited paper. This characteristic makes FNCSI more resilient to disruptions caused by “covidization”, as it is less influenced by extremely highly-cited papers.
Restricting the impact within the COVID-19 topic under the paper-level classification system
Tables 2 and 3 show the distribution of COVID-19 related papers under paper-level and journal-level classification systems, respectively. As shown in Table 2, under the CWTS classification system, approximately 60% of COVID-19 papers fall into category 42, which is highly specific to COVID-19 research, containing representative terms like “severe covid”, “main protease”, and “mers cov”. In contrast, COVID-19 papers were more evenly distributed across categories under the JCR classification system (see Table 3). Given that COVID-19 papers are highly cited, their misclassification into categories less relevant to coronaviruses affects the normalization of these fields and creates an artificially high citation advantage.
This observation highlights the importance of appropriate categorization for papers related to public health emergencies like COVID-19. Using a classification system that clusters most directly relevant papers together, such as the CWTS paper-level approach, can help contain the significant impact of such events on bibliometric indicators across unrelated fields. Proper categorization enhances the normalization of indicators and improves the evaluation accuracy of journals in fields peripheral to the emerging research area.
Conclusion and discussion
The COVID-19 pandemic has fundamentally disrupted scientific citation patterns, challenging traditional journal evaluation methods. The unprecedented surge in COVID-19-related publications and their exceptional citation rates has raised concerns about the validity of standard journal evaluation indicators.
Our analysis of the CAS Journal Ranking system during this period of research “civilization” reveals two critical findings. First, the Field Normalized Citation Score Index (FNCSI) demonstrates notable robustness by reducing the disproportionate impact of individual highly-cited papers on overall journal rankings. Second, the CWTS paper-level classification system effectively contains the citation impact of COVID-19 research by grouping related papers within a specific “coronavirus” category. The system maintains its validity by preventing COVID-19 papers from artificially inflating citation metrics across unrelated research fields. This dual approach – combining FNCSI with CWTS classification – provides a more stable evaluation framework during periods of significant citation pattern disruption.
Future research should address several key limitations and explore new directions. First, there is a need to track the stability of indicators over an extended period beyond our current 2020–2022 analysis window. Given Fassin’s (2021) prediction that the impact of “covidization” may persist until at least 2024, longitudinal studies using wider citation windows would help determine whether the observed changes in journal indicators are temporary fluctuations or represent lasting shifts in the academic landscape. Second, while our study demonstrated that FNCSI with CWTS paper-level classifications offers robust journal evaluation during the “covidization” period, research should expand to examine other ranking-based indicators (Tong et al., 2023). These could include metrics such as the average percentile, which may exhibit similar robustness since their values depend on element rankings rather than absolute values. Additionally, ranking systems using paper-level classifications, like the Leiden Ranking, warrant investigation for their potential resilience. Finally, our understanding of indicator performance should extend beyond the COVID-19 context to encompass various public emergencies, including natural disasters, accidents, and other public health crises. Comparative analyses across different types of emergencies would provide deeper insights into the robustness and effectiveness of various indicators while revealing potential limitations and biases in the evaluation process. Such comprehensive investigation would strengthen our ability to select and apply appropriate evaluation metrics during future disruptions to scientific research.
As research assessment practices evolve, both new and existing journal evaluation indicators require continuous refinement and critical examination, each with their inherent limitations. Organizations that produce journal rankings have a professional obligation to transparently communicate these limitations and provide guidance for appropriate indicator use. Our study’s analysis of indicator performance in real-world applications contributes to understanding their contextual suitability and limitations. This aligns with the principles promoted by the Coalition for Advancing Research Assessment (CoARA),Footnote 5 which advocates for responsible metrics and emphasizes qualitative judgment supported by appropriate quantitative indicators. By highlighting how different indicators perform under specific circumstances, we aim to inform more nuanced and context-aware approaches to journal evaluation.


Responses