Advanced bio-hybrid drone for superior odor-source localization: high-precision and extended-range detection capabilities

Introduction
The olfactory sense, a principal chemical sense among living entities including animals and insects, plays a crucial role in survival by facilitating the localization of food sources and the evasion of predators1,2. Specifically, male moths utilize their ability to track the windborne pheromones of females to accurately locate their mates, a process essential for reproduction3. This behavior involves navigating over extensive distances, sometimes spanning several kilometers, guided by intermittent olfactory cues in a process known as odor-source localization4. Unlike flying insects, conventional navigation systems for flying robots (i.e., drones) typically depend on visual sensors such as thermal imaging, and light detection and ranging (LiDAR)5,6. These systems have been extensively applied but can be compromised under adverse environmental conditions, such as low light, dust, and moisture7. As an alternative to image-based approaches, a navigation technology for small drones has been developed that utilizes the interaction between propellers and the surfaces of objects8,9.
The advancement of autonomous drones as a form of navigation that does not rely on images and incorporates odor-source-seeking behaviors holds the promise of complementing existing navigation technologies and significantly enhancing the utility of drones across various sectors. Olfaction-based navigation will offer the potential for novel navigation technologies that are suited for operation in obscured or damp environments, including disaster-stricken buildings, critical infrastructure inspections (i.e., detecting gas leaks), search and rescue operations, early fire detection, and the identification of drugs and explosives10,11,12. Recent studies have explored the use of small, agile drones equipped with commercial gas sensors for odor-source localization and mapping13,14,15,16. However, these sensors often fall short in selectivity and responsiveness when compared to biological olfactory systems17,18,19, posing challenges in efficiently tracking dynamic odor plumes.
Significant progress has been made over the past decade in the rapidly expanding field of bio-hybrid robotics/systems, which integrates biological components with artificial machinery20,21,22. This interdisciplinary approach utilizes the unique adaptability of organisms and the acute sensitivity of biological sensory systems, presenting unparalleled solutions to challenges not met by existing robotic technologies. Notably, invertebrate tissues such as insect antennae have emerged as effective sensor elements for bio-hybrid applications, capable of consistent odor detection without the need for ongoing maintenance22. By employing a technique known as electroantennography (EAG), these antennae are able to detect odorants through the electrical signals they emit, offering a practical, highly sensitive, and selective approach to odor sensing23,24. Previous research has successfully integrated antennae from species such as the silkworm moth (Bombyx mori), Agrotis ipsilon, and the hawkmoth (Manduca sexta) with both terrestrial and aerial robots, enhancing their capabilities in odor tracing25,26,27. We previously unveiled a bio-hybrid drone equipped with an EAG sensor derived from a silkworm moth antenna, engineered specifically for the localization of odor sources28,29. This innovation marked a significant stride in the development of bio-hybrid drones based on EAG, notably enhancing the accuracy of odor-source detection through strategic modifications to the sensor housing. However, these drones encounter challenges due to their limited search range (2 m or less).
This study demonstrated that a novel search algorithm that strategically introduces pauses in rotational motion, which is a component of the odor-source search behavior of the bio-hybrid drone, and the use of enclosures to improve sensor directivity are key to improving search accuracy and increasing search distance for olfactory-based searching operations. In addition, the development of a gain-modulable EAG sensor and electrodes specifically designed to interface with insect antennae significantly improved overall system performance and operability. It has been reported that many arthropods pause intermittently during odor searches to improve search precision30. However, such pauses are often neglected during robotic odor-source search operations. The developed method, referred to as the “stepped rotation algorithm,” more closely mimics biological odor detection behavior. The implementation of this algorithm in our bio-hybrid drone, coupled with advances in sensors and enclosures, effectively doubled the search range compared to a previous model28, achieving a remarkable search distance of 5 m. These results underscore the enhanced ability of the bio-hybrid drone to cover a significantly larger area and can be used in real-world search operations, such as searching for people after building collapses.
Results
Enhanced EAG sensor
Figure 1a presents images of a male silkworm moth with an isolated antenna positioned on the electrode of an enhanced EAG sensor. Correspondingly, Fig. 1b illustrates the sensing module of this enhanced EAG sensor and the circuit diagram of the sensor’s refined design. This sensor comprises two principal components: the sensing module, which incorporates an amplifier and a filter, and the processing module, which includes a microcontroller, mirroring the configuration introduced in prior research28.

a Male silkworm moth (B. mori) and the placement of its antenna on the gold-plated electrode of the enhanced EAG sensor. b Design of the sensing module and the circuit layout of the enhanced EAG sensor. c 3D model alongside a 2D transparent view of the redesigned sensor enclosure. d Photographs of various perspectives (bird’s eye, side, front, and top views) of the enhanced bio-hybrid drone. e Detailed schematic of the system architecture within the enhanced bio-hybrid drone.
The sensing module features a printed circuit board with dimensions of 15 mm by 23 mm and weighs 1.8 g. The overall mass of the sensor, including the sensing and processing modules, a battery with a capacity of 110 mAh, and the wiring harness, totals 15.5 g. During standard operational conditions, the EAG sensor consumes approximately 0.61 W, with consumption increasing to 0.88 W during phases of data transmission, resulting in an operational lifespan of around 20 min.
An upgrade to the sensing module involved the integration of an analog-to-digital converter (ADC) integrated circuit with a programmable gain amplifier (PGA; ADS1246IPWR; Texas Instruments Inc., TX, USA), facilitating adjustable gain in eight discrete increments (1-, 2-, 4-, 8-, 16-, 32-, 64-, and 128-fold) through command operations. The analog stage amplifies the signal by a factor of 1000, enabling the sensor’s total gain to be precisely adjusted across eight levels, ranging from 1000 to 128,000. The ADC’s resolution was improved from 16 to 24 bits to support the gain adjustments made possible by the PGA, enhancing the resolution over the previous board, which had a fixed gain of ×250028. This adjustable gain mechanism mitigates the impact of individual variations in antennae, which can introduce a certain degree of variability, thereby enhancing signal processing efficiency. To minimize external electrical noise, the cutoff frequency of the high-pass filter (HPF) was established at 1 Hz, while that of the low-pass filter (LPF) was set at 50 Hz. These filter settings were finely tuned for the EAG response frequency characteristic of silkworm moth antennae, optimizing them for drone application. Moreover, a moving average filter, averaging ten sampling points, was implemented to further refine signals in all EAG measurements performed with the drone.
The electrode structure’s design and material composition for the EAG sensor were meticulously optimized for compatibility with silkworm moth antennae. In previous iterations, the electrodes were made from brass rods, coated with Ag/AgCl ink to form a cylindrical shape28. However, owing to the size variability of the antennae from different silkworm moths, particularly the shorter ones, achieving a stable connection between the antennae and the electrodes posed significant challenges. Additionally, the conductive gels used (Spectra 360; Parker Laboratories, NJ, USA) tended to dry out rapidly because of the constant airflow during drone flights. The routine post-measurement cleaning of the electrodes with a 70% ethanol solution and Kimwipes also led to the gradual removal of the Ag/AgCl coating, eventually exposing the underlying brass rod. To overcome these challenges related to structure durability and longevity, this study introduced electrodes with a novel grooved design and a gold-plated finish (illustrated in Fig. 1a). This alteration notably improved the antennal contact area, simplifying the attachment process and enhancing connection stability. An increased amount of conductive gel was also applied to the electrodes, effectively reducing exposure to air and, consequently, the rate of gel drying. The stability improvements of the enhanced EAG sensor are depicted in Fig. 2d.
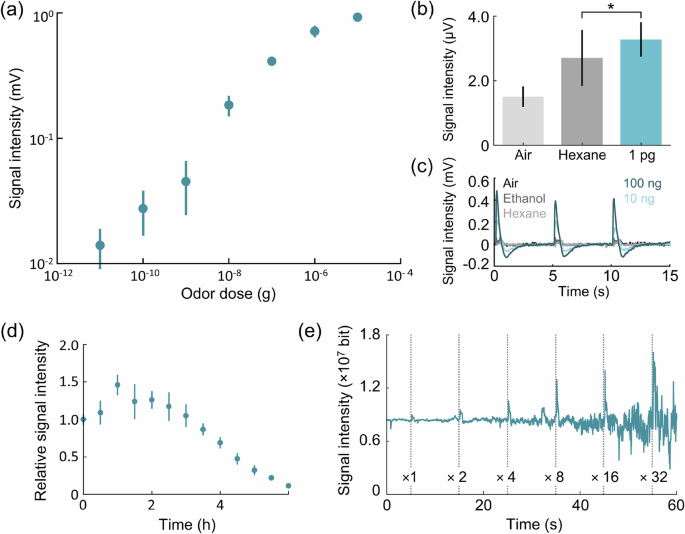
a Dose-response behavior of the enhanced EAG sensor to varying concentrations of bombykol, ranging from 10 pg to 10 µg. b Mean signal response of the enhanced EAG sensor at a low bombykol concentration (1 pg) compared to control stimuli. c Selectivity of the enhanced EAG sensor for specific odorants. Odor stimulations were conducted at 0, 5, and 10 s, respectively. d Stability of the enhanced EAG sensor over time. e Signal intensity adjustments with incremental PGA gain increases, where the gray dotted lines indicate moments of odor stimulation.
Enhanced bio-hybrid drone
Figure 1c displays both a 3D model and a 2D transparent view of the redesigned sensor enclosure. The sensor assembly is mounted on a carbon pedestal, with the enclosure engineered for easy attachment by sliding onto the pedestal’s underside. This arrangement allows for the effortless replacement of antennae and removal of the enclosure. The distance between the silkworm moth antenna and the drone’s center was maintained at 100 mm. Unlike previous designs that utilized a straight carbon tube (length: 40 mm, inner diameter: 20 mm) for the enclosure28, the current study adopted a funnel-shaped enclosure with an open end fabricated using 3D printing in PLA resin. This new enclosure design not only eases the attachment to the pedestal but also reduces airflow resistance at the enclosure’s tip. To avert undesirable electrostatic charging and mitigate noise interference with the EAG sensor, a conductive coating (PTP-G1501-15mL; Polycalm, Plascoat Co., Ltd., Kyoto, Japan) was applied inside the enclosure.
Figure 1d depicts the enhanced bio-hybrid drone from multiple perspectives (bird’s eye, side, front, and top views), offering a comprehensive view of the drone’s structure, while Fig. 1e depicts the system’s architecture. The flight platform for the odor-source localization task was a Tello EDU drone (dimensions: 98 × 93 × 41 mm; Shenzhen Ryze Tech. Co., Ltd., China), consistent with the platforms used in prior research. Experimental results affirm the drone’s payload capacity at approximately 40 g, establishing it as a suitable carrier for the newly developed EAG sensor system. The integrated system encompasses the drone, a mountable EAG sensor featuring a microcontroller board, and a computer, maintaining connectivity through a Wi-Fi network. The ESP32 microcontroller within the EAG sensor transmits measurement data to the computer, which then processes inputs from both the EAG sensor and the drone. This processing includes using flight status data to manage drone operations according to the flight algorithm. Notably, the drone’s yaw angles were crucial for algorithm performance, with these angles measured by an inertial measurement unit (IMU) attached to the drone.
Evaluation of enhanced EAG sensor on the ground
Figure 2a illustrates the dose-responsive characteristics of the enhanced EAG sensor, displaying an increase in signal intensity across a range of bombykol concentrations from 10 pg to 10 μg (n = 5, mean ± standard deviation (SD)). This response indicates the sensor’s ability to detect bombykol at various concentrations in the air. In Fig. 2b, the enhanced EAG sensor’s mean responses to a low bombykol concentration (1 pg) are contrasted with responses to control stimuli (air and hexane). A marked difference in the response to hexane compared to a 1 pg bombykol concentration was noted (n = 15, alpha level of 0.05, two-tailed Welch’s t-test: *, p = 0.047), underscoring the sensor’s high sensitivity to detect minute concentrations of odors in the environment. Considering that chemical concentrations within an odor plume decrease as the distance from the source increases31, it is inferred that low-concentration odor distributions are prevalent farther from the source. This enhancement allows the EAG sensor to discern concentration differences in environments with low odor levels, suggesting its effectiveness in initiating the localization of odor sources across extended distances.
Figure 2c depicts the selectivity and consistency of the enhanced EAG sensor’s responses to bombykol, compared against three iterations of stimulations each (with 5-s intervals) involving air (2 L min−1), ethanol (commonly used as an odorant in experiments with commercial gas sensors), hexane (the organic solvent for bombykol), and bombykol at concentrations of 10 and 100 ng. The sensor demonstrated no response to control stimulations but exhibited selective and consistent reactions to bombykol, affirming its suitability as an odor sensor for drone-based applications. Its high selectivity ensures effective odor-source localization, even in the presence of background odors, highlighting the sensor’s adaptability across varied operational scenarios.
In Fig. 2d, the stability of the enhanced EAG sensor is evidenced through the relative EAG signal values over time, starting immediately after antennae isolation from the silkworm moths (n = 5, mean ± SD). The raw EAG signals were normalized to relative values, with the baseline measurement at time t = 0 set to 1.0. Following 100 ng bombykol stimulation, the sensor’s response remained consistent or improved for up to 3 h after antenna placement, subsequently showing a gradual decrease, with signal intensity halving after 4.5 h. This signifies a notable enhancement in durability compared to previous studies using A. ipsilon antennae32, where signal responses diminished by half after merely 1.5 h. The electrode’s grooved design, which holds a substantial amount of conductive gel and adequately covers the antennae’s cut surfaces, plays a crucial role in preventing drying and sustaining signal stability. Given the average battery lifespan of small drones (approximately 10 min), the durability of the enhanced EAG sensor exceeds the requirements for practical odor-source localization endeavors.
Figure 2e presents a typical EAG signal response to 5 pg of bombykol, highlighting automated gain adjustments ranging from 1- to 32-fold. With the inclusion of a PGA, the enhanced EAG sensor allows for gain modifications (1-, 2-, 4-, 8-, 16-, 32-, 64-, and 128-fold) alongside an analog gain of ×1000. As illustrated by the data in Fig. 2a, unlike complete mechanical components, biological parts exhibit a non-negligible degree of variability in the signals they generate. Additionally, individual differences are observed across each antenna. The enhanced EAG sensor incorporates a PGA that adjusts the gain based on the input signal from the antennae. This adjustment enhances signal processing and operability, minimizing the impact of individual variances in biological components.
Measurement of flow around the drone
Figure 3a presents the airflow dynamics surrounding the drone’s airframe and propellers, as captured in a 2D plane situated 30 mm above the drone using a hot-wire anemometer. The location under examination for the EAG sensor is denoted by a green square. The flow velocity magnitude is depicted through both the size of black arrows and the intensity of black color within the 2D plane; areas with a darker hue indicate higher flow velocities in the z-axis direction. It was observed that the flow velocity around the drone’s airframe and propellers (highlighted by dotted circles) was significantly higher (~5.8 m s−1) compared to the velocity at the sensor’s position (~3.1 m s−1). The propellers’ downwash effect produced specific velocities in and around the propeller area (~3.2 m s−1), with a noticeable decrease in velocity near the sensor location (~1.8 m s−1). These observations suggest that positioning the sensor close to the propellers might inadvertently draw airflow from above the drone, thereby compromising the accuracy of directional odor detection. However, the sensor-placement strategy adopted in this research mitigated the effects of propeller downwash, effectively channeling the odor toward the sensor. This strategic placement led to a significant reduction in flow velocity in the z-axis direction by approximately 50%, facilitating easier acquisition of directional cues and significantly enhancing the efficacy of odor-source localization. The findings of this study on sensor-placement optimization underscore the importance of understanding and using airflow dynamics around aerial robots for applications involving odor-source detection.
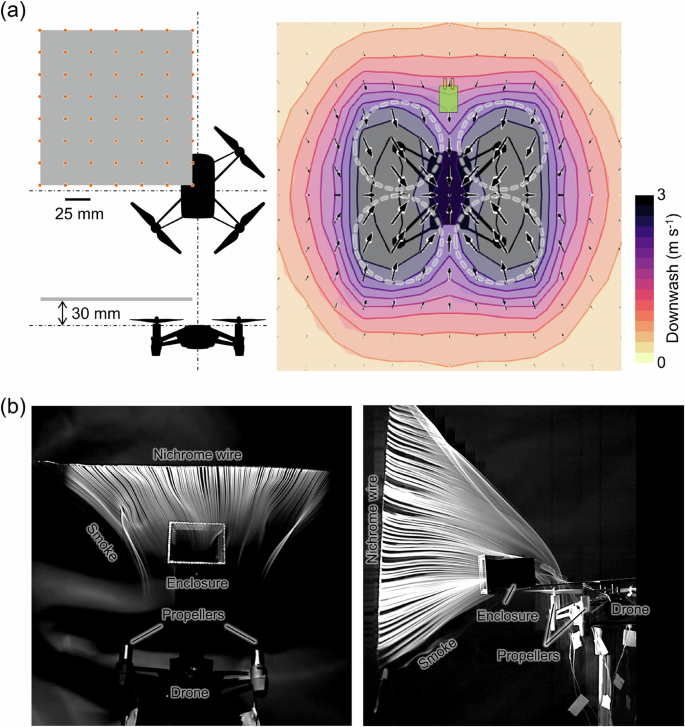
a Measurement locations and a 2D velocity contour map depicting airflow patterns near the drone and sensor, enhancing the understanding of sensor-placement efficacy. b Smoke flow techniques for visualizing airflow streamlines around the chamfered sensor enclosure, highlighting the impact of drone structure on airflow dynamics.
Figure 3b depicts the airflow dynamics within and surrounding the chamfered enclosure, analyzed using the smoke wire technique with olive oil. Analyses were when the nichrome wire was positioned parallel (left-hand image) and perpendicular (right-hand image) to the ground. In both images, the smoke was visualized flowing smoothly into the enclosure through its chamfered structure. The experimental videos using the smoke-wire method are shown in Supplementary Movies 1 and 2. When the wire was parallel to the ground, the smoke entered the enclosure from the front at an approximately 50° horizontal angle. When positioned vertically, it entered at a 30° vertical angle and was observed exiting from the back. The chamfering at the entrance of the enclosure is expected to reduce undesirable airflow losses and promote the laminar flow of odor molecules toward the antennae, thereby contributing to enhanced sensor-detection capabilities. This parallels the design principles observed in drones with ducted fans, where ducts are not merely cylindrical but are designed with apertures that systematically widen toward the exterior to minimize resistance and enhance airflow33.
Evaluation of enhanced EAG sensor on the drone
Figure 4a demonstrates a bio-hybrid drone in hover mode, stationed 10 m away from an odor source within a corridor measuring 20 m in length, 1.8 m in width, and 2.7 m in height. This setup mirrors the conditions utilized in a controlled desk setup, employing bombykol as the odorant at a concentration of 50,000 ng. The configuration of the circulator, glass cartridge containing the odorant, and the drone was arranged linearly, with the circulator and cartridge separated by 150 mm and the cartridge and drone by 10 m. Odor stimulation was conducted by activating a solenoid valve for a duration of 0.5 s with an airflow rate of 5 L min−1. The visual representation of the odor stimulation setup, marked by a red square in Fig. 4a, is further depicted in Supplementary Fig. 1.
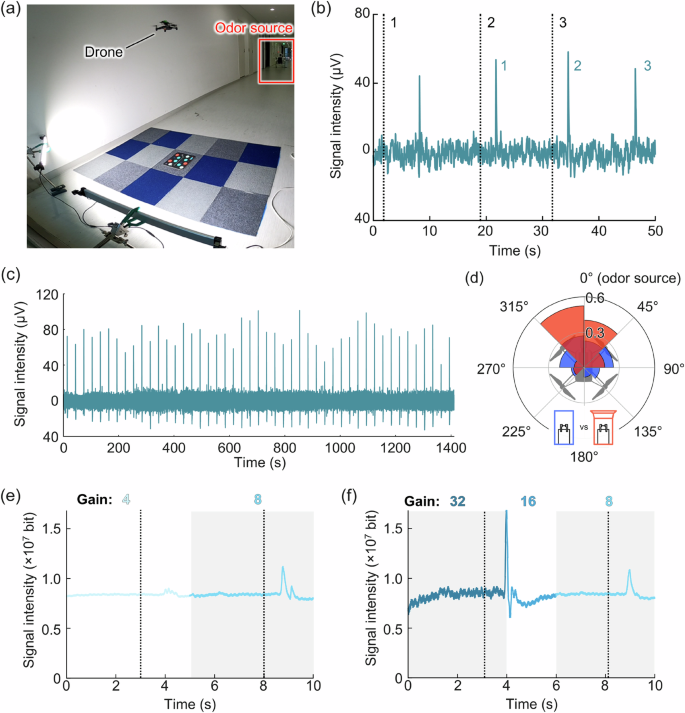
a Setup for detecting EAG signals on the drone in a corridor, with the odor source marked in red, situated 10-m away from the drone. b Response curve generated via odor detection using the setup described in (a), with black dotted lines indicating moments of odor stimulation. c EAG sensor’s stability while the drone is hovering. d Polar histogram of EAG signal distributions obtained by the drone with either the chamfered or non-chamfered sensor enclosure. Sequential charts showing automatic PGA gain adjustments in the enhanced EAG sensor for scenarios of e gain increase and f gain decrease, with black dotted lines indicating odor stimulations.
Figure 4b illustrates the characteristic responses of the enhanced EAG sensor to odor stimuli, as indicated by four distinct peaks when the sensor was situated 10 m away from the odor source. In the graph, each stimulus (depicted by black dotted lines) corresponds to a specific response. Due to a delay in odor detection following valve activation, the initial stimulation instance was not included in the analysis. The study applied PGA gains of 8 for the responses. An 8-point moving average was utilized for data smoothing, omitting the most extreme values from each set of ten data points. Although a 10-point moving average was sufficient for the EAG signals28, this study further improves processing efficiency by removing extreme values. Despite the considerable distance, the sensor consistently detected odor stimuli within an average time of 16.8 s ± 2.3 s (n = 3, mean ± SD) following stimulation, demonstrating its potential to initiate odor localization from a distance of at least 10 m. While attempts to detect odors beyond 10 m were not successful, factors such as the drone’s proximity to walls and the low wind velocity around the drone, exacerbated by the propellers’ downwash effect, likely affected odor detection capabilities. Wind speed measurements at each location are presented in Supplementary Fig. 2. Prior research has indicated the possibility of detecting odors from distances up to approximately 15 m in open environments34, pointing to potential avenues for future investigations.
Figure 4c evaluates the stability of the enhanced EAG sensor mounted on a hovering drone. Given that battery limitations restrict flight durations to approximately 5 min, a custom-wired power supply system was devised to enable extended operational periods, as depicted in Supplementary Fig. 3. This system supplies power to the EAG sensor from the ground, reducing the drone’s payload. Under experimental conditions involving 50,000 ng bombykol, a flow rate of 5 L min−1, and 0.5-s odor stimulations at 30-s intervals, the sensor maintained its effectiveness for 20 min at a distance of 0.9 m from the odor source, corresponding to the drone’s flight altitude. Although signal intensities exhibited variations, they did not decrease over time, suggesting that the observed fluctuations stemmed from changes in odor concentration rather than sensor degradation. This consistent performance highlights the drone’s potential for sustained odor localization tasks without necessitating recalibration. This capability is crucial for drone systems, as it would be impractical for a drone to repeatedly return to a control center during missions, such as when searching for survivors in collapsed buildings following disasters.
Figure 4d presents the results of a comparative analysis using a polar histogram, which shows the distribution of EAG signal values obtained by the drone using either the chamfered (red) or non-chamfered (blue) sensor enclosure. In this analysis, the orientation directly facing the odor source was defined as 0°. The odor stimulus was administered using 50,000 ng of bombykol at a flow rate of 5 L min−1 with 0.5-s odor stimulations at 2.5-s intervals, and the distance between the drone and the odor source was set at 1.8 m. The drone detected EAG signals while completing one 360° rotation over approximately 30 s. The drone equipped with a non-chamfered enclosure showed responses concentrated within ±90° relative to the odor source, indicating a certain degree of anisotropic response detection. Furthermore, the chamfered enclosure (as shown in Fig. 1c) concentrated responses within a ± 45° range, demonstrating the capability for strongly anisotropic response detection toward the odor source direction. These results suggest that installing enclosures around sensors is effective in enhancing anisotropy in odor detection and that further optimizing the shape can increase this effect.
Figure 4e, f details the temporal adjustments in PGA gain for the enhanced EAG sensor mounted on the drone, represented by variations in color intensity. The odor stimulus concentration and drone flight conditions were the same as those described in Fig. 4c. A darker blue line indicates a higher gain, whereas a lighter shade signifies a decrease. The PGA gain of the sensor was dynamically adjusted in response to signals that exceeded the set baseline. In this study, the gain operation was configured such that the gain doubles when the input signal to the ADC remains below 10% of the range above the baseline. Conversely, if the signal exceeds 80% of this range, the gain is reduced by half. The EAG signals used to modulate the gain were differentiated between odor responses and noise using a simple frequency analysis. Details of the frequency analysis are shown in Supplementary Fig. 4. Within the time frame shown in Fig. 4e, an adjustment in PGA gain from 4 to 8 is observed. Subsequently, Fig. 4f demonstrates a reduction in PGA gain from 32 to 16 and a further reduction to 8. Supplementary Movies 3 and 4 show the dynamic variations in PGA gain for the EAG sensor, illustrating its automated increase and decrease. In cases of signal saturation, the protocol calls for a one-step reduction in gain. These findings affirm that the enhanced EAG sensor adeptly modulates its gain based on the environmental odor concentrations, not only averting signal saturation but also optimizing the signal processing sequence.
Stepped rotation algorithm
In this study, we propose a novel algorithm—the stepped rotation algorithm—that more precisely mirrors the search behavior of arthropods in locating odor sources by strategically incorporating pauses into the search patterns of the drone. Figure 5a presents conceptual diagrams that delineate the distinctions between the traditional continuous rotation algorithm (displayed in the upper row) and the newly developed stepped rotation algorithm (depicted in the lower row), assuming that odor plumes emanate and disperse from the left.
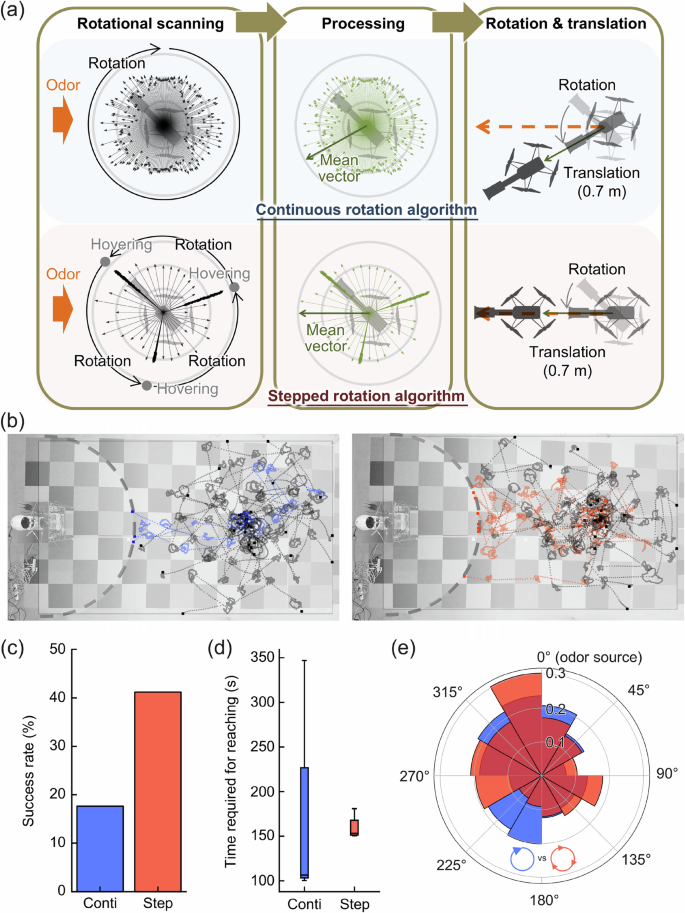
a Diagrams comparing the continuous rotation algorithm to the novel stepped rotation algorithm, illustrating the operational differences. b Localization trajectories using the continuous-motion spiral-surge algorithm (left) and the three-stepped rotation algorithm (right) from a distance of 3 m. Analysis of c success rates and d time required to pinpoint the odor source, comparing both algorithms over 17 trials, with box plots showing the data spread and median value. e Polar histogram of drone-estimated odor source directions, demonstrating the precision of directional estimation.
The term ({{boldsymbol{u}}}_{k},left(k=1,,2,,3,,ldots ,{m}right)), where m indicates the number of data points, is introduced to describe the “instantaneous EAG-weighted vector,” which is a composite of the response value of the EAG sensor (voltage greater than 0 V) and the yaw angle of the drone at the instant of signal detection. This concept can be visualized as numerous gray arrows during the drone’s rotational scanning phase in Fig. 5a. Concurrently, the “EAG-weighted mean vector” (({{boldsymbol{v}}}_{i})) which represents the average direction of all ({{boldsymbol{u}}}_{k}) vectors, is computed during a single directional determination phase, incorporating a complete 360° yaw rotation of the drone as depicted by green arrows in the processing phase of Fig. 5a. The angle of ({{boldsymbol{v}}}_{i}), denoted as θi, is then set as the drone’s forward direction or the EAG-weighted mean direction. Following this determination, the drone aligns itself to the estimated direction and proceeds forward, as illustrated in the rotation and translation phases of Fig. 5a. A distinguishing feature of the stepped rotation algorithm is the drone alternates between stationary and rotating movements for set duration. This method is designed to counter the erratic sensor readings induced by the complex dispersion patterns of odor molecules, thus significantly enhancing the precision in estimating the direction of the odor source. The algorithm’s iterative performance of these actions involves the actual localization behavior of the drone, marking a notable advancement in the accuracy of odor-source localization techniques.
Figure 5b presents the comparison of trajectories employed for odor-source localization from a distance of 3 m, contrasting the continuous-motion spiral-surge algorithm (on the left)28 with the novel three-stepped rotation algorithm (on the right). In this experiment, the three-stepped rotation algorithm executed a complete 360° yaw rotation with three intermissions, each lasting 4 s. The criterion for successful odor-source localization was defined as the drone’s arrival within a dotted circle with a radius of 1.3 m, as illustrated in Fig. 5b. This specification was made with the drone’s battery life in mind, acknowledging that the previous study28 reported successful search distances ranging from 1.8 m to as close as 0.45 m. Trajectories resulting in successful localizations are depicted in blue/red, while unsuccessful attempts are shown in gray. The distance advanced following each determination of the odor source direction was standardized at 0.7 m for both algorithms.
For the odor stimulation process, a parallel odor stimulator was employed, equipped with two controllers and two glass cartridges linked to an apparatus (Supplementary Fig. 1). The stimulation setup involved 50,000 ng of bombykol and a flow rate of 5 L min−1 for each cartridge, with the solenoid valves engineered to open and close alternately every 0.5 s within a 1.5-s interval for each cartridge. Among the 17 trials conducted, the three-stepped rotation algorithm demonstrated enhanced efficacy in localizing the odor source, achieving success in seven instances, compared to the three successes recorded using the previous method. This comparative analysis underscores the three-stepped rotation algorithm’s superior performance in efficiently localizing odor sources, attributed to its strategic implementation of pauses during rotation. This innovative approach facilitates more accurate detection and analysis of the direction of the odor plume, significantly improving upon the success rates of earlier algorithms and offering promising implications for applications in drone-based odor localization tasks.
Figure 5c–e offers an in-depth comparison of the continuous-motion spiral-surge algorithm and the newly developed three-stepped rotation algorithm in terms of their effectiveness in drone-based odor-source localization. Figure 5c reveals the success rates for both algorithms over 17 trials, with the continuous-motion spiral-surge algorithm achieving a success rate of 18%, while the novel three-stepped rotation algorithm significantly improved the success rate to 41%. This considerable enhancement indicates that the newly developed algorithm notably increased the drone’s efficiency in localizing odor sources, more than doubling its success rate. The box plots in Fig. 5d highlight the time required to locate the odor source, showcasing approximately 150 s for the three-stepped rotation algorithm, in contrast to the variable times observed with the spiral-surge approach. Additionally, metrics such as the number of forward movements required for successful odor-source detection exhibited greater consistency with the three-stepped rotation algorithm, further illustrated in Supplementary Fig. 5. Despite the variation in the number of successful localizations, these results emphasize the advanced algorithm’s superior performance in accurately tracking odor plumes and conducting more precise searches. Figure 5e presents a polar histogram that illustrates the angles estimated by the drone to be indicative of the odor source direction. Utilizing the three-stepped rotation algorithm significantly increased the drone’s alignment with the actual direction of the odor source (0°) following direction estimation. In contrast, the continuous-motion spiral-surge algorithm more frequently misidentified the direction, often suggesting a location approximately 180° opposite the actual source of the odor. This section underlines the benefits of incorporating stationary phases into the stepped rotation algorithm to enhance the efficiency of odor-source localization. The added stationary phases improve the drone’s ability to accurately estimate the direction of the odor source by allowing for more precise sensor readings, as opposed to continuous motion which may lead to erratic readings because of the complex dispersion patterns of odor molecules.
An in-depth analysis was conducted to assess the impact of the number of steps in the stepped rotation algorithm on both the precision of the odor source direction estimation and the search velocity. This was achieved by examining the mean resultant length, a statistical measure representing the concentration of sample directions (with computational details provided in the “Methods” section). Two specific scenarios were evaluated: the first (scenario 1) involving the EAG-weighted mean vector generated from a combination of stationary and rotational phases, and the second (scenario 2) relying solely on the EAG-weighted mean vector derived from the stationary phase during stepped rotation. For comparative analysis, the 360° yaw rotation of the drone was divided into either five or three equal steps, executed from a fixed 4 m distance from the odor source, replicating the stepped rotation under identical conditions to those presented in Fig. 5b.
The outcomes indicated mean resultant lengths of 0.33 and 0.30 for the five and three-stepped rotations in scenario 1, respectively, showcasing that the five-stepped rotation algorithm yielded the most consistent direction estimation, closely followed by the three-stepped rotation. In scenario 2, the mean resultant lengths were 0.25 and 0.17 for the five and three-stepped rotations, respectively. Regarding time efficiency, the five-stepped rotation took approximately 25 s, the three-stepped rotation 15 s, and the continuous rotation 27 s, making the three-stepped rotation the fastest method. Although the five-stepped rotation algorithm demonstrated a slightly higher likelihood of accurately determining the odor source direction, its additional 10-s duration over the three-stepped rotation highlights the latter’s advantage for extensive odor source localization tasks in small drones. This balance between estimation accuracy and search duration renders the three-stepped rotation particularly suited for applications requiring quick and reasonably precise localization, demonstrating the efficacy of integrating stationary phases in the algorithm’s design.
Odor-source localization using the enhanced bio-hybrid drone
Figure 6a illustrates the successful trajectories of the odor-source localization by the enhanced bio-hybrid drone utilizing a three-stepped rotation algorithm. Although the enhanced EAG sensor has been demonstrated to detect odors from as far as 10 m, as evidenced in Fig. 4b, the localization experiments were conducted at a closer range of approximately 5 m because of the spatial limitations of the available experimental setup. The odor stimulation setup and conditions remained consistent with those described in Fig. 5b. Equipped with a custom-designed wired power supply system, the drone initiated its search from a position 5 m away from the glass cartridge containing the odorant. Upon odor detection, the drone engaged the three-stepped rotation algorithm to determine the odor source direction and subsequently moved 0.7 m toward it. The drone accurately located the odor source within the flight area without significant deviation after 8 to 10 iterations of direction determination and progression, demonstrating its precise direction detection and approach mechanism. Finally, the drone reached a point approximately 0.45 m away from the odor stimulator. The drone’s flight, as depicted in Fig. 6a by the dark yellow line, is further illustrated in Supplementary Movie 5. Thirteen experiments were conducted on odor-source localization at a distance of 5 m. As shown in Fig. 6a, the drone approached within approximately 0.45 m of the odor source in two trials. Additionally, there were two trials in which the drone came within approximately 1 m of the odor source. Despite the search distance being approximately doubled compared to the experiments in Fig. 5b, this study demonstrated that the drone could autonomously correct its course while approaching the odor source.
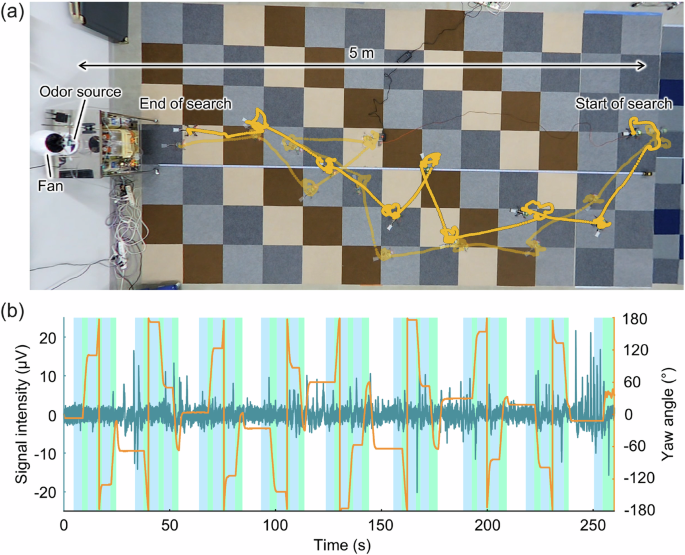
a Typical trajectories of the drone toward the odor source using the three-stepped rotation algorithm, supported by a custom-wired power supply. b Real-time analysis of yaw angles and EAG sensor signal intensities during the localization process as illustrated by the dark yellow line in (a), including visual representations of the step (blue bars) and rotation (green bars) phases.
Figure 6b illustrates the real-time data captured from the EAG sensor on the drone (blue line) alongside the yaw angles (orange line), demonstrating the capability of the sensor to continuously detect environmental odors in synchronization with the flight trajectory, as represented by the dark yellow line in Fig. 6a. With each rotation, the drone adjusted its search direction by rotating 120° in the yaw direction. The variation in EAG signal peaks, which increased as the drone approached the odor source, underscores the sensor’s ability to assess changes in odor concentration accurately. This study marks a significant departure from previous research, which typically limited search distances to 2 m or less27,28. Through enhancements in sensor design, electrode modifications, and algorithmic improvements, the research successfully extended the odor-source localization range of the bio-hybrid drone to over double the previously achievable distance, setting a new benchmark for the capability of bio-hybrid drones in odor-source localization tasks.
Discussion
A significant contribution of this study is the development of a stepped rotation algorithm that incorporates strategic stationary periods and an optimally designed sensor enclosure. This innovation substantially enhances the precision of odor source direction estimation and extends the effective search distance (up to 5 m) of the bio-hybrid drone.
Research on arthropods—including moths, flies, mosquitoes, and crabs—highlights an odor-source-seeking behavior characterized by surging (straight-line movement), searching (casting or rotating), and stopping (pausing)30. In these organisms, pauses often occur when odor contacts are sparse, facilitating active searching and the monitoring of temporal changes35,36. This aspect of navigation, though frequently overlooked, is critical for the success or failure of odor detection tasks. Similar observations have been noted in studies involving mice37, suggesting that pauses can enhance the effectiveness of odor-source searches. The empirical validation achieved using a bio-hybrid drone in this study conclusively demonstrated that pausing improves the success rate of odor searches. During rotational movements, the centrifugal force emanating from the drone’s center of rotation tends to push airflow away from the antennae, potentially weakening odor attraction. Introducing deliberate pauses could reduce the influence of centrifugal force, allowing for more effective airflow toward the antennae and thereby facilitating more precise odor detection than continuous rotation would allow. Additionally, these pauses help to mitigate the signal noise caused by instantaneous odor filament encounters. The confirmation of the stopping behavior’s effectiveness in drone-based odor-source searches offers a novel perspective for the future development of both robotic odor-detection systems and their underlying algorithms.
In this study, we demonstrated that a small drone (outer diameter of approximately 0.1 m) can locate an odor source from a distance of 5 m. Building upon our previous research28, this achievement resulted from various improvements including the EAG sensor and new search algorithm. In instances where the drone failed to reach the odor source, it often deviated from the correct path directly from the starting point, suggesting that the challenges of odor detection and direction determination are significant when the drone is far from the source. Although the drone did not manage to approach closer than 0.45 m of the source, in cases where it approached at approximately 1 m, a subsequent lateral deviation was observed. In the limited flight space of our study (3.2 m in width), recovering to the correct direction was challenging. However, in wider spaces, it is conceivable that correcting the direction could lead to successfully reaching the odor source. In the future, it will be necessary to further determine the impact of increased distances on odor-source localization by investigating the distribution of odors within the search space. The drone and EAG sensor developed in this study may be used for such research.
In nature, insects utilize wing flapping not only for propulsion but also as a mechanism to funnel distant and forward-situated pheromones toward their antennae38,39,40,41. Previously, the authors performed computational fluid dynamics (CFD) analysis of the wing-fanning silkworm moth to investigate the aerodynamics of this system42. It was found that silkworm moths draw airflow to their antennae through wing fanning, thereby guiding particles (pheromone molecules) coming from the forward direction horizontally by approximately 60°. Therefore, the anisotropic odor detection mechanism of insects is key to their remarkable ability to localize odor sources with high precision. In contrast, multicopter-type drones inherently produce symmetrical flow fields. This research demonstrates that for flying robots of this type to accurately identify odor sources, they must be equipped not only with the stepped rotation algorithm but also with a specially designed enclosure that amplifies the anisotropy of the odor sensor. The chamfered enclosure developed in this study serves to replicate a part of the insect wing-fanning effect. It was shown to prevent unnecessary airflow disturbances and further enhance the anisotropy of signal detection toward the direction of the odor source. By referencing the odor sampling strategies of insects and further exploring the appropriate shape and placement of enclosures on multicopter drones, we can advance the development of odor-detecting flying robots capable of more precise and efficient odor detection.
Beyond developing an optimal sensor enclosure, the appropriate positioning of the EAG sensor is crucial for efficient odor detection. Previous approaches have involved directly mounting commercial gas sensors or insect antennae on the drone’s airframe14,27; however, the hydrodynamic rationale behind these placements has not been thoroughly explored. In this study, we confirmed that directing airflow within a narrow range (approximately 50°) toward the sensor while avoiding interference from propeller downwash, constitutes an effective positioning strategy. Further research is needed to refine sensor placement for improved odor detection.
The EAG sensor in this study has undergone significant enhancements in both electrode design and circuit configuration. The integration of a PGA enables users to select an optimal gain for input signals with varying strengths, thereby boosting sensor operation and signal processing efficiency. Notably, we conducted an experiment in which the PGA gain was automatically adjusted to appropriate levels based on the ambient odor concentration and verified the effectiveness of this technique. Additionally, the grooved electrode structure minimizes the impact of variations in antennae length. Consequently, this system has an advanced capability to manage both mechanical and electrical variations in the antennae. Odor plumes in the open environment are transformed into delicate filaments through the effects of wind velocity and turbulence, resulting in a complex distribution pattern31,43. Therefore, the gain-modulable EAG sensor is anticipated to substantially improve tracking performance in response to changes in odor concentration during the source localization process, even under these complex conditions.
The bio-hybrid drone concept exemplifies a novel approach to integrating biological intricacy with technological innovation. Transitioning from controlled experimental setups to real-world applications presents a myriad of technical challenges that must be addressed. Specifically, the electrodes in EAG sensors, which are commonly made from metallic materials in mobile robotics applications27,28, must be reevaluated in the context of biological signal detection. Recent advancements have highlighted hydrogels, particularly those made from polyvinyl alcohol (PVA) containing over 70% water, as potential electrode materials owing to their softness, compatibility with living tissues, and their ability to mold to surface irregularities44,45,46,47,48. These hydrogels not only promise to extend the functional lifespan of antennae by providing continuous moisture and nutrients but also to stabilize the sensor responses. Incorporating PVA hydrogels into EAG electrodes will provide a novel electrode structure that offers several benefits for bio-hybrid applications. This includes maintaining antenna hydration, potentially extending antenna longevity, and improving the consistency of odor detection responses. Additionally, the flexible nature of hydrogel materials accommodates antennae of various sizes and shapes, broadening the applicability of EAG sensors across different insect species.
This study employed a single antenna from a silkworm moth as the primary sensing element. However, the literature indicates that insects often rely on the differential temporal reception of odor signals between their paired antennae to navigate49. The exploration of stereo sensing by utilizing dual antennae could significantly augment the directivity of the system and inform the creation of more sophisticated odor-seeking algorithms. The implementation of a stereo-sensing approach requires the comprehensive development of multiple elements, including EAG sensors, sensor placement, processing boards, and control programs. Our research group is in the process of developing an EAG sensor array aimed at enhancing the system’s sensing capabilities.
In the current setup, only the EAG sensor, serving as the odor detector, was attached to the drone for localizing odor sources. Integrating additional environmental data, such as wind speed and direction, with odor sensor readings could considerably improve the determination of odor source direction50. Considering the limited carrying capacity of the drones, the use of a compact and lightweight wind speed sensor51 emerges as a viable option to improve the efficiency of odor-source localization. This integration could considerably shorten the time needed to accurately pinpoint odor sources, blending the sensitivity of biological sensing elements with the agility and precision of modern drone technology. This study’s advancements set the stage for further exploration into combining biological components with robotic systems, aiming to enhance their utility in practical applications through improved sensing and navigation capabilities.
Methods
Insects and odorants
In the experiments conducted for this study, antennae harvested from adult male silkworm moths of the hybrid strain B. mori (Kinshu × Showa; Ueda-sansyu, Nagano, Japan) were utilized within the EAG sensor setup. The male silkworm moths of this strain demonstrate an exceptional ability to detect and distinguish bombykol52, the primary sex pheromone component identified in B. mori, known chemically as (E,Z)-10,12-hexadecadien-1-ol. Notably, the mating behaviors of these moths are uniquely activated by bombykol, underscoring the specificity and sensitivity of their olfactory system to this compound53.
EAG recordings
The odor stimulation apparatus, depicted in Supplementary Fig. 6, was specifically designed to present bombykol to the silkworm moth antennae. Bombykol, dissolved in hexane (Infinity Pure; 085-00416; FUJIFILM Wako Pure Chemical Corporation, Ltd., Osaka, Japan), was applied to a section of filter paper and placed within a glass tube (inner diameter: 5 mm; outer diameter: 7 mm; length: 100 mm). To ensure the delivery of purified air to the glass tube, the airflow generated by a compact air pump (NUP-1; AS ONE Corporation, Osaka, Japan) was passed through layers of cotton, activated charcoal (7440-44-0; FUJIFILM Wako Pure Chemical Corporation, Ltd.), and distilled water. The concentration of the odorant was determined based on the mass of bombykol present in the solution applied to the filter paper within the tube. The precise control over the duration and initiation of odor exposure was achieved through the integration of a solenoid valve (YDV-3-1/8; Takasago Electric, Inc., Nagoya, Japan) with microcontrollers (M5StickC; M5Stack, Shenzhen, China).
To ensure consistent airflow and prevent the accumulation of pheromones, the enhanced EAG sensor was mounted at a stationary position on the ground, with a 60 mm diameter exhaust port located directly behind the sensor setup. The odor emission point, marked by the proximal end of the glass tube, was positioned 50 mm from the antennae mounted on the EAG sensor, with an identical distance maintained between the antennae and the exhaust port. The system was configured to sustain an airflow rate of 5 L min−1, facilitating the effective delivery of bombykol to the antennae for detection and analysis. This setup highlights the study’s comprehensive approach to replicating the natural olfactory detection mechanisms of silkworm moths in a controlled laboratory environment.
Flight area for drone
The flight zone designated for conducting odor-source localization experiments with the drone was specifically arranged to cover an area measuring 6.8 m in length, 3.2 m in width, and 2.7 m in height. To enhance flight stabilization and facilitate the effective use of the drone’s vision positioning system (VPS) to maintain its current flight position based on the ultrasound and image data, the floor within this zone was covered with carpets measuring 0.45 by 0.45 m, each featuring a different color. This strategic setup was aimed at providing the drone with visual markers to maintain stability and orientation during flight. A commercial USB camera (UCAM-CX80FBBK; Elecom Co., Ltd., Osaka, Japan) was strategically positioned to capture and record the drone’s navigational paths, enabling a detailed analysis of its movement patterns and efficiency in localizing the odor source. This visual documentation serves as a critical tool for evaluating the performance and precision of the drone’s flight paths in real-time and post-experiment analyses. To further understand the dynamics of airflow within the designated flight space, visualizations from top and side perspectives were conducted using a smoke machine (Z800II, KENIS Ltd., Osaka, Japan). These visualizations, presented in Supplementary Fig. 7, provided valuable insights into how smoke—or by extension, odor plumes—dispersed throughout the flight zone. The smoke dispersion patterns indicated a broad expansion both vertically and horizontally as the distance from the circulator increased, effectively preventing the concentration of smoke in any particular section of the area. This observation is crucial for ensuring that the drone encounters a dynamic and changing odor environment.
Fluid dynamics analysis
To quantitatively assess the airflow dynamics around the drone’s airframe and propellers, velocity distributions were measured using a hot-wire anemometer (MODEL 0102; Kanomax Japan Inc., Osaka, Japan). The drone was mounted at the tip of a 1-m steel rod via a 3D-printed mount, while the other end of the rod was secured to an optical surface plate (J09N-0506; Suruga Seiki Co., Ltd., Shizuoka, Japan) using a six-axis force sensor (PFS030YA151U6; Leptrino Co., Ltd., Nagano, Japan). This setup facilitated the precise positioning of the drone for airflow measurements. A calibrated hot-wire anemometer probe (0249R-T5; Kanomax Japan Inc.) was positioned at a fixed spot using a 3D-printed clamp attached to another rod linked to the optical plate. Measurements were taken in a 2D plane, located 30 mm above the drone’s airframe, which corresponds to the typical placement of the EAG sensor. The experiment hypothesized that the airflow velocity surrounding the drone would exhibit symmetry, with clear boundary surfaces identifying the frontal-rear and lateral directions relative to the drone’s orientation.
To measure lateral and vertical flow velocities, assessments were made at the front left side of the drone, while forward and backward flow velocities were measured at the front right side, covering an area of 150 mm with a 25 mm interval between each measurement point. During these evaluations, each drone motor was supplied power externally to simulate the operational conditions of the drone, including the scenario when it is equipped with an EAG sensor. The force generated by the drone was measured using load cells, with the external power supply adjusted to replicate the voltage levels typical of the bio-hybrid drone’s hovering state. Flow velocities were recorded over a duration of 10 s, starting at least 10 s after the drone’s motors were activated.
To elucidate the airflow dynamics surrounding the EAG sensor and its enclosure during hover, the smoke wire technique was implemented, reflecting the procedure utilized for hot-wire anemometer evaluations. The drone was secured in position while its motors were engaged. A nichrome wire, measuring 0.26 mm in diameter, was situated in front of the sensor enclosure and connected to a stabilized power source. To improve the adhesion of olive oil to the nichrome wire, it was manipulated to form multiple protrusions. Olive oil was subsequently administered to the wire, and upon activation by the stabilized power source, the oil was vaporized. This setup ensured the wire was positioned at the same height as the EAG sensor, with experiments performed with the wire arranged either parallel or perpendicular to the ground and the sensor enclosure’s inlet.
Measures of concentration in the estimated odor source direction
To examine the variability in the estimated direction of the odor source, the mean resultant length was calculated as a measure of sample concentration within the framework of circular data analysis54,55. Utilizing the stepped rotation algorithm, the drone acquires an “instantaneous EAG-weighted vector,” ({{boldsymbol{u}}}_{k},(k=1,,2,,3,,ldots ,{m})), where m indicates the number of data points, consisting of the EAG sensor signal values and the corresponding yaw angles at the moment these signals are detected. Subsequently, the “EAG-weighted mean vector” (({{boldsymbol{v}}}_{i})) is derived, representing the unit vector aligned with the direction of the resultant vector composed of all ({{boldsymbol{u}}}_{k}) vectors during a single drone rotation. Assuming the drone consistently estimates the odor source direction, yielding n EAG-weighted mean vectors, denoted as ({{boldsymbol{v}}}_{i},(i=1,,2,,3,,ldots ,{n})), with ({theta }_{i}) being the angle of ({{boldsymbol{v}}}_{i}) relative to a reference direction, R stands for the resultant vector of all ({{boldsymbol{v}}}_{i}), and the length of R, known as the resultant length (R), encapsulates
The mean resultant length (bar{R}), calculated by dividing R by the number of data n, is
As ({{boldsymbol{v}}}_{i}) is the unit vector,
For example, if ({theta }_{i}) are evenly distributed, R is a zero vector, and therefore (bar{R},)= 0. In contrast, if ({theta }_{i}) have the same value, (bar{R}) = 1. The closer (bar{R}) is to 1, the more aligned ({theta }_{i}) are, and at (bar{R},)= 1, all ({{boldsymbol{v}}}_{i}) face one direction. Therefore, (bar{R}) is a measure of concentration in the estimated direction. Supplementary Fig. 8 illustrates an image of the mean resultant length when the drone obtains three EAG-weighted mean vectors (({{boldsymbol{v}}}_{1}), ({{boldsymbol{v}}}_{2}), ({{boldsymbol{v}}}_{3})). The ({theta }_{i}) is defined as the angle relative to the initial position of the search for the odor source, wherein the direction pointing directly toward the odor source is designated as the zero direction.
Statistical analysis
Data are presented as mean ± SD of multiple individual tests (n > 3). Statistical analyses were performed using Microsoft 365 Excel and Python.


Responses