Age- and vaccination status-dependent isolation guidelines based on simulation of SARS-CoV-2 Delta cases in Singapore

Introduction
Since the second year of the COVID-19 pandemic, multiple effective pharmaceutical interventions (PIs), such as vaccines and antivirals, have been developed and distributed globally. These substantially contributed to reducing the rates of severe illness and death from COVID-19. Non-pharmaceutical interventions (NPIs), such as isolation, contact tracing, and social distancing, instead represented the first line of defense early in the pandemic. However, new variants have continuously emerged, and vaccine effectiveness against infection has shown a gradual reduction1,2,3. Thus, NPIs may still play a role in minimizing the COVID-19 burden should more severe variants emerge and will be key in epidemic/pandemic preparedness plans.
Isolation is an effective NPI but places considerable costs on both the isolated patient and society. To minimize this burden, isolation should ideally end as soon as a patient is no longer infectious. However, this time period is highly variable between patients and cannot be observed directly without viral tests. In practice, the length of isolation has been fixed (fixed-period guideline) or determined by viral tests (test-based guideline). In the early stages of the pandemic, most developed countries, including Singapore, adopted a test-based guideline, which recommended multiple and consecutive negative PCR test results to end isolation4,5. As clinical and epidemiological information accumulated and performing viral tests to end isolation became impractical given the surge in the number of cases, fixed-period guidelines were adopted.
There has been an extensive debate on how to design ideal isolation guidelines. In our previous studies, we considered two factors: the leaking risk and excess isolation burden6,7. The leaking risk is defined as the probability of ending isolation when an individual is still infectious, while the excess isolation burden is defined as the length of unnecessary isolation of an individual who is no longer infectious. These factors work in opposite directions, such that reducing one tends to increase the other (e.g., stricter isolation guidelines reduce leaking risk but increase excess isolation burden). Finding the optimal balance between these conflicting priorities while aiming to minimize both is key to designing the best isolation policies. We previously demonstrated that the test-based approach yields a smaller excess isolation burden while maintaining the risk at a low level compared with the fixed-period approach because the fixed-period guideline imposes redundant isolation for patients due to the variability in viral dynamics6. However, performing viral tests multiple times is challenging due to cost and logistical constraints, which are further influenced by the epidemiological situation (i.e., the number of cases and their contacts) and testing technology (e.g., PCR or antigen tests). Therefore, most countries have primarily relied on fixed-period guidelines, and turned to test-based guidelines only under specific circumstances4,5,8. For example, in the US, multiple testing is still recommended for moderately or severely immunocompromised patients as of 29 August 20244,8.
In this study, we propose a variable isolation period approach (variable-period approach) that considers different lengths of isolation for distinct population groups. The variable-period approach reduces the excess isolation burden compared to fixed-period guidelines by accounting for individual variability in viral dynamics. Our simulation model mimics the viral dynamics of SARS-CoV-2 infection and evaluates the effectiveness of both fixed-period and variable-period guidelines. Using data from the Delta variant collected in Singapore, we find that the variable-period approach offers a more balanced strategy by minimizing unnecessary isolation while maintaining safety. While the numerical results may vary by country, virus variant, and specific virus, the computational protocol for assessing and comparing isolation guidelines is broadly applicable and can be adapted to different scenarios.
Methods
Overview
First, we developed a simulation model to generate longitudinal viral load data. The simulation model is based on a viral dynamics model, which is a mathematical model that describes the time course change in viral load within an infected individual. The model was fitted to longitudinal viral load data from patients infected by the SARS-CoV-2 Delta variant in Singapore. In the model fitting process, we tested if age and vaccination status influenced viral dynamics. Second, we implemented different isolation guidelines on viral load data and simulated them by using the parameterized model. Synthetic longitudinal viral load data was generated using the model; the leaking risk and excess isolation burden of the fixed-period and variable-period guidelines were estimated from the generated data together with the expected number of secondary infections under isolation programs (i.e., effective reproduction number). Third, we compared those two guidelines considering a certain level of risk (e.g., leaking risk of 10% and effective reproduction number of 1) and explored which length of isolation yielded the smallest excess isolation burden.
COVID-19 clinical data and longitudinal viral load
Electronic medical records of adult patients aged ≥18 years admitted to the National Center for Infectious Diseases, Singapore, from 1 April to 14 June 2021 were reviewed9. In this study, we focused on symptomatic patients who were infected by the Delta variant and had three or more viral load measurements. The analyzed sample of patients includes a substantial proportion of both vaccinated and unvaccinated patients. SARS-CoV-2 viral load was measured from nasopharyngeal swabs collected as part of routine clinical care and tested using a variety of commercial PCR assays, with a 1–3-day interval over 76 days since symptom onset at maximum. To obtain viral load from cycle threshold (Ct) values, the conversion formula was used10:
The detection limit was Ct = 50, corresponding to 10−1.89 copies/mL. In addition to viral load, age and vaccination status were collected from each patient. The information about patients’ gender was not available. Note that we could not use similar data from the Omicron variant as all patients in that dataset were vaccinated. We aimed to quantify the effect of vaccination on viral dynamics.
The IRB review was exempted at Nanyang Technological University (IRB-2022-1041) for the data analysis in this study, as the data were de-identified before being shared with us. The data were provided by the corresponding author of the original multicenter cohort study9.
SARS-CoV-2 viral dynamics model
Viral dynamics models have been used to quantify the change in viral load of infectious diseases from infection to recovery. Specifically, to describe the viral load dynamics of SARS-CoV-2, we used the target-cell limited model6,7,11,12,13,14:
The model includes two variables: the ratio of uninfected target cells at time (t) to that at time 0, (fleft(tright)) ((fleft(0right)=1) by definition), and the amount of virus (copies/mL) at time (t), (V(t)). The three model parameters, (beta), (gamma), and (delta) represent the rate of cell infection, the maximum rate of virus replication, and the rate of infected cell loss, respectively. The time scale is the day after symptom onset. Only age (as a continuous linear term) and vaccination information were available in the dataset, thus they were accounted as potential covariates and the final set of covariates for each parameter was selected based on the model that gave the lowest Bayesian information criteria (BIC). Model parameters were estimated using a non-linear mixed effect model to account for individual variability in viral load dynamics. Random effects were considered for all parameters.
Assessing the leaking risk and excess isolation burden under different isolation guidelines
To account for individual variability, the model was run using parameter values sampled from the estimated joint posterior distributions for each simulated patient. The age distribution of the simulated patients was the same as the population structure in Singapore at the end of June 202315, and vaccination coverage was assumed to be 50%. For each simulated patient, we implemented the fixed-period guideline and the variable-period guideline considering different lengths of isolation. The length of isolation was fixed across all patients under the fixed-period guideline, while it was dependent on age and vaccination status under the variable-period guideline. To identify the best length of isolation under a certain guideline and compare between the two guidelines, the leaking risk and excess isolation burden of isolation were estimated and compared.
First, the leaking risk was estimated as:
where (N) is the number of patients (= 1000), (i) is the patient’s ID, ({s}_{i}) is the timing of ending isolation for patient (i), ({V}_{i}left({s}_{i}right)) is the viral load of patient (i) at time ({s}_{i}), and (I) is the identity function. Associated with the leaking risk, we also considered the expected secondary transmission produced by a patient (i.e., the effective reproduction number) under isolation programs, ({R}_{e}), which is defined as an average of the expected secondary transmission produced by symptomatic patients, ({R}_{e,S},) and that by asymptomatic patients, ({R}_{e,A}), respectively:
where (p) is the asymptomatic ratio. Assuming the same transmission potential for symptomatic and asymptomatic patients given that the viral load dynamics are similar regardless of symptom presence7, and that isolation is performed only for symptomatic cases, ({R}_{e}) is estimated as:
where (theta) is the contact rate per day and ({P}_{i}(s)) is per contact probability of infection of patient (i) at time (s). ({K}_{i}) and ({L}_{i}) are both time after infection, but ({L}_{i}) excludes the time of isolation (assuming that isolation is implemented only for symptomatic cases). ({P}_{i}(s)) is dependent on the viral load of patient (i) at time (s): ({P}_{i}left(sright)=frac{{{V}_{i}(s)}^{alpha }}{{{V}_{i}(s)}^{alpha }+{lambda }^{alpha }}), where (lambda) is the viral load at which ({P}_{i}left(sright)) reaches 50%, and (alpha) is the slope parameter16 (note: ({P}_{i}left(sright)) and ({V}_{i}(s)) are positively associated). Following previous literature using the wildtype SARS-CoV-216, we set (lambda ={10}^{7}) and (alpha =0.8). These parameters ((lambda) and (alpha)) were estimated using viral load data, individual reproduction numbers, and serial intervals. Note that the effective reproduction number without isolation is defined as ({R}_{e,0}=frac{{sum }_{i}{int }_{{K}_{i}}theta {P}_{i}(s){ds}}{N}). (theta) was computed assuming ({R}_{e,0}=3). (p) was taken to be 20%17.
Second, the average per-patient excess isolation burden (excess isolation burden) was estimated as:
where ({u}_{i}) is the time when ({V}_{i}) first drops below the infectiousness threshold, which was set as Ct = 25, corresponding to 106.11 copies/mL, based on our earlier study18. Note that the excess isolation burden is negative when more relaxed guidelines are implemented.
In general, strict guidelines yield lower risk but higher excess isolation burden, thus balance between the two should be considered. Here, assuming a 10% leaking risk and 1 as an effective reproduction number at the end of the isolation period, we explored the best length of isolation that minimizes the excess isolation burden. As the 10% of leaking risk is arbitrary (i.e., the threshold is determined by various factors such as characteristics of the disease [transmission potential and severity] and socioeconomic conditions of the society), we performed the same analysis using 5% and 20% of leaking risk. Furthermore, in our sensitivity analysis, we explored different infectiousness thresholds of Ct = 20 (107.71 copies/mL) and Ct = 30 (104.61 copies/mL) because there are different estimates for the infectiousness threshold in the literature19, and using different thresholds allows us to explore different scenarios on this duration. Isolation was assumed to start immediately after symptom onset.
We employed a variable-period approach, tailoring isolation lengths based on age (below or above 60) and vaccination status (vaccinated or unvaccinated). The 60-year age threshold was selected in alignment with Singapore’s age-stratified COVID-19 public health interventions, such as the initial prioritization of COVID-19 vaccines for individuals aged 60 and older20.
Reporting summary
Further information on research design is available in the Nature Portfolio Reporting Summary linked to this article.
Results
Descriptive statistics of the clinical data
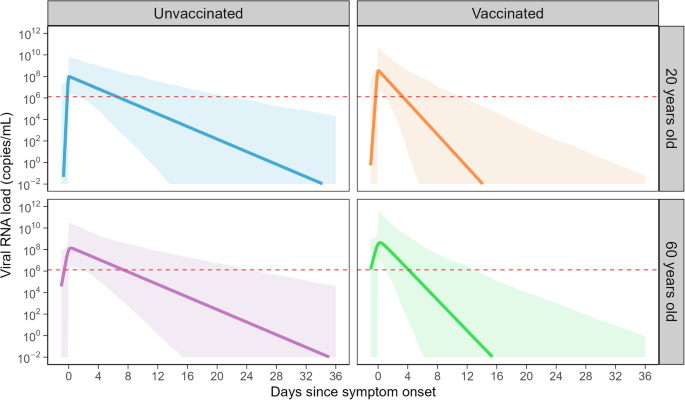
The clinical data comprises a total of 192 patients infected by the Delta variant. The mean age of the sample was 48.0 (range: 17–94), and 62 patients (32.3%) were vaccinated. On average, the viral load was measured 5.4 times, with the first test performed 2.2 days after symptom onset. The tests were performed at 1 to 76 days after symptom onset. Symptoms were defined by the physician in charge (typically fever, cough, shortness of breath, sore throat, and runny nose, which are standard for an ARI). 134 symptomatic patients (69.8%) had at least three viral load measurements and were used for subsequent analysis. Of the analyzed samples, the mean age was 47.9 (range: 19–94), 32 patients (23.9%) were vaccinated, and the mean number of viral load measurements was 6.5 times, with the first test performed 2.4 days after symptom onset. Thus, the characteristics of the analyzed samples are similar to those of the whole samples (Table 1). The viral load trajectories for the analyzed patients are plotted in Fig. 1.

The solid lines are viral load trajectories of the analyzed symptomatic SARS-CoV-2 Delta patients in Singapore, split by age and vaccination status. The day since symptom onset was used as the time scale. Points colored in red are below the limit of detection and are hence plotted at the detection limit value of Ct = 50 (10−1.89 copies/mL). The red dotted line is the infectiousness threshold of Ct = 25 (106.11 copies/mL).
Estimated viral load curves
Age (as a continuous linear term) and vaccination status were accounted as potential covariates, and the final set of covariates was selected based on BIC (Table 2). Age was a significant covariate on the rate of cell infection ((beta)), and the vaccination status was a significant covariate on the death rate of infected cells ((delta)), the rate of cell infection ((beta)), and the viral load at symptom onset ((Vleft(0right))). To intuitively assess the impact of the covariates, the viral dynamics for those aged 20 and 60 with different vaccination statuses were drawn (Fig. 2). The estimated rate of cell infection ((beta)) was lower for older individuals and for vaccinated individuals, which translates to a slower growth rate of viral load at the early phase of infection. Furthermore, the death rate of infected cells ((delta)) was larger for vaccinated individuals, which translates into a slower growth rate of viral load in the early phase of infection and a faster decline rate in the late phase. Overall, the duration of the viral shedding (i.e., the duration when viral load is above the infectiousness threshold) was substantially longer for unvaccinated patients. The viral load was above the infectiousness threshold when symptoms first appeared (i.e., (Vleft(0right)) > infectiousness threshold) regardless of vaccination status, which is in line with the epidemiological findings suggesting pre-symptomatic transmission21,22,23. The impact of age was relatively minor compared with that of vaccination. Examples of fitted curves of individual patients are available in Supplementary Fig. 1.
The solid lines are the estimated viral load curves with the best-fit population parameters for different ages (20 and 60 years old) and vaccination status. The light-shaded areas are 95% prediction intervals, which were determined by simulating 1000 parameter sets. The red dotted line is the infectiousness threshold of Ct = 25 (106.11 copies/mL).
Estimated leaking risk and excess isolation burden under different isolation guidelines
Under the fixed-period guideline, the length of the isolation period was negatively associated with the leaking risk and effective reproduction number (Fig. 3a, b), whereas it was positively associated with the excess isolation burden (Fig. 3c). In other words, stricter guidelines yield less risk but more excess isolation burden (i.e., average excess isolation burden across all patients in the simulated population). Thus, the best length of isolation needs to be set considering the balance between leaking risk and excess isolation burden. The best isolation lengths to minimize the excess isolation burden were 14 days or 11 days after symptom onset when using the leaking risk below 10% and effective reproduction number below 1 as a metric, respectively, using Ct = 25 as the infectiousness threshold (Fig. 3a, b). The corresponding excess isolation burdens were 7.4 days and 4.4 days, respectively (Fig. 3c). The effective reproduction number continuously drops with a longer isolation period and falls below 1 with 11 days of isolation when using Ct = 25 as the infectiousness threshold (Fig. 3b). We also performed sensitivity analyses where we changed the infectiousness thresholds (Ct = 20 and 30) and the acceptable leaking risks (5% and 20%). A higher infectiousness threshold (Ct = 20) and higher acceptable leaking risk (20%) were associated with a shorter best length of isolation and shorter excess isolation burden when using the leaking risk as the risk metric. When using the effective reproduction number as the risk metric, the optimal length of isolation is not influenced by the infectiousness threshold; however, the excess isolation burden increases with a high infectiousness threshold (Ct = 20) as infected individuals lose infectiousness earlier.
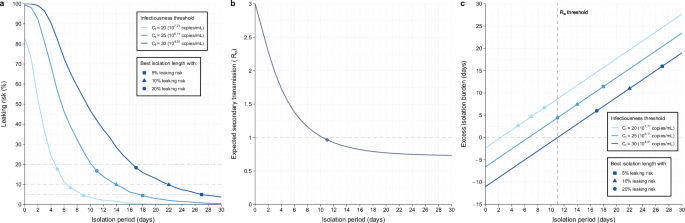
The proportion of patients who are still infectious when they end isolation (a leaking risk), the expected number of secondary cases produced by a single case (b effective reproduction number, Re), and the mean length of redundant isolation after they lose infectiousness (c excess isolation burden). The length of isolation was varied stepwise in the same manner for all individuals and repeated using different infectiousness thresholds. Note that the color and symbol keys apply to a, c only because Re considers the entire area under the viral load curve and is not bounded by a viral load threshold. Each symbol corresponds to the shortest isolation duration when each condition is met.
Under the variable-period approach, we set different isolation lengths depending on age (below or above 60 years old) and vaccination status (vaccinated or unvaccinated). First, we set different isolation lengths depending on vaccination status. The corresponding leaking risk, effective reproduction number, and excess isolation burden using Ct = 25 as the infectiousness threshold are depicted in Fig. 4a–c, respectively. Similar to the fixed-period guideline, a longer isolation period is associated with a lower leaking risk and a lower effective reproduction number but a higher burden. The upper-right regions of each panel separated by red and yellow solid lines in Fig. 4a, b correspond to the boundaries considering a 10% leaking risk and the effective reproduction number below 1, respectively. We explored the combination of isolation periods for those with and without vaccination to determine the smallest burden maintaining the leaking risk below 10%, which was 17 and 9 days for unvaccinated and vaccinated patients, respectively (red triangle in Fig. 4a). The corresponding burden was 6.4 days (red triangle in Fig. 4c). When the effective reproduction number was used as a risk metric, 13 and 6 days for unvaccinated and vaccinated patients were the best combinations with a burden of 2.9 days (yellow diamond in Fig. 4b, c). Table 3 summarizes the optimal length of isolation and excess isolation burden computed in the simulation using Ct = 25 as the infectiousness threshold. Indeed, by simply setting different isolation lengths depending on vaccination status, we could reduce the excess isolation burden by 1.0 day (from 7.4 to 6.4) or 1.5 (from 4.4 to 2.9) days using leaking risk <10% and ({R}_{e} < 1) as a criterion, respectively (Table 3). The isolation length is longer for unvaccinated individuals (Table 3) as the duration of viral shedding is longer (Fig. 2). Sensitivity analyses using different infectiousness thresholds (Ct = 20 and 30) and acceptable leaking risks (5% and 20%) are available in Supplementary Fig. 2.
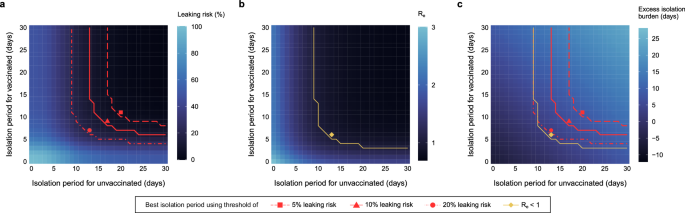
The proportion of patients who are still infectious when they end isolation (a leaking risk), the expected number of secondary cases produced by a single case (b effective reproduction number, Re), and the mean length of redundant isolation after they lose infectiousness (c excess isolation burden) using Ct = 25 (106.11 copies/mL) as the infectiousness threshold. The length of isolation was varied stepwise for those with and without vaccination independently. The upper-right regions separated by red and yellow lines correspond to the leaking risk below a certain level (i.e., 5%, 10%, 20%) and effective reproduction number below 1, respectively. Note that Re considers the entire area under the viral load curve and is not bounded by a viral load threshold. Each symbol corresponds to the combination of the isolation lengths to minimize the excess isolation burden in the region when each condition is met.
From our exhaustive simulations, the best combination of isolation periods using the leaking risk <10% as the main metric were 16, 14, 10, and 9 days of isolation for unvaccinated cases below the age of 60 years, unvaccinated cases above the age of 60 years, vaccinated cases below the age of 60 years, and vaccinated cases above the age of 60 years, respectively (Table 3). In this case, the estimated burden of excess isolation was 6.0 days. The best combination of isolation periods using ({R}_{e} < 1) as a criterion were 12, 13, 6, and 7 days of isolation for unvaccinated cases below the age of 60 years, unvaccinated cases above the age of 60 years, vaccinated cases below the age of 60 years, and vaccinated cases above the age of 60 years, respectively. In this case, the estimated burden of excess isolation was 2.6 days (Table 3). Thus, by optimizing the isolation length for each group with different age and vaccination status, the burden was reduced by about 1.4 (from 7.4 to 6.0) and 1.8 (from 4.4 to 2.6) days using the leaking risk and the effective reproduction number as the main metric to measure the risk of the strategy, respectively (Table 3). However, as the age impact on the duration of viral shedding is limited (Table 3), accounting for age in addition to vaccination status does not dramatically reduce the excess isolation period (0.4 and 0.3 days reduced using leaking risk <10% and ({R}_{e} < 1) as a criterion, respectively) (Table 3). In the sensitivity analyses changing the infectiousness thresholds and acceptable leaking risk, we confirmed that considering vaccination status substantially reduces the excess isolation burden, but the reduction by considering age in addition to vaccination status is limited (Supplementary Fig. 3). Further, consistent with the fixed-period guideline, a higher infectiousness threshold (Ct = 20) was associated with shorter best length of isolation and shorter excess isolation burden when using the leaking risk as a risk metric (Supplementary Fig. 3). Meanwhile, when using the effective reproduction number as a risk metric, the optimal length of isolation is not affected by the infectiousness threshold; however, the excess isolation burden increases with a high infectiousness threshold (Ct = 20).
Discussion
In hospital settings, isolating infected patients from non-infected patients is a standard infection prevention and control (IPC) intervention. Its application to emerging infectious diseases is attractive as a low-tech solution that can effectively interrupt transmission. However, isolation places a significant burden on patients and governments for its organization and enforcement. IPC guidelines balance the risk from pathogen transmission with the burden caused by isolation. In this study, the risk of onward transmission and the burden associated with optimal isolation were estimated for two guidelines: a fixed-period guideline and a variable-period guideline. The former considers patients to be isolated for a fixed period, whereas the latter considers different isolation lengths depending on patient characteristics. Using the SARS-CoV-2 Delta variant as a case study, we found that age and vaccination status impact viral dynamics. Specifically, vaccination and, to a lesser extent, younger age were associated with a shorter duration of viral shedding. Thus, we set different lengths of isolation depending on age and vaccination status under a variable-period guideline framework. By setting the leaking risk of isolation at 10%, we found that by using a variable-period guideline, the burden could be reduced to 6.0 days as compared to 7.4 days under a fixed-period guideline. A slightly better performance of variable-period guidelines as compared to fixed-period guidelines was also confirmed when considering the effective reproduction number as the risk metric to be minimized.
In this study, we only considered guidelines that do not require viral tests, as viral tests are expensive and logistically challenging. Indeed, in the US and Singapore, testing is not recommended to determine when to end the isolation of COVID-19 patients as of August 29, 20244,5,8. However, as we demonstrated in our previous studies6,7, the test-based approach using PCR tests or antigen tests could substantially reduce the burden if they are incorporated into isolation guidelines. Thus, if shortening the isolation period is important regardless of costs (and logistics) relevant to viral tests, the test-based approach might be the most suitable option. In fact, such a personalized approach better accounts for individual variability in viral dynamics. Nonetheless, the use of variable-period guidelines still represents a step forward in accounting for population variability in viral dynamics as compared to a “one-size-fits-all” approach. It is also important to stress that combining variable-period guidelines with test-based guidelines could represent another valuable option. For example, as of 2023, in the US, a fixed-period guideline is used for the general population; however, a test-based approach is recommended for categories with a substantially longer infectious period (e.g., immunocompromised patients)8.
It should be noted that we are not the first to propose the variable-period approach in practice. For example, in Singapore, a 7-day-isolation period is recommended for those who are fully vaccinated or below the age of 12 years old, and a 14-day-isolation period is recommended for the other cases5. However, our study provides solid scientific evidence. Our study provides scientific support for isolation guidelines that are tailored to an individual’s age and vaccination status, at least within the context of the SARS-CoV-2 Delta variant. However, it is crucial to distinguish between scientific guidelines and enforceable public health policies. We are not advocating for the implementation of mandatory isolation protocols based on age and vaccination status. Rather, our research provides evidence that could inform the development of nuanced public health recommendations that consider these factors.
A strength of our study is that the proposed simulation framework solely relies on viral load data, enabling easy assessment and comparison of the risk and burden associated with various isolation guidelines. Data was collected during a period when an initial period of assessment and isolation in the hospital was in place for all patients diagnosed with COVID-19. Hence, our cohort primarily includes patients with mild infections who would largely be managed in the community today, which is where the proposed variable-period isolation guidelines are most relevant. A second strength of our work is that throughout our series of studies6,7, including the current one, we compared fixed-period, variable-period, and test-based guidelines using the same approach. This allowed for a fair comparison of the three types of isolation based on the exact same methodology. Lastly, in addition to the leaking risk, we estimated the transmission potential, which may represent a more suitable metric to inform isolation guidelines.
Our study has several limitations that warrant discussion and further research. First, while our previous studies on ancestral SARS-CoV-2 lineages demonstrated similarities in viral dynamics with the Delta variant6,7,24, we recognize that these patterns may not hold for Omicron sub-lineages or future variants, thus limiting the generalizability of our results. Furthermore, some parameters derived from ancestral lineages were not available for Delta, introducing uncertainty that warrants further investigation. Second, another factor potentially limiting the widespread use of our approach lies in the potential scarcity of longitudinal viral load data available at the onset of an outbreak. Although efforts have been made to improve the collection of such data or proxies like longitudinal RT-qPCR, even before the COVID-19 pandemic, in countries including Singapore9,25, the timely and widespread availability of this data remains a potential limitation. We hope that highlighting the relevance of longitudinal viral load data will encourage widespread data collection efforts. Third, our study is constrained by the lack of data on patient characteristics on comorbidities, gender, race/ethnicity, history of previous infection, and detailed vaccination history (e.g., vaccine product, number of doses, time of vaccination). These factors are possibly associated with viral load26,27. While we incorporated age and vaccination status, future research should aim for a more inclusive understanding by considering these additional factors. Fourth, our study relies on the assumption of the relationship between viral load and transmissibility18,19. Since we lack data on contact tracing and onward transmission, this limits our ability to refine this assumption. Future studies integrating field epidemiological data with longitudinal viral load data on the traced patients could provide novel insights to establish a more nuanced understanding of the relationship between viral load and transmission. Fifth, the isolation of asymptomatic individuals presents further challenges. While crucial for controlling the spread of many infectious diseases, including COVID-19, the effectiveness of isolating asymptomatic individuals relies heavily on contact tracing or widespread screening programs for the timely identification of asymptomatic carriers. Our modeling design does not allow the simulation of such programs, limiting our ability to explore isolation guidelines for asymptomatic individuals. Further research incorporating both viral dynamics and between-hosts transmission dynamics into a unified framework would be warranted to explore such policies28. Sixth, while our study focused on the leaking risk and transmission potential as primary metrics for the assessment of the effectiveness of isolation guidelines, it is key to stress that a broader range of factors, including economic and societal costs, mental health impacts, and individual adherence, are essential considerations in determining the real-world effectiveness of a policy29. These factors are beyond the scope of our current study and the capabilities of our model, but they represent critical areas for future research.
In conclusion, the COVID-19 pandemic has imposed a substantial burden on our economic and educational activities. In the early phase of the pandemic, the isolation of infected individuals has been employed by most countries, but we still lack scientific data to pinpoint an optimal design for isolation guidelines. In this study, we have made an incremental step towards this goal by developing a computational framework to quantitatively compare different isolation guidelines. In the context of SARS-CoV-2, our study has shown that variable-period guidelines may reduce the burden of isolation as compared to fixed-period guidelines. Nonetheless, the development of a flexible framework that goes beyond SARS-CoV-2 is crucial. Such a framework could integrate data collection of epidemiological and virological data with modeling analyses to inform public health policies in real-time as the epidemiological and virological situation evolves during an epidemic.


Responses