Age, climate and economic disparities drive the current state of global dam safety
Main
Dams and reservoirs have facilitated settlements and growth of civilizations for over 5,000 years1,2 and remain a key actor in water, food and energy security3,4,5,6. By modulating the natural flow of watercourses7, large dams provide storage and attenuate the temporal variability of water resources, therefore acting as catalysts for development2,8. Furthermore, hydropower constitutes a major part of the world’s installed renewable energy capacity9, emerging as an essential component for the energy transition10. This is true both in terms of flexible energy production and large-scale energy storage capacity. Despite the remaining untapped potential for hydropower in Asia Pacific (39% of total), South America (25%) and Africa (24%)11 as well as selected deglaciating basins12, the construction of new dams is fraught with controversy6,13,14,15. Challenges arise from impacts on the environment, ecosystems16,17,18,19,20 and livelihoods21,22,23 as well as conflicts in transboundary basins24,25, among other serious considerations.
Dams also offer flood protection against extreme hydrological events26,27,28, but at the same time can create new hazards. Should a catastrophic dam failure occur, it can lead to substantial loss of life and financial losses in downstream communities29,30. In cases where insufficient warning is given before the dam failure, up to 1/10 of the downstream population could be directly endangered31. Timely alerts, on the other hand, have been estimated to considerably mitigate this risk, potentially reducing this fraction down to 1/100 or even to 1/5,000 (ref. 31). Given the implications that a dam failure can have on society, efforts by the International Commission on Large Dams (ICOLD) and national dam safety authorities since the middle of the past century have led to design guidelines targeting annual probabilities of failure of 1/10,000 for high-hazard dams32,33,34,35,36. Nevertheless, these efforts may now be challenged by altered hydrologic forcing37,38,39 and limited resources40,41,42.
At present, the global landscape features tens of thousands of dams7,43,44,45,46,47, developed under different design and safety guidelines42,48, and subject to varying operational, monitoring and maintenance standards49. This vast number of dams naturally places a financial burden on administrative bodies tasked with their oversight40,41. Hence, efforts to identify highest hazard dams can be crucial to optimize dam safety investments within budget constraints and avoid major catastrophes such as the recent dam failures in the Derna region of Libya (September 2023), which caused several thousand casualties50.
In this study, we evaluate historical large-dam failure reports51,52 and latest dam inventories45 to conduct a statistical, multiparameter survival analysis. This allows us to draw a dam safety profile for large dams, where correlations are decoupled to independently study key variables and their interplay. We adhere to the ICOLD’s definition of dam failure as “an uncontrolled release of water or structural damage”. Our analysis demonstrates the nonstationarity of the failure probability of large dams. Additionally, we categorize dam developments and failures by major climatic regions and discuss the underlying causes of dam failure, thereby enabling better insights into the climate susceptibility of recent failures. This analysis reveals the effect of different factors defining dam safety, which is relevant for the prioritization of future investments in large dams that frequently operate under budget-constrained decision-making scenarios41,42 and changing hydrological regimes8,26,37,53,54.
Large dam failure inventories and survival analysis
Approximately 62,000 large dams are catalogued by the ICOLD45 in their World Register of Dams (WRD, version March 2023), inventoried over decades55 through a joint effort with local dam experts and authorities. This dataset offers insights into the historical evolution of dam construction and dam characteristics (Supplementary Fig. 1). In many countries, dam construction activity experienced a notable increase during the 1960s (Fig. 1c–f). Some high-profile failures led to social unrest, for instance, the Malpasset dam (1959) or the Teton dam failure (1976). Catastrophic events of this nature triggered joint efforts to understand and mitigate such failures. As part of that, since the middle of the last century, a few databases on dam failures have been compiled51,52,56,57,58,59, with the ICOLD51 (up to 2018) being the most up to date and exhaustive. These databases have helped policymakers and dam stakeholders to identify critical improvement needs, leading to a general advancement of dam safety at global scale. In this investigation, we additionally update the ICOLD’s large dam failure compilation with reports from 2018 to 2024.

a,b, The estimated failure rate (per thousandth) (a) and total number of dams constructed (b). c–f, The temporal evolution of dam construction (bin width of 1 year), based on the WRD45 (black) and failure reports of the ICOLD51 (blue) for the USA (c), Spain (d), India (e) and Japan (f).
Our reassessment of both datasets (the WRD and the ICOLD Incident Database)45,51 reveals that the bulk historical failure rate varies widely across countries (Fig. 1a). In some countries, an unusual failure rate can be attributed to the stochastic nature of the events and the limited number of large dams within their borders (Fig. 1b). Conversely, other countries with a long investment in dam safety exhibit failure rates ranging between 0.2% and 1.5% (over the full dam life cycle). A singular case is that of China, for which the number of historical failures reported remains an order of magnitude below other countries with similar dam construction history. Following the ICOLD51, we exclude Chinese dams from the statistical failure analysis to avoid bias due to the ICOLD’s historical records potentially remaining incomplete in this region.
Several key characteristics included in the ICOLD’s datasets45,51 can be used for further analysis, such as the year of construction, dam type and dam height, as well as other factors such as the owning country’s gross domestic product (GDP), which serves as an indicator of available resources for dam safety investment. However, two crucial factors must be considered in the analysis: the characteristics of dams have evolved over time (Supplementary Fig. 1), and the failure records constitute a right-censored type observations (that is, it is only known if a dam has failed until its age at the last update of the ICOLD’s database, but nothing prevents the asset from failing in the future). Formally addressing these factors, we carried out a statistical survival analysis with all dams built between 1900 and 2022, representing 33,886 structures and 246 failures. Additionally, all large dams are classified according to major climatic regions to gain insights into present-day climate-dependent dam failures, which could be influenced by distinct hydrological signatures.
The fitted survival model yielded an estimated mean annual probability of failure for large-dams of (0.31times {10}^{-4}) for the year 2024, with 95% of dams ranging from (0.11times {10}^{-4}) to (1.28times {10}^{-4}) (Methods and Supplementary Table 1). In the following sections we detail key insights derived from this analysis.
Significant dam safety improvements in the late twentieth century
The probability of failure has improved significantly during the twentieth century (Fig. 2b), achieving a reduction in failure rate of 30% per decade on average terms since the early 1900 (estimated hazard ratio (HR) of 0.969, 95% confidence interval (CI) 0.965–0.977, P < 0.005; Fig. 2b,c and Supplementary Table 1). This positive temporal trend in dam safety is probably driven by advancements in technology and the strengthening of safety regulations, both catalysed by catastrophic events that triggered public concern and professional vigilance. This is often regarded as ‘lessons learnt’ in dam engineering, which has seek explaining the mechanics of the failure to avoid them in future projects.
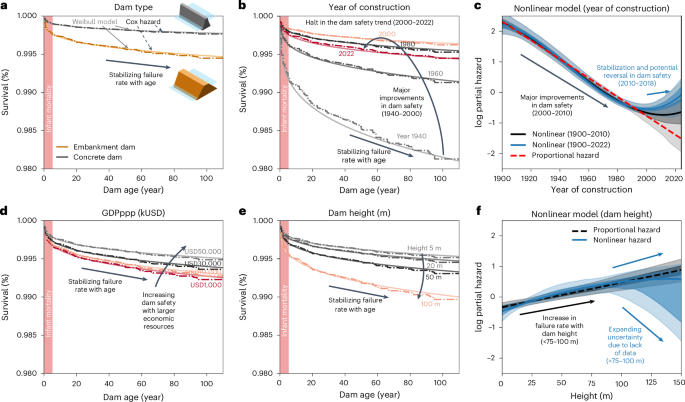
a,b, The partial effect of covariates dam type (a) and year of construction (b), in the survival model, CPHs (discontinuous line) and Weibull AFT (continuous line) (Methods). c, A comparison of a nonlinear effect of the variable year of construction (when using the dataset between 1900 and 2010 in black and 1900 and 2022 in blue) versus proportional effect (red). d,e, The partial effect of covariates GDPppp (d) and dam height (e) in the survival model, CPHs (discontinuous line) and Weibull AFT (continuous line). f, A comparison of a nonlinear effect of the variable dam height. The lines represent the mean value and shades indicate the 50% and 95% CI of estimates, respectively, in c and f computed by bootstrapping the dataset, discarding 30% of the observations during 500 replicates.
Some dam failure modes are intrinsically linked to the dam construction type, which can be generally classified as either embankment (rock or earth filled) or concrete/rigid (gravity concrete, masonry, arch or buttress dams), as determined by their primary construction materials and typology28. For embankment dams, failure is frequently related to internal erosion or overtopping damage51,52,60. These failures may arise from internal defects that lead to leakage, insufficient discharge capacity or operational errors. Another type of failure can stem from structural or foundational failure, such as those induced by an earthquake or constructive errors. In embankment dams, the most common failure modes (overtopping or piping) involve progressive erosion, starting slow and gradually accelerating as the flow erodes the dam body. The exception would be a rapid slope stability failure or liquefaction, which is more common on tailing dams. Concrete dams show a more ‘rigid’ behaviour, with structural collapses being closer to instantaneous, thereby abruptly releasing sudden ‘water-walls’.
The survival analysis verifies that embankment dams remain more prone to fail, exhibiting an estimated 2.31 times higher rate of failure than concrete dams51,52 historically (estimated HR of 2.31, 95% CI 1.65–3.23, P <0.005; Supplementary Table 1, Cox proportional hazard (CPH) model). We show, however, that this difference is more pronounced in the first years of operation (Supplementary Fig. 2a) and has also evolved over time (Supplementary Fig. 2). The ICOLD32 illustrates in their Figure 10-2 that failures due to internal erosion and structural damage steadily declined since 1975. This trend is probably attributable to improved construction methods and design techniques, which are characteristic developments that occurred in the second half of the past century60. Such improvements can also be linked to safer design standards or operation of the dam. Instances of overtopping failures have shown a sustained decrease until the end of the previous century for embankment dams and nearly disappeared for concrete dams. Failures caused by other factors such as earthquakes were rare, and human hostile actions leading to dam breaks were confined to the first half of the twentieth century.
Potential reversal of dam safety during the twenty-first century
Contemporary dam failures have sparked international distress, such as in Laos61 (2018), Vietnam’s Da Dang dam failure (2014) and Wadi Derna in Libya62 (2023). After a long hiatus, dams and human hostile actions have been again brought to public attention in the recent war in Ukraine15 (for example, the destruction of Kakhovka dam in 2023). The convergence of these international events as well as some notable dam incidents over the recent years has rekindled discussions on the potential hazards associated with dams63.
Figure 2b,c offers insights into the evolution of survival curves dependent on the year of construction. This variable is linked to differences in regulatory frameworks42, availability of technical knowledge48 or even to periods of economic development for certain geographic locations, which can explain improvements or declines in dam failure rates. Changes in the distribution of dam construction also present a shift in these dynamics. For instance, Schleiss8 highlights how dam construction has intensified during the past two decades in a belt that extends from Southern Europe over to the Middle East and Central and East Asia, with further meridional extensions in South America and Africa. These regions essentially match areas with more hydropower growth potential11 or greater water storage needs.
The examination of different scenarios suggests a surge in dam hazard when considering dams constructed, specifically in the past decade (Fig. 2c). While the reasons for failures several decades ago were expected to be majorly related to incomplete technical knowledge57, this cannot currently hold true as evidenced by the dam safety improvements and reduced failure rates up to the 2000s (Fig. 2c). This new dam safety scenario raises questions about what caused the stabilization and subsequent potential reversal of dam failure rates at present. Another interesting aspect is that, whereas overtopping failures decreased throughout the last century, we now observe that this trend has reversed over the past two decades (Supplementary Fig. 6a). Overtopping, majorly linked to flooding context, has in this period become twice-to-thrice more prevalent.
Construction era, infant mortality and ageing effects
The survival curves for large dams (Supplementary Fig. 2a) show that during the first 5 years after construction, the failure probability is notably larger and it stabilizes afterwards. Early studies such as refs. 35,59 already identified this early peak in risk of dam failure in the 1970s–1980s, and the ICOLD data51,52 in 1995 and 2019 confirmed this trend. This pattern of early stage failure is common to various engineering systems and is widely known as infant mortality64. This dynamic of failure corresponds to new engineering products64, reinforcing the concept of each dam as a unique engineering product42. The critical moment is often identified as the first reservoir filling35, when latent defects may suddenly emerge. A contemporary example of infant mortality is the catastrophic dam failure in the Mekong Basin of Laos61 in 2018. Our analysis of all dams built since 1900 reveals that the cumulative failure probability during the first 5 years is only matched over the next 55 years for embankment dams and 45 years for concrete dams (Fig. 2a). Supplementary Fig. 2b–d shows the estimated survival curves by dam type stratified by construction periods (1900–1940, 1940–1980 and 1980–2020). These show the steady reduction in ‘infant mortality’ over time, revealing that modern concrete dams have become increasingly resilient to this mechanism.
Both scientific and general literature frequently pinpoint ageing infrastructure as a particular vulnerability of legacy engineering systems15,65, reviving widespread international concerns about dams. During the ageing of dams, and especially after the 50-year mark, several factors have been raised as potentially increasing the risk of failure65, including material degradation66 and the mechanical wear-off for components such as gates, which require regular maintenance that is generally expected to become more expensive over time65,66. Conversely, ageing can be mitigated through diligent maintenance and monitoring, which are both essential elements of comprehensive safety protocols67. Given the constrained resources available for dam safety and the relative proportion of older dams—specifically, 53% over 50 years old, 16% over 70 years old and 7% over 100 years old from all entries of the WRDs in 2024—any information on the changing hazards related to dam ageing is crucially important to understand how these opposing factors affect the fate of ageing water infrastructure.
This analysis (Fig. 2b and Supplementary Fig. 2) reveals a consistently stable HR following the initial infant mortality phase, with no evidence so far of an accelerated failure rate due to ageing; that is, no wear-off phase as dams get older64, at least within the current observational horizon. Despite these positive trends, the prevalence of decades-old dams constructed worldwide suggests that they will continue to dominate future dam failure statistics due to their large numbers. Although there is no apparent increase in individual hazard with advancing age (Supplementary Fig. 2), it is crucial to recognize that dams constructed in different decades exhibit varied ageing profiles (Fig. 2b). Essentially, older dams may not become more hazardous than they were, but they just continue to belong to a period of different constructive technology and design standards.
Increasing risk with increasing dam height (up to 100 m)
We explored the relationship between failure probability and dam height (Supplementary Table 1), uncovering a consistent rise in failure rates for dams ranging from 15 to 70–100 m in height (HR of 1.008, 95% CI 1.003–1.013, P < 0.005). On average, a dam of 30 m height would be exposed to 10% and 20% lower failure rate than a dam of 45 or 60 m, respectively. Beyond the 100 m mark, the failure rate may stabilize or even decrease, although the limited sample size does not allow for conclusions without high uncertainty (Fig. 2f).
This trend is relevant, as risk encompasses both the likelihood of failure and the potential severity of consequences35,39, which increases with the dam size. Consequently, for dams within the 15–100 m range, not only is the potential for extensive flooding due to dam breaks greater with increasing height, but so too is the probability of such failures occurring. Previous analyses may have underestimated the risk associated with height by not decoupling the opposing effects of two correlated variables: the increasing height and the more recent design and construction era up to 2000, which saw the construction of both generally safer but also larger dams (Supplementary Fig. 1g,h).
Regional variability in dam safety and investment capacity
An examination of dam failure rates worldwide reveals a geographical distribution that has shifted over decades. We classify the dam construction and failure records into three major climatic regions (Methods, Supplementary Table 2 and Supplementary Fig. 5): (1) tropical and monsoon, (2) arid and semi-arid (including desert) and (3) mild temperate. This grouping reveals that historical failure rates by climate category are comparatively similar, in general terms (Table 1). A more complete examination of the data can be carried out by crossing climatic regions and the purchasing power parity gross domestic product (GDPppp, as reported for 2018). The latter is here considered as a proxy for the resources that countries have available to invest in construction, inspection and monitoring, and potentially upgrading to adapt to latest hydrological scenarios. This is also relevant since lower economic resources have been linked to increased flood mortality68, and dam break waves represent the most extreme case of flooding.
Our analysis (Fig. 2d) highlights that a reduction in GDP is associated with an increase in the failure probability of dams (HR of 0.99, 95% CI 0.984–0.997, P < 0.005; Supplementary Table 1). Specifically, an increase of USD10,000 in GDPppp is associated with approximately a 10% reduction in the failure rate. Furthermore, the increase of dam hazard in low-GDP regions seems accentuated in tropical and monsoon areas (cf. Fig. 3). Wealthier states may be better positioned to invest more in dam safety, without compromising investments in other public expenditures that may appear more socially and politically urgent. This is especially critical because strict dam safety protocols and their implementation, together with necessary future-proofing schemes, are the key factors that can counter changes in the late ageing mortality of dams. With increased frequency of extreme rainfall and floods54,69,70,71,72, outlet works may be required to operate more often and surveillance frequency should become more relevant to mitigate any adverse change in dam safety.

a, A two-dimensional kernel-density plot of the dams constructed in the climate zones of tropical and monsoon, arid and semi-arid, and mild temperate (Supplementary Table 2) for dams built between 1900 and 2022 according to the owning country’s GDPppp. b, A two-dimensional density plot for the year of construction of dams failed per climate zone. c, GDPppp distribution for all dams built/failed per climate zone.
A more complex dynamic is disentangled when analysing the GDP in the context of the year of construction. It can be observed that in high-GDP countries peaks of failure occurred decades before the peaks of construction (Fig. 3a,b), hence raising public awareness and leading to the development and consolidation of dam safety standards; that is, lessons learnt from past mistakes73. This, together with the infant mortality phenomenon35,59 for recently developed dams, and the fact that the dam construction activity has sharply declined in countries with a long-standing dam-building tradition and has shifted to countries undergoing rapid development8, where dam failures may have not transferred into stricter protocols, has probably contributed to the aforementioned dam failure rate increase. Capacity building and the transposition of safety practises32,42 and regulatory frameworks74 from regions with a mature dam safety implementation—built upon numerous dam failures in the past century73—as well as transposition from recent local experiences, could contribute to increase dam safety.
Links to spatial variability and temporal changes of climate
During the past decades, the number of failures due to construction and material defects has consistently declined. Nevertheless, we observe more flood-driven failures, thus overshadowing reductions in any other failure context (Supplementary Fig. 6). To further discuss these hydrology-dependent circumstances, we consider two hypotheses: (1) newly built dams are commonly developed in regions with climatic conditions that differ from the hydrologic signature facing older dams (spatial variability) and (2) climate change-induced variability, which may be challenging existing rigid designs that only contemplated past predictions for extreme weather events (nonstationarity).
Regarding the first hypothesis, our analysis (Fig. 3) shows that historical failure rates remained similar in most climatic areas (Table 1) when considering all dams built after 1900s (failure rate in tropical and monsoon: 0.70%, 95% CI 0.57–0.84; mild temperate: 0.92%, 95% CI 0.73–1.13; and arid and semi-arid: 0.61%, 95% CI 0.45–0.78). Additionally, there is a consistent reduction of the failure rates in mild-temperate and arid climates from the 1970s onwards. This reduction has not been matched within the tropical and monsoon climate (Table 1 and Supplementary Fig. 7), where the failure rate has not reduced for dams built in the past two decades (0.51%, 95% CI 0.20–0.85), mostly attributable to failures in low-mid GDP regions (0.90%, 95% CI 0.33–1.58 for GDPppp <12kUSD versus 0.18%, 95% CI 0–0.47 for GDPppp >12kUSD). This is consistent with the transfer of failures from higher to lower-GDP regions seen in recent decades (Fig. 3a,b).
Concerning hypothesis 2, literature substantiates an increase in the frequency of precipitation extremes globally37,38, which might result in more frequent exposure of dams to large floods. The type and context of failures observed in the past two decades are connected to flooding and overtopping events, as shown in Supplementary Fig. 7, which is extending into the period 2020–2024. Although we cannot statistically confirm a connection to variability of climate in this study; further investigation is recommended. Current estimates identify between 5% and 7% increase in the most extreme precipitations (on average terms) for every degree of warming75, in line with the Clausius–Clapeyron relationship76. This precipitation increase could lead to an increase in flooding of up to 10%, based on 1:30 return period floods, for ref. 75, although this is sometimes attenuated by catchment conditions77. In view of these climatic projections, dams not undergoing regular hydrological safety reassessment could contribute to increasing hazard above our predictions.
Special attention may be needed to account for the intensified monsoon/cyclone dominated rainfall78, for instance, due to the increasing atmospheric moisture in the Indian Ocean79 or in Mediterranean regions80,81,82. This is more important when also coupled with low-GDP circumstances, as evidenced by our analysis. An additional climatic factor to consider is that most glaciers are expected to retreat (monsoon-Himalayan83 and tropical-Andean84, for instance, but generally upheld worldwide85,86), which will produce notable changes in seasonal reservoirs inflows over the next decades, thereby posing challenges in the annual management of reservoirs. An associated risk are the glacier lake outburst floods, which are expected to increase in the high-mountain Asian region over the coming decades, associated to a 45–55% volume increase of ice-dammed lakes by 208087. Our analysis is not able to identify future changes in dam safety due to this phenomena, but local, detailed, specialized climate analyses combined with actual dam characteristics, such as those of Fluixá-SanMartín et al.39, can be crucial for dams subject to varying hydroclimatic forcing.
A critical combination for dam safety
We used the fitted survival model (Weibull accelerated failure time (AFT); Methods and Supplementary Table 1) to estimate failure probability for the dams’ dataset reported in the WRD of ICOLD45, including all large dams built between 1900 and 2022. To identify risk groups and their main characteristics, we selected dams with an estimated failure probability higher than 1/10,000 in 2023 (N = 2,389 dams). These higher-hazard dams were clustered through a k-means model (Supplementary Fig. 5) to reveal four groups and their distinct features: (1) embankment dams of moderate-large heights (10–80 m), built in the previous 10 years in regions of low–mid GDP (N = 1,178), (2) embankment dams across all GDP areas built in the period 1900–1940 (N = 840), (3) large concrete dams (50–150 m) built in the last 5–10 years (N = 198) and (5) large embankment dams built in low–mid GDP areas in the past two decades (N = 369).
This grouping, consistent with critical factors identified in Figs. 2 and 3 facilitates insights into potential risk mitigation strategies that should include67,88 (1) structural safety, (2) surveillance and maintenance and (3) emergency planning. The group (2) primarily cover dams built in the beginning of the past century, where ongoing monitoring and maintenance are crucial for early identification of faults. For these dams, adaptations to accommodate revised hydrological data are vital and the identification of construction weaknesses that could be improved with modern technologies.
On the other hand, for the other groups (1, 3 and 4), upholding strict safety guidelines is essential for risk reduction, regardless of the geographical region. Dams in these groups will soon experience a significant reduction in their annual probability of failure, as many will move out of the infant mortality phase, although new dams may replace them. For all the identified risk groups, when there is a population at risk downstream, emergency planning must be prioritized. In the absence of detailed local studies, this classification can guide dam owners in the allocation of dam safety efforts.
A global outlook and projection into the near future
On the basis of our estimates, ~4.4% of the dams analysed remain by 2024 at an annual probability of failure larger than 1/10,000 (Fig. 4d). Figure 4a shows the geographical distribution of these dams (red markers), based on the georeferenced WRD45 dataset combined with our predictions. We forecast the number of expected large dam failures for the near future using a Poisson binomial distribution (Fig. 4e,f and Methods) and the modelled annual failure probability for each structure. Figure 4f depicts the expected number of large-dam failures for large dams built between 1900 and 2022 included in the WRD of ICOLD45, with 23 (95% CI 14–33) dam failures expected in the period 2023–2035 (excluding new construction of dams).
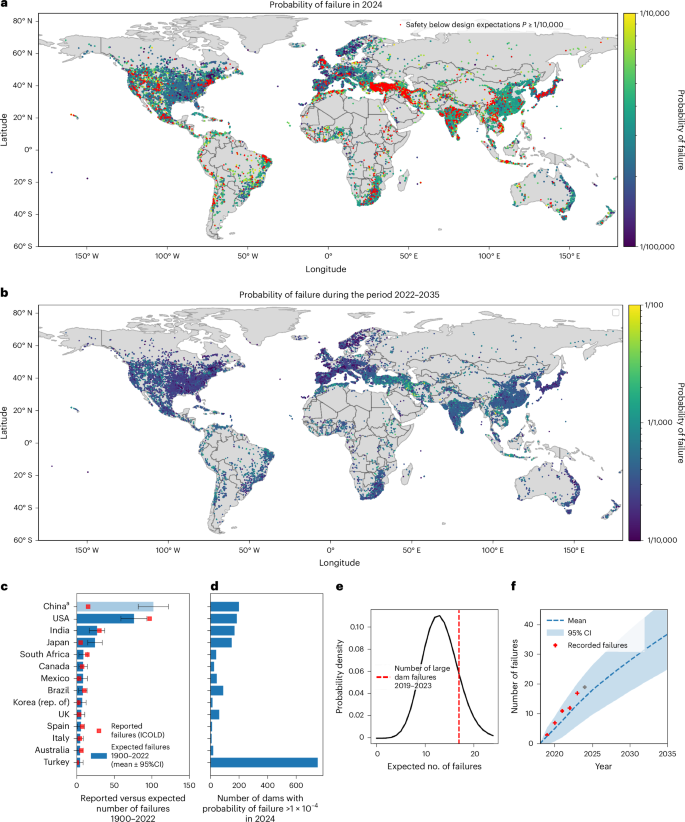
a,b, The probability of dam failure by 2024 (a) and by 2035 (b). c, A comparison between the predicted number of failures 1900–2022 versus reported ICOLD historic large dam failures. aThese records were not used when training the failure predictive model. d, The number of dams with an annual probability of failure ({{P}} > 1times {10}^{-4}) in 2024. e,f, The predicted number of future large dam failures computed using a Poisson binomial probability distribution informed with our survival model, probability density function of the expected failures in the period 2019–2023 (e) and yearly distribution in the period 2019–2035 (f) versus the number of actual recorded failures per year 2019–2024.
These predictions are compared with the actual number of recorded catastrophic failures observed in the period 2019–2023 (Fig. 4f). The numbers of recent dam failures have been predicted reasonably well by our forecasting model, but our model projections may be considered just as a baseline estimation, since the construction of new dams during the forecasted period is not accounted for, and changes in climate dynamics may further affect rates of flood-induced failures. Observing dam safety more carefully in regions with recent dam developments8 might be crucial to ensure that the infant mortality stage is safely passed. Countries identified at higher risk (Fig. 4d) due to recently intensified dam construction, such as Turkey, may soon see their dams becoming considerably safer. Other countries with a large set of dams built before 1970s, especially for embankment dams, may require observation of latest hydrological information without ignoring monitoring and maintenance.
In contrast to the expected number of failures and the higher-risk groups identified, 85% of the large dam population remain at an annual failure probability that is one half (that is, <5 × 10⁻⁵) of the probability target (1/10,000) of some of the strictest dam safety guidelines in current use32,33,34. Dams constructed between the 1960s and 1980s in mid-to-high-GDP countries constitute the majority of that group, which highlights again the relevance of maintenance, monitoring and uprating to preserve acceptable safety levels.
Methods
Curated database of dams and failures
The WRD database, by the ICOLD45, is considered in our analysis as representative of the total global large dam population. The WRD (until March 2023) contains about 62,000 dams along with several characteristics, such as size, type, year of construction and country. The 2019 ICOLD51 Incident Database is the latest update of the ICOLD’s Bulletin 99 (ref. 52), a database of 322 historical dam failures collected until 2018. The bulletin mostly considers events involving large dams (according to the ICOLD, dams with a height of 15 m above the foundation or height between 5 and 15 m with a capacity larger than 3 × 10⁶ m3). The ICOLD defines dam failure as an incident in which the structural integrity of the dam or any of its components is lost, or resulting in an uncontrolled water release. Within the bulletin, accidents related to appurtenant works and tailing dams were excluded, and thus our analysis is not representative for these dams (for which the probability of failure may differ from conventional large dams). The authors completed the failures database using official and online reports of large-dam failures between 2018 and September 2024.
We constructed a survival dataset by merging the WRD database and the failures database for dams. Only dams constructed (and failed) in the period 1900–2022 were considered, since the WRDs was last updated in March 2023 at the time of analysis (duplicates between both registers were eliminated). The dataset contained these variables: owner country, year of construction, year of failure (if failed), height from foundation to crest and dam type. We grouped all WRD dam type designations into embankment dam or concrete dam, with compound dams designated as embankment dams as well. This basic classification for the dam type is commonly embraced in literature28. The GDPppp (in international USD for 2018) was collected (from the World Bank’s national accounts data) for each country. Chinese dams were excluded from the statistical analysis due to ICOLD’s failure records potentially remaining incomplete in this region51,52. The selected dataset considered 33,886 large dams and 246 failures. A total of 735 (non-failed) dams were missing at least one analysis variable (type or height). Missing data were filled in by drawing random samples from each individual country’s empirical distribution of the same variable. Multiple realizations of this resampling were conducted, and their effect on the fitted models was found negligible.
Survival analysis
The survival function refers to the proportion of subjects in the large dams’ population that have not failed before a given time, and it can be defined as89
with the probability (P) of the random variable time of failure (T) to occur after a certain time t. Additionally, the time-dependent failure rate can be described via the hazard function h(t) (ref. 89)
The cumulative hazard function is represented by the integral of the hazard function within a given time horizon (t)
which is related to the survival function through
Non-parametric KM survival curve
The Kaplan–Meier (KM) curve is a non-parametric statistic that provides an estimation of the survival function S(t) from time-to-failure data. The KM statistic formally treats the presence of right-censored information within the dataset (that is, dams that have not failed yet but may fail in the future) by including it in the survival function estimator, which is computed as89
where ti is the time of occurrence of event i, di is the number of failure events and ni is the number of surviving individuals. The KM curves were estimated from the dam failure database stratifying the dataset by dam construction type and time period.
CPH model
A CPH model is used to describe the link of external covariates and the hazard function of the processes under study90. CPH assumes proportionality of the covariate effects; however, it does not prescribe an underlying probability distribution to the hazard function. The CPH model is expressed as
where h0(t) is the baseline time-dependent hazard function that is modified by an exponentiated linear regression of a vector of covariates x (with (bar{{bf{x}}}) their mean value) and a vector of fitted regression coefficients β. Both the baseline hazard and the covariate regression coefficients are derived by maximum-likelihood estimation.
Weibull AFT model
Accelerated failure time models require the specification of an underlying probability distribution. However, as opposed to the CPH model, they allow extrapolating the hazard curve—necessary when predicting future probabilities. We found a good agreement of the inferred CPH curves and a Weibull deterioration model in the period 1900–2022 (Weibull AFT; Fig. 2a,b,d,e). In the Weibull AFT model90, the hazard and survival curves are formulated as
where x represents the vector of covariates and (bi,ρ) is a series of fitted parameters.
Statistical analysis, robustness and limitations
The dataset on failed and non-failed large dams is considered a right-censored set (that is, observations where outcomes are known only since the dam’s construction and until 2022). KM survival curves (with Greenwood CI estimates) were used to estimate survival across various periods from 1900 to 2022, stratified by construction method (Supplementary Fig. 2). A series of survival regression models, including CPH and Weibull AFT models, were employed to explore the relationship between dam characteristics (for example, dam height, type, GDPppp per capita of the owner country and year of construction) and the probability of failure at a given age (Supplementary Table 1). The CPH model was adjusted using only ICOLD failure records (1900–2018) and afterwards also using the completed failure records (1900–2022), showing that the direction and intensity of effects does not change substantially (Supplementary Table 1, models CPH and CPHICOLD). The effect of covariates was quantified using the estimated mean HR and the corresponding 95% CIs. The HR parameter indicates the relative effect of a variable change on the dam failure rate, a HR >1 represents a factor that increases the failure rate, meanwhile HR <1 reduces it. Model goodness-of-fit was assessed using the concordance index and Akaike information criterion. All models where fitted with at least 30–60 events per fitted variable, complying with the recommended >10–20 ratio for survival analysis91,92.
The Python library lifelines93 was used to fit the survival models (CPH and Weibull AFT) using the maximum-likelihood method. A cross-validation scheme (using 500 random samples of the dataset with 70%/30% training/validation split) was used during training. The best performing model achieved a concordance index of 0.71 (95% CI 0.66–0.77).
The Weibull AFT model was used to estimate the annualized probability of failure of structures based on their physical properties (of the considered parameters) in the near future. This model only explains part of the variability in the failures observed and the real individual structure failure probability should be informed with in situ assessment of the structure (that is, design criteria, structural or foundation state). Thus, estimates of this model should be considered as a bulk number and not relied in a dam-by-dam scenario. However, lacking detailed in situ observations, these estimates can be used to identify groups of higher hazard based on the historical trends of dam failures.
Expected number of large-dam failures for a given period
The probability of a structure failing within a certain time period t, conditional to have survived until age t0, and with characteristics encoded in the covariate vector x can be quantified as
with (S({t|}{bf{x}})) the survival rate estimate at age t. For instance, the probability of a given individual dam i (constructed in the year yc) failing within the period of te additional years (and conditional to have survived until 2018) can be simulated as ({P}_{i}left(Tle 2018-{rm{yc}}+{t}_{e}|T > 2018-{rm{yc}},{{bf{x}}}_{i}right)) following equation (10).
Estimating whether this dam has (or has not) failed within a given period can be posed as a Bernoulli trial with probability of failure (Pi), under the assumptions of stationarity of the driver processes and independence of failures. In probability theory, the Poisson binomial distribution represents the expected number of successes (k) from N independent, non-identically distributed Bernoulli trials. Its probability mass function can be written as
for which Fk is the set of all subsets of k integers contained in ((1,2,ldots ,N,)). A represents each drawn subset, and Ac its conjugate. Computing the probability density of the Poisson binomial distribution is challenging for a large number of trials (as in our case) due to the bad scaling of equation (11) with increasing N. On the other hand, the mean and variance of the Poisson binomial distribution can be readily computed as
We used the implementation provided by Hong94 to generate estimates of the Poisson binomial probability density function from the collection of dams in the WRD conditional to having survived in 2018, the numbers of annual failures were estimated for the period 2023–2035. Figure 4f compares these estimates with the recorded failures in the period 2019–2024. Although the model captures well the observations until date, this should be taken as baseline predictions, since future predictions did not consider the construction of new dams since 2023.
Climate zone classification
The WRD of the ICOLD provides georeferenced coordinates for most of the dams in the inventory (~90.5% of them, excluding Chinese dams), dams for which the coordinate was not available, were assigned a random location within their owning country borders. Additionally, we performed a manual georeferencing of the failure cases included in the ICOLD’s failure bulletin. Using the dam’s coordinates, we sampled the climate zone for each dam location based on the Köppen climate zone global map produced by Rubel and Kottek (2010) updated for 2018. The Köppen–Geiger climate classification differentiates 31 zones with distinct climate characteristics. We clustered these zones in four distinct regions attending to processes relevant for dam safety, as described in Supplementary Table 2. This rationale is founded on climate-related considerations specific to dam safety (for instance, see Fluixá-SanMartín et al.53). Owing to the low number of failures in the tundra and cold climate cluster (Supplementary Table 2), all analyses reported in the main manuscript only attend to the other three climate zones. Supplementary Fig. 5 shows the world distribution of failures and climate zones.


Responses