Aging and senescent fates of oligodendrocyte precursor cells in the mouse brain

Introduction
Efficient nervous system function relies on the maintenance of myelin-rich fiber networks, through which high-velocity communication propagates throughout the brain. Disruption of white matter integrity with age is associated with progressive declines in cognition and neurological function1. OPCs are progenitors that differentiate into oligodendrocytes (OLG), which myelinate nerve fibers. Emerging evidence suggests that after development, region-defined OPCs exhibit diverse functional states2,3. White matter-resident OPCs are more densely populated and have greater capacities to proliferate and differentiate, compared to gray matter-localized cells4,5,6. Dynamic properties of OPCs are also reflected in morphology, where homeostatic states are associated with bipolar or highly-branched phenotypes, whereas larger and amoeboid morphologies are associated with disease states7,8,9. Although homeostatic roles of OPCs have been well described, the effects of aging on OPC identities, especially across different brain regions, remain unclear. Importantly, the accumulation of pro-aging stressors in brain niches like white matter may trigger functional shifts in OPCs and neighboring cell networks, which may underlie multimodal dysfunction10,11. For example, microglia, the brain-resident myeloid population, interact with OPCs to promote myelin development and repair12. We and others showed that in aged white matter, microglial cells harbor disease-associated and senescent identities, which may perturb local niches13,14. Senescence, characterized by stable cell-cycle arrest, morphological changes, and a pro-inflammatory secretory phenotype, is an aged cell fate that manifests across different brain cell types, including OPCs15. Subsets of OPCs display increased DNA damage, elevated senescence-associated β-galactosidase activity, or upregulated expression of senescence genes, including the cyclin-dependent kinase inhibitors (CDKIs) Cdkn2a/p16 and Cdkn1a/p21, in both aging and Alzheimer’s disease models16,17. Therefore, we hypothesized that OPCs display region-specific phenotypes in aging, that senescent OPC subsets accumulate with age, and that pharmacogenetic targeting of p16-postive senescent cells modifies age-associated properties of OPCs.
To probe OPC aging phenotypes across brain regions, we assessed immunofluorescent properties of PDGFRα+ OPCs in the myelin-dense fimbria (FIM) and hippocampal dentate gyrus (DG) of young and old mice (Supplementary Fig. 1). Among fimbria-resident OPCs (Fig. 1a, b), we identified age-related increases in multiple parameters of cell size (Fig. 1c, Supplementary Table 1). Concurrent with these morphological changes, aged OPC density in the fimbria was significantly lower (42% decrease), relative to young mice (Fig. 1d). Analysis of the nearest microglia neighbor of individual OPCs revealed closer proximity in the aged fimbria, compared to the young fimbria (Fig. 1e). In the hippocampal DG, we did not detect differences between the morphology of young and old OPCs (Fig. 1f–h). However, similar to the fimbria, OPC density decreased in the DG of aged mice (Fig. 1i). Proximity analyses did not reveal age-related changes in OPC localization, relative to microglia in the DG (Fig. 1j).

a–b PDGFRα (green), IBA1 (red), and DAPI (blue) immunostaining images of OPCs in young (a’, b’) and old (a’’, b’’) fimbria, with high-magnification PDGFRα images in b. Plots of mean values of morphological parameters (c) and mean number of PDGFRα+ OPCs per square millimeter (d) of the fimbria in young (n = 6) and old mice (n = 9). Cumulative distributions of OPC distances to the nearest IBA1+ cell in the young (white circles) and old (gray squares) fimbria (e). f–g PDGFRα (green), IBA1 (red), and DAPI (gray or blue) immunostaining images of OPCs in the young (f’, g’) and old (f’’, g’’) DG, with high-magnification PDGFRα images in g. Plots of mean values of morphological parameters (h) and mean number of PDGFRα+ OPCs per square millimeter (i) of the DG in young (n = 5) and old mice (n = 10). Welch’s t-test was used to compare young and old OPCs in each region. Cumulative distribution of OPC distances to the nearest IBA1+ cell in the young (white circles) and old (gray squares) DG (j). Kolmogorov–Smirnov test was used to compare cumulative distributions of the populations (KSD). For cumulative distribution plots, lines on individual points represent SEM and the inset show a histogram of the same data with a fitted Gaussian curve (young = dotted, old = solid). ROIs were isolated as described in Methods. Open circles indicate females, while open triangles indicate males. Bars represent mean ± SEM.
To determine whether OPC subpopulations develop molecular senescent profiles in the aged brain, we analyzed a publicly available single-cell RNA-sequencing data from young (2–3 months) and old (21–22 months) mouse brains18. We identified 2319 OPCs (Pdgfrα, Ptprz1, Cspg5 positive cells; Fig. 2a) through unbiased clustering. Among all brain cell types, OPCs, mature oligodendrocytes, and microglia constituted the largest subpopulations of p16-expressing cells (Fig. 2b, Supplementary Fig. 2a). We observed an increase in the mean number and percentage of OPCs expressing Cdkn2a/p16 in the aged brain, compared to young (Fig. 2b, c, Supplementary Fig. 3). Additionally, OPCs constituted eight of 24 cells co-expressing p16 and p21, among all cell types (Fig. 2d; Supplementary Fig. 2b, c). To explore functional gene signatures, we performed ingenuity pathway analyses (IPA) of differentially expressed genes in p16+ OPCs. The most significantly activated canonical pathways included senescence, cell cycle regulation, and protein metabolism pathways (Fig. 2e). We next identified markers enriched in the p16+ (Cdkn2b, Meox1) and aged OPC (Serpina3n, Nol3, Skap2) subpopulations with senescence-linked cellular functions (Supplementary Fig. 2d). When comparing young to old animals, these genes showed relative increases in transcript-per-million-fold change (f’) and in the percentage of OPCs expressing the individual markers (f”). We also found a significant, age-related increase in the average expression of all five markers in individual OPCs (Fig. 2g, h). These transcriptomic analyses demonstrate molecular senescence features of a p16+ OPC subpopulation, which increases in relative abundance with age.
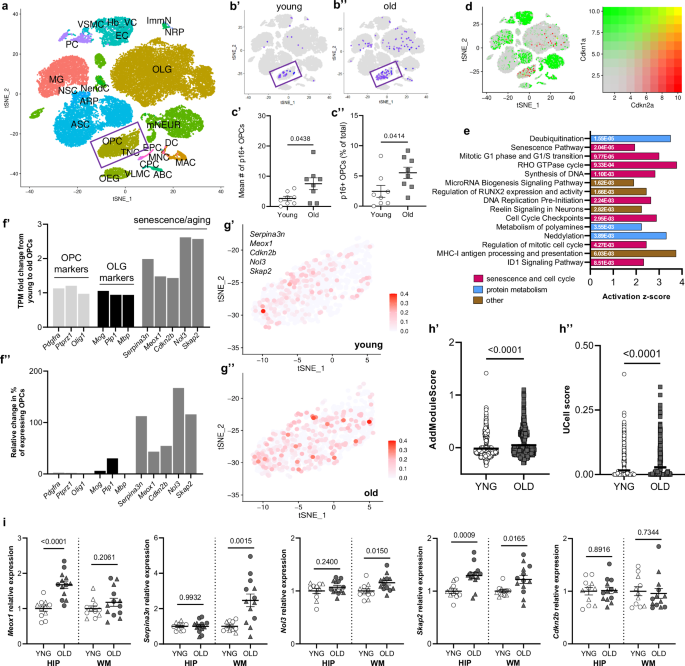
a T-distributed stochastic neighbor embedding (tSNE) plot of brain cells clustered according to cell-type markers in young (n = 8) and old (n = 8) male mouse brains from a publically available transcriptomic dataset18. b Cdkn2a/p16-expressing cells in young (b’) and old (b’’) brains. Inset = OPC cluster. c Plots showing mean number (c’) and mean percentage (c’’) of p16-expressing OPCs (total OPCs = 1134 young and 1005 old OPCs, n = 8 mice per age) (Welch’s t-test). d Visualization (as in a, b) of young and old cells expressing Cdkn2a/p16 (green) and Cdkn1a/p21 (red). Color gradient for co-expression is shown. e Bar plot displaying z-scores of significantly activated canonical pathways in p16-expressing OPCs derived from IPA. Exact p values are shown inside the bars (Fischer’s exact test). f Bar plot showing transcripts-per-million (TPM) fold change from young to old OPCs of precursor identity (light gray), mature lineage (black), and emerging OPC aging/senescence (dark gray) markers (f’). Relative change from young to old in the percentage of OPCs expressing the listed markers (f’’). g tSNE plot of OPCs from young (g’) and old (g’’) mice, showing average expression levels of OPC aging/senescence markers (Serpina3n, Meox1, Cdkn2b, Nol3, Skap2), derived from Seurat’s AddModuleScore function. h Plot of gene signature scores (visualized in g), calculated using AddModuleScore (h’) or UCell (h’’) in young and old OPCs24. Mann–Whitney test was used to compare ranks of module scores between young and old OPCs. i Relative expression of emerging OPC aging/senescence markers in the hippocampus and adjacent white matter of young (n = 11) and old (n = 13) mouse brains. Open circles indicate females, while open triangles indicate males. Bars represent mean ± SEM. Exact p values are shown.
To investigate the regional localization of markers of OPC aging and senescence, we microdissected the hippocampi and adjacent white matter fimbria and corpus collosum tracts of young and old mice and characterized gene expression signatures with RT-PCR (Fig. 2i). In the aged hippocampus, we observed significantly higher expression for Meox1 (1.68-fold increase), relative to young controls. In aged white matter, Serpina3n (2.47-fold increase) and Nol3 (1.15-fold increase) were expressed at higher levels, relative to young controls. Interestingly, expression of Skap2 was significantly greater in both the hippocampus (1.3-fold increase) and fimbria (1.2-fold increase) of aged mice, relative to young mice. The presence of unique and shared age- and senescence-related transcriptional changes across gray and white matter compartments suggest differential features of OPC subpopulations and potential responsivity to senescence-directed intervention.
To test the hypothesis that senescent cell targeting modulates OPC populations localized to distinct white and gray matter niches, we used the p16-InkAttac mouse model, in which mice treated with AP20187 (AP) experience systemic apoptosis of p16-expressing cells19. We previously demonstrated upregulation of senescence transcriptional signatures in the aged mouse brain associated with cognitive decline are more pronounced in females10, leading us to focus on the effects of senescent cell clearance in aged OPC populations in the female mouse DG and fimbria (Fig. 3). In the aged fimbria (Fig. 3a, b), treatment with AP reduced multiple parameters of OPC cell size, which effectively shifted morphological measurements closer to those observed in young brains (Fig. 3c; Supplementary Table 2, Fig.1c). Although the density of OPCs was unchanged in the fimbria of AP-treated mice (Fig. 3d), OPCs became more distal to microglia after senescent cell clearance, relative to untreated mice. (Fig. 3e). In contrast, OPCs localized in the DG were unresponsive to AP treatment, as determined by a lack of changes in morphology, density, or proximity to microglia (Fig. 3f–j).
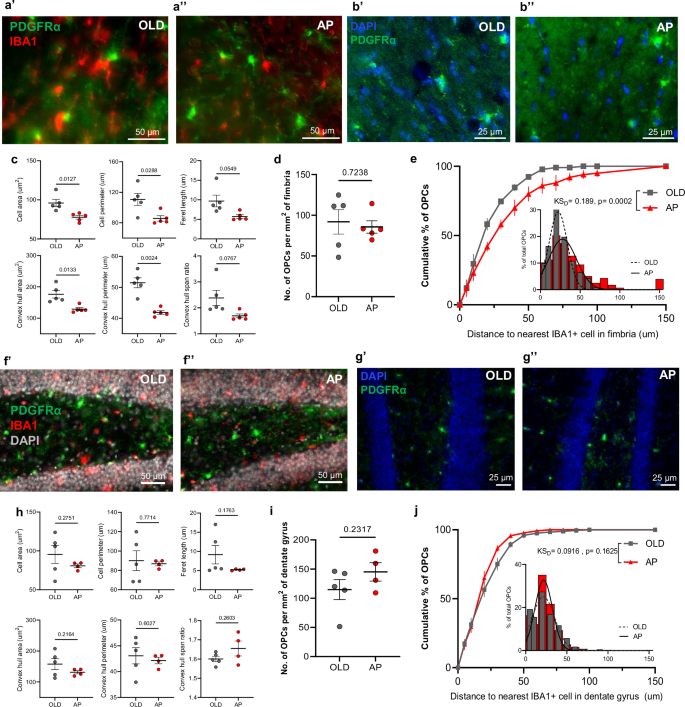
a, b High-magnification PDGFRα (green), IBA1 (red), and DAPI (blue) immunostaining images of OPCs in the old (a’, b’) and AP-treated (a’’, b’’) fimbria. Plots of mean values of morphological parameters (c) and mean number of PDGFRα+ OPCs per square millimeter (d) of the fimbria in aged (n = 5) and AP-treated mice (n = 5). e Cumulative distribution of OPC distances to the nearest IBA1+ cell in the old (gray squares) and AP-treated (red triangles) fimbria. f–g High-magnification PDGFRα (green), IBA1 (red), and DAPI (gray or blue) immunostaining images of OPCs in the aged (f’, g’) and AP-treated (f’’, g’’) DG. Plots of mean values of the indicated morphological parameters (h) and mean number of PDGFRa+ OPCs per square millimeter (i) of the DG in old (n = 5) and AP-treated (n = 4) mice. Welch’s t-test was used to compare OPCs from old and AP-treated mouse brains in each region. j Cumulative distribution of OPC distances to the nearest IBA1+ cell in the old (gray squares) and AP-treated (red triangles) DG. Kolmogorov–Smirnov test was used to compare cumulative distributions of the populations (KSD). For cumulative distribution plots, lines on points represent SEM and the inset show a histogram of the same data with a fitted Gaussian curve (old = dotted, AP = solid). ROIs were isolated as described in Methods. All mice represented here are females. Bars represent mean ± SEM.
We note that OPC and microglial proximity changes in aging and following intervention may result from alterations in the abundance and/or localization of either cell type. To better understand dynamic relationships between OPC and microglia proximity, we simulated a pseudo-distributed cell map of OPCs and microglia by modeling the ranges of cell density and size observed in our experimental data for OPCs and in our separate analysis of microglia in the aged mouse fimbria13 (Supplementary Fig. 4). We simulated the range of microglia density from youthful (lower density) to aged (higher density) and observed that increasing microglia density alone decreased the distance between OPCs and microglia. We next simulated the conditions of experimental data from the fimbria of old mice treated with vehicle or AP, and we confirmed that a decrease in microglia density following AP treatment corresponded to greater distance between OPCs and microglia. Thus, senotherapeutic control of microglia in the aged brain may account for shifts in proximity between OPCs and microglia.
Together, our results support the hypothesis that limbic white matter-localized OPCs are more susceptible to age-related compositional changes compared to OPCs in gray matter. Aged fimbria-resident OPCs significantly decreased in density but increased in measures of cell size, which is a feature of senescent cells20. These findings are aligned with emerging data on the vulnerability of distinct brain niches, like white matter fiber tracts, to chronic inflammation and other age-related stressors11,13. We also discovered a fimbria-specific, age-associated increase in OPC-microglia proximity, which reflects one of likely numerous cell interaction changes in this age-vulnerable niche. Although the specific functional implications of altered OPC-microglia proximity remain unclear, both cell types likely respond to local signaling associated with white matter dyshomeostasis21. We determined that subsets of aged OPCs acquire senescent molecular profiles and are characterized by markers of disease-associated oligodendrocyte signatures (Serpina3n), anti-apoptosis pathways (Nol3), and integrin signaling (Skap2) which, together, may contribute to OPC dysfunction in aging. Investigation of these markers throughout the lifespan with imaging modalities is an important future direction. Finally, targeting p16+ senescent cells in aged mice reverted age-associated increases in OPC cell size and proximity to microglia in the fimbria, but not the DG. We previously showed that senescent cell targeting using the p16-InkAttac model reduces the abundance of senescent and disease associated microglia in the aged female fimbria13 and infiltrating immune cells throughout the aged female brain10. Whether changes in fimbria OPC phenotypes result directly from senescent OPC targeting or indirectly through modulation of senescent microglia or other cell types is an important gap to address. How other brain microenvironments respond to senescent cell clearance is largely unknown but can be addressed by technologies that simultaneously probe molecular signatures and precise anatomical location, such as spatial-omics13. We note that AP20187, the drug used to target p16-postive senescent cells in the p16-InkAttac mouse model is thought to have limited brain penetrance in young mice22,23. To our knowledge, region-specific brain penetrance of AP20187 in aged or neurodegeneration models hasn’t been established, which raises important questions for follow-up on brain parenchymal versus peripheral senescent cell effects that directly influence age-vulnerable brain microenvironments. Furthermore, whether and how distinct classes of senotherapeutics penetrate and modulate particular senescent cell types in functionally-distinct microenvironments is not well established. Overall, this study provides fundamental insights into age- and senescence-related changes of OPC phenotypes in white matter, which may inform regenerative interventions towards an essential cell type in the aged brain.
Methods
Single cell RNA-sequencing analyses
Mouse brain scRNA-seq matrix data were downloaded from GEO with the accession number GSE12978818. Transcriptome data were derived from brains of 8 young (2–3 months) and 8 old (21–23 months) mice. The data were processed with R (v4.0.3) and Seurat (v4.0.2) following the standard workflow24. There was no significant batch effect observed, so all data were merged directly using the “merge.all” function in Seurat. For quality control and filtering, cells with detected genes <200 or >2500, or with mitochondrial gene content >5% were excluded. Cells were then clustered with a resolution of 0.5, and UMAP reduction was applied with dimensions 1:20. Cell annotations were performed using the automated tool scMayoMap and confirmed with canonical cell type markers25. Gene signature scoring for individual OPCs was performed for Serpina3n, Meox1, Cdkn2b, Nol3, and Skap2 using the “AddModuleScore” and AddModuleScore_UCell” functions in Seurat26. Ingenuity pathway analysis was performed on p16+ OPCs using QIAGEN IPA (QIAGEN Inc.). Activated pathways were listed as defined by IPA software.
Animals
Animal experiments were performed under protocols approved by Mayo Clinic Institutional Animal Care and Use Committee. Mice were group-housed in ventilated cages with a constant temperature of 25 °C, 30–70% humidity, a 12-h light/dark cycle, and were provided 5053 PicoLab Rodent Diet 20. AP20187 working solution (2 mg/kg) was prepared by mixing 40 µL stock solution (in ethanol) with 100 µL PEG-400 and 860 µL of 2% Tween-20 in ddH2O, given by intraperitoneal (i.p.) injection. The corresponding vehicle was composed of ethanol, PEG-400, and Tween-20 and was administered to control animals via i.p. injection. All mice also received an oral gavage vehicle created as a solution of 60% phosphatidylcholine in propylene glycol (Phosal 50 PG, Lipoid GmbH), 30% PEG-400, and 10% pure ethanol. Mice received 5 consecutive daily administrations for one week, two weeks off, and then another 5-day treatment. Treatments were discontinued one week prior to necropsy. Brains from young (3–4 months) and old (16–20 months), male and female p16-InkAttac mice (C57BL/6 background) were collected for expression and imaging studies. Brains analyzed in this study were also analyzed for other experimental outcomes for a different study13. During tissue collection, mice were euthanized with a lethal dose of pentobarbital, and transcardially perfused with ice-cold PBS. The left-brain hemisphere was microdissected to isolate the hippocampus and adjacent white matter tracts, which were immediately transferred to TRIzol for gene expression analyses. The right-brain hemisphere was drop-fixed in 4% PFA for 24 h and transferred to 10% and 20% w/v sucrose solutions for 24 h at a time, followed by a 48-h incubation in a 30% w/v sucrose solution. Then, the brain tissues were cryopreserved in 30% glycerol, 30% ethylene glycol, 40% PBS w/v at −80 °C, until the time of immunofluorescence imaging.
Real-time polymerase chain reaction (RT-PCR)
RNA from hippocampus and white matter were isolated using TRIzol-based chloroform-isopropanol precipitation. Concentration and purity were analyzed, and 2 µg of total RNA was prepared for cDNA synthesis through M-MLV reverse transcription (Invitrogen, #18091200). Using a QuantStudio5 RT-PCR system (ThermoFisher) with PerfeCTa FastMix II Low ROX (Quantabio) and Taqman PrimeTime qPCR assays from Integrated DNA Technologies (IDT), RT-PCR was performed for the following transcripts: Serpina3n, Meox1, Cdkn2b, Nol3, and Skap2. Genes were normalized to Hprt housekeeper expression. Relative expression compared to the young tissue of a region was derived from the 2-ΔΔCT value of each sample.
Immunofluorescence imaging
Right hemisphere brains were embedded in Tissue-Tek O.C.T. compound and sliced sagittally at 30 μm section thickness on a Leica CM3050 S cryostat (Leica Biosystems). Free-floating sections were stored in wells containing ice-cold PBS + 0.01% sodium azide. Sections were blocked and permeabilized in 8% donkey serum, 0.1% Triton-X, 0.1% Tween-20 for 2 h at 25 °C. After 5 × 5 min. thorough washes in cold PBS, sections were quenched for 10 min. with 1X True Black Plus lipofuscin autofluorescence quencher (Biotium, #23014), diluted from a 40X stock in PBS. After 5 × 5 min. thorough washes in cold PBS, sections were stained with primary antibodies diluted in 8% donkey serum, overnight at 4 °C. Antibody combinations consisted of goat polyclonal anti-IBA1 (Abcam, #ab5076, RRID:AB_2224402) and rabbit polyclonal anti-PDGFRα (Cell Signaling, #3174, RRID:AB_2162345). The next day, after 3 × 5 min. washes with PBS, sections were stained with donkey host secondary antibodies conjugated to fluorophores (Jackson Immunoresearch, anti-goat AF594 (RRID:AB_2340432) and anti-rabbit AF488 (RRID:AB_2340619) for 2 h at 25 °C. After 3 × 5 min. washes with PBS to remove excess fluorophore, sections were mounted onto Superfrost Plus microscope slides with Vectashield with DAPI (4′,6-diamidino-2-phenylindole, Vector Laboratories, #H-1200) with a 1.5 glass coverslip. Sections were imaged with a Nikon Ti2 Eclipse Inverted microscope with 10X, 20X, and 40X Plan Apo objectives, 8-channel Spectra III light engine, and using the Orca Fusion BT sCMOS camera with Nikon Elements AR software. 405, 488, and 594 laser lines were used with an image exposure time of 200 ms per channel in 16-bit readout mode. For each mouse, two sections were analyzed, with at least 4 mice per group.
Image analyses
ImageJ was used to process image data and generate representative figures. The DiAna ImageJ plugin tool was used for quantifying population density and spatial proximity of PDGFRα+ (OPC) and IBA1+ (microglia) objects27. Upon scale calibration, thresholding was performed for each channel to generate binary masks of cells. Regions-of-interest (ROI) were selected using the Polygon tool, measured, and isolated using the Clear Outside tool. The latter step was necessary to exclude strong background signals from brain compartments outside of the ROI and to optimize signal thresholding. For the fimbria ROI, the easily identifiable, finger-like structure of the fimbria was preserved, while surrounding endothelial and choroid plexus areas were excluded. For the DG ROI, the molecular and polymorph layers were isolated from the neuron-rich, granule cell layer. ROI selections were equated in terms of area, where possible. For each channel, the “DiAna Segment” tool was then used for cell segmentation, from which population density can be calculated with object counts per unit area. The “DiAna Analyse” tool was used to quantify the distances between the center of a PDGFRα+ object to the nearest edge of an IBA1+ object. Cumulative distributions were calculated, plotted, and analyzed from these data. OPC morphology was characterized with the same binary masks of PDGFRα channels used above, with cell area, cell perimeter, convex hull area, convex hull perimeter, convex hull span ratio, and Feret length measured, adapted from a previously defined morphometric analyses of rat microglia28.
Modeling OPC and microglia density-based interactions
To determine the proximity relationships between OPCs and microglia, a model simulation was created using R language (sf package) that randomly distributed polygonal cells on a 1 mm2 area. A pseudo-cell size parameter was assigned according to ranges derived from experimental data either for fimbria-resident OPCs or IBA1+ microglia. Cell-type density was variably assigned as the number of cells present on the 1 mm2 grid. The cumulative distribution function of proximity between OPCs and their nearest-neighbor microglia was calculated, as above in experimental image analyses. First, a range of microglia density 300–900/mm2 was plotted as a variable to calculate proximity. Second, experimental densities were compared between old control and old AP conditions within the fimbria. The OPC parameters and ranges of cell size were derived from experimental data within this work. The microglia parameters of cell size and density ranges were derived from microglia data under the same age, brain region, and treatment conditions13.
Statistical analyses
GraphPad Prism v9.02 and R v4.2.1 were used for statistical analyses and generation of graphs. P ≤ 0.05 was considered statistically significant, and exact p-values are listed on plots, except for values < 0.0001, in which the approximate value is listed. Binary variables (no. of cells, % of cells, relative expression, population density, and morphological parameters) were compared using two-tailed, unpaired t-tests with Welch’s correction, under the assumption that standard deviations are unequal between the two groups. The Mann–Whitney test was used to compare the ranks of gene signature scores derived using AddModuleScore and UCell, as described in Single cell RNA-sequencing analyses. The Kolmogorov–Smirnov test was used to assess the cumulative distributions of OPC distances to the nearest IBA1+ cell in young and old brain regions, with the exact D-statistic listed.


Responses