Allele-specific electrical genotyping for diagnosis of transthyretin amyloidosis

Introduction
Most clinical genetic tests are characterized by slow turnaround times (TAT), often spanning from days to weeks. Both clinicians and patients could benefit from genetic testing that is rapid, affordable, and easy-to-interpret. This is particularly important for relatively common and clinically significant DNA variants, such as those linked to hereditary transthyretin amyloidosis (ATTR), cystic fibrosis or sickle cell anemia. ATTR is a treatable cause of heart failure with a hereditary form that disproportionally affects patients of West African ancestry1,2. The TTR variant c.424G>A, p.V142I (aka V122I) is pathogenic and occurs in 3–4% of individuals of West African ancestry. This condition profoundly affects individuals and their communities, leading to diminished quality of life, higher rates of morbidity and mortality, and a substantial strain on healthcare systems. Despite a significant association with heart failure, clinical manifestations often precede diagnosis by years3,4. V142I ATTR remains underdiagnosed in the US and other countries due to the lack of available information about the variant’s clinical significance, coupled with the high cost of genetic diagnosis. Timely ATTR diagnosis is important now that effective ATTR-specific therapies are approved5,6 or in clinical trials7,8,9,10,11. In response to this unmet need, we previously developed a rapid molecular test to obtain a genetic diagnosis for TTR V142I from a drop of blood in less than 30 min12,13. Our approach combines allele-specific polymerase chain reaction (ASPCR)14,15 and rapid gel electrophoresis to identify patients that are positive V142I heterozygous or homozygous, or negative (wildtype). The rapid TTR assay was employed in post-hoc analyses of a congestive heart failure (CHF) clinical trial, which found that 11% of African-Americans carried V142I in the TOPCAT trial, suggesting under-recognition of TTR-related heart failure in this cohort16.
In this research, our objective was to substitute agarose gel electrophoresis readout with electrical DNA detection, aiming to advance the development of point-of-care (POC) testing for cardiac amyloidosis. Impedance-based biosensors provide a label-free approach to DNA detection, serving as an efficient alternative to fluorescent and colorimetric techniques17. These biosensors also present the added advantage of cost-effectiveness and ease of miniaturization18,19. Electric DNA detection in conjunction with microfluidics has been employed for the detection of cancer biomarkers, tuberculosis, and SARS-CoV-220,21,22. Previously, detection of DNA molecules in solution using impedance has been reported, but there has been no exploration into how impedance changes vary between different DNA sequences23. We previously reported multifrequency impedance spectroscopy for the quantification and sizing of different DNA fragments24. This method involved linking PCR products to paramagnetic beads, which increased the cost and complexity of the experimental protocol and restricted its application in low-income settings. Consequently, there is an unmet need for detecting specific DNA fragments directly in solution using label-free impedance-based technology. Here, we developed a technique for detecting a common point mutation in the TTR gene (V142I) employing ASPCR and electrical impedance. We developed an electrical model for our biosensor to monitor the progressive impedance changes in the solution as DNA samples are introduced into the microfluidic chip. Our results demonstrate robust DNA detection across varying concentrations, revealing a strong correlation between impedance changes and DNA concentration.
Results
System overview
We developed a method for the digital genotyping of TTR V142I using allele-specific polymerase chain reaction (ASPCR) and passive-flow microfluidic impedance cytometry at different excitation frequencies. Our custom microfluidic chip (Fig. 1a) is made of polydimethylsiloxane (PDMS) bonded to a glass wafer with gold electrodes. The gold electrodes are patterned on the glass wafer through standard lithographic techniques and the gold is later deposited using electron beam deposition. The PDMS chip is made using a master mold on silicon, and the PDMS chip and holes are punched in for the inlet and outlet of the chip. The PDMS is bonded to the glass wafer using air plasma and subsequent thermal baking of the wafer. The DNA solution and DI water are pipetted into the inlet and the solution is allowed to flow over the microfluidic channel between the gold electrodes to measure the impedance at eight different frequencies. A photograph of multiple microfluidic chips bonded on the glass wafer with the gold electrodes is shown in Fig. 1b. A single 3′′ wafer can accommodate six microfluidic chips with the current placement configuration on the wafer. An illustration of the electronic readout system used for the microfluidic chip with integrated gold electrodes is shown in Supplementary Fig. 1. This system comprises a commercial benchtop impedance spectroscope, a transimpedance amplifier, the custom microfluidic chip with the integrated gold electrodes, and a personal computer for data storage and analysis. The impedance spectroscope has in-built function generators that provide the excitation signals for the microfluidic chip at eight different frequencies. The eight excitation signals at different frequencies are set to operate within the range of 10 kHz to 3 MHz and are divided into two signal paths. One of these signal paths is external to the impedance spectroscope and is connected to only one of the two gold electrodes on the microfluidic chip. The second signal path is connected internally to a mixer, which is part of the internal demodulator of the impedance spectroscope. The other gold electrode in the electrode pair of the microfluidic chip is connected to a transimpedance amplifier to convert the current passing through the microfluidic chip into a voltage which can be demodulated and measured. The transimpedance amplifier is a critical component in the system. A commercial transimpedance amplifier with a programmable transimpedance gain from Zurich Instruments provides low noise performance. The output from the transimpedance amplifier is fed back into the impedance spectroscope’s input, where it is demodulated digitally by mixing with the original excitation signal and then subsequently low-pass filtering. The parameters for the low-pass filter and the analog-to-digital converter can be set from the graphical user interface (GUI) of the impedance spectroscope. The low-pass filter minimizes noise while ensuring a clear signal for detecting the gradual impedance change that indicates DNA presence in the solution. The experimental impedance data is stored on a personal computer and post-processed using an algorithm to calculate the rate of impedance change.

a Microfluidic chip schematic, (b) photograph of chips on a fused silica wafer, (c) cross-sectional view with electrical model showing capacitances and resistances affecting impedance, and (d) microscopic image of the microfluidic channel with integrated gold electrodes. PCR products disrupt the electric field as they flow across the electrodes. Key biosensor dimensions are shown in Supplementary Fig. 2. Abbreviations: Parasitic capacitance (Cpar), double layer capacitance (Cdl), dipole capacitance (Cdi), and solution resistance (Rsol).
Principle of detection – the electrical model
The microfluidic chip’s cross-sectional view is shown in Fig. 1c. The solution to be measured is pipetted into the inlet and the fluid flows under the action of capillary flow towards the outlet. One electrode is connected to the output of the impedance spectroscope, which provides the excitation voltage for the microfluidic chip. The other electrode is connected to the input of the transimpedance amplifier, which amplifies the signal and passes it to the input of the impedance spectroscope, where it is again demodulated. Figure 1d shows a microscopic image of the microfluidic chip with the critical dimensions of the digital genotyping sensor. A software design diagram of the microfluidic chip including the critical dimensions is provided in Supplementary Fig. 2. The gold electrodes are 20 µm wide and there is a 15 µm gap between the two electrodes. The microfluidic channel itself is 20 µm wide and 15 µm in height. Understanding the operation of the microfluidic impedance-based sensor and the various parameters influencing its impedance is crucial. Figure 1c presents a basic electrical model of the sensor and models the major capacitances and resistances associated with the structure of the electrical sensor. Cpar is the parasitic capacitance associated with the electrodes on the glass wafer. The Cpar is an unwanted parameter, and its effects should be minimized during impedance measurements. In a real-world scenario Cpar will have some effect on the sensor performance. Cdl is the double layer capacitance which is formed due to the ion barrier formed in a solution when a solution is subjected to an electrical field. The electrical field creates a charge ion distribution that exhibits capacitance characteristics, which negatively impacts impedance measurements. When performing impedance-based measurements, focus should be on the impedance of the solution itself, which can be seen in the figure as Rsol, the solution resistance. The solution resistance is directly affected by the conductivity of the solution present in the sensing region of the biosensor. Additionally, we incorporate another capacitance in our model to measure DNA. As a negatively charged molecule, DNA alters the surrounding ion distribution, exhibiting dipole-like behavior and generating capacitance-like properties. This is represented in our electrical model as dipole capacitance, Cdi.
The impedance-based sensor functions based on the principle that the conductivity of the DNA solution differs from that of a basic buffer or negative control solution. The DNA will affect the Cdi capacitance to modify the impedance of the overall sensor. The impedance alteration will occur gradually as the DNA in the solution moves from the inlet to the outlet. Over time, the concentration of DNA in the sensing region will vary, manifesting as a rate of impedance change.
The overall impedance of the sensor is given by Eq. (1):
Where ZCpar = (ωCpar)-1, ZCdl = (ωCdl)-1, and ZCdi = (ωCdi)-1. Of these capacitances, of note is the change in the impedance due to the Rsol || ZCdi component of the impedance. More specifically, we are interested in the rate of change of the impedance due to this component, which can be represented by Eq. (2):
Equation (2) represents the slope of the impedance response, which correlates with the DNA concentration in the solution. A more negative impedance response slope indicates a higher DNA concentration within the sensor. And by Ohm’s law Z = V/I, therefore the current will be inversely proportional to the impedance. Equation (3) represents this mathematically:
The output response from the sensor is current, which is converted to voltage via a trans impedance amplifier, which is then recorded using an analog to digital converter. The rate of change of the current, and consequently the output voltage, is directly related to the DNA concentration in the sensing region of the sensor. Thus, the slope represents the DNA present in the solution. The experimental protocol has been specifically designed to account for this rate of change in the impedance response.
DNA detection using high and low excitation frequencies
Figure 2a compares DNA in two different solutions (water and buffer), with each solution acting as a negative control. The excitation frequency is set to 10 kHz. The graph confirms the initial hypothesis, showing that DNA in solution produces a steeper slope in the output voltage response compared to the corresponding negative control. Figure 2b indicates a similar output response at the higher end of the spectrum at 3 MHz. The slopes of the responses adhere to the initial assumption that the slope will be higher when DNA is present. However, at higher frequencies, the responses become much closer and more challenging to distinguish from the negative control. Therefore, it is recommended to focus on the lower end of the frequency spectrum during experimentation for better differentiation.
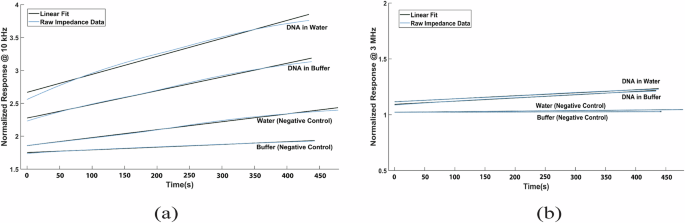
Normalized impedance comparison for DNA in water, DNA in buffer, water (negative control), and buffer (negative control) at (a) 10 kHz and (b) 3 MHz.
Differences in DNA concentration in water and buffer
We next investigated how variations in DNA concentration in water and buffer affect the impedance response. Using DNA concentrations of 100 ng/μl, 50 ng/μl, 33 ng/μl, and 10 ng/μl, we observed a direct correlation between DNA quantity and the slopes of the impedance response (Fig. 3). Notably, lower excitation frequencies provided improved differentiation between samples with varying DNA concentrations. Additionally, clear differences were observed in the impedance response when DNA was measured in water compared to buffer. First, the slopes of the output response are consistent for both water and buffer, and the concentration of DNA is directly correlated with the slope. Second, the negative control/No-template control is clearly distinguishable at all four concentrations tested, although input at 10 ng/µl shows some irregularity. Third, and perhaps most importantly, the graph for DNA eluted in buffer solution has a relatively smaller standard deviation and generally follows a linear trend. As a result, the data for DNA in buffer is less noisy, and the different concentrations may be easier to distinguish compared to cases where DNA is eluted in water. Furthermore, the slope for the no-template control in the buffer solution generates a negative slope leading to a clear distinction between the no-template/DNA control from samples that contain DNA that generate a positive slope. Based on these results, further tests were performed with DNA in buffer solution at concentrations greater than 10 ng/µl. Since the lower excitation frequencies performed better at distinguishing samples with varying DNA amounts, the lower four frequencies (10 kHz, 50 kHz, 100 kHz, and 250 kHz) were chosen to form a quantification score.
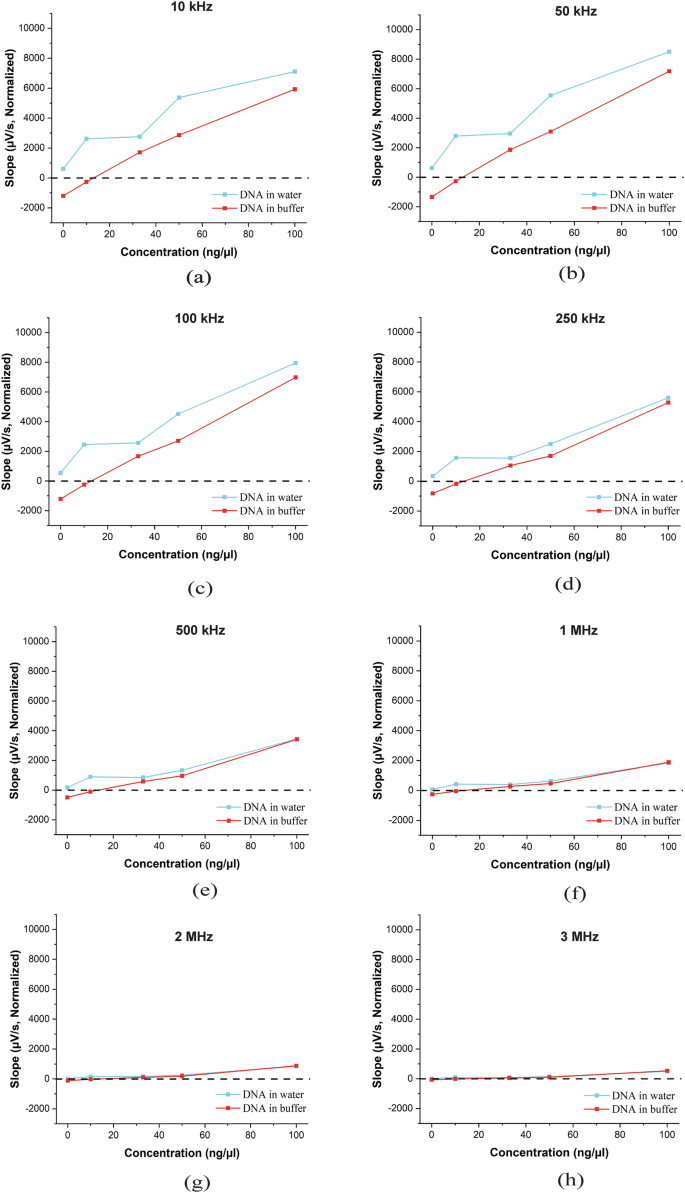
Impedance response for DNA concentrations of 100, 50, 33, 10, and 0 ng/μl in water and buffer was measured at excitation frequencies of (a) 10 kHz, (b) 50 kHz, (c) 100 kHz, (d) 250 kHz, (e) 500 kHz, (f) 1 MHz, (g) 2 MHz, and (h) 3 MHz.
Testing clinical samples for TTR V142I
Based on results in the assay validation, analysis of clinical samples was performed by eluting the DNA in buffer solution. DNA samples from six patients were tested, including four heterozygous for the TTR V142I variant and two negative samples. The data obtained from the slopes of the negative control (no-template DNA) and positive patient samples were used to generate a quantitative score. Each sample was analyzed in duplicate, with both replicates subjected to gel electrophoresis and microfluidic impedance cytometry for further validation. TTR V142I genotyping results for six patient samples using agarose gel electrophoresis and the DNA quantification score calculated from the impedance output responses are shown in Fig. 4. Each sample was tested for the ancestral and the variant allele for TTR V142I. The genotyping results from both detection methods were consistent with the known genotypes in all six samples. Patients 1 through 4 are heterozygous for the variant and the wildtype allele. Notably, the DNA quantification score corresponded well with the actual DNA concentrations in each sample. This is in line with our previous observations where we evaluated the response for different DNA concentrations and compared them to the negative control. Patients 5 and 6 are homozygous reference with a DNA quantification score for the variant allele being similar to that of the negative control sample. These results demonstrate the ability of electrical impedance to correctly identify the TTR V142I genotype.
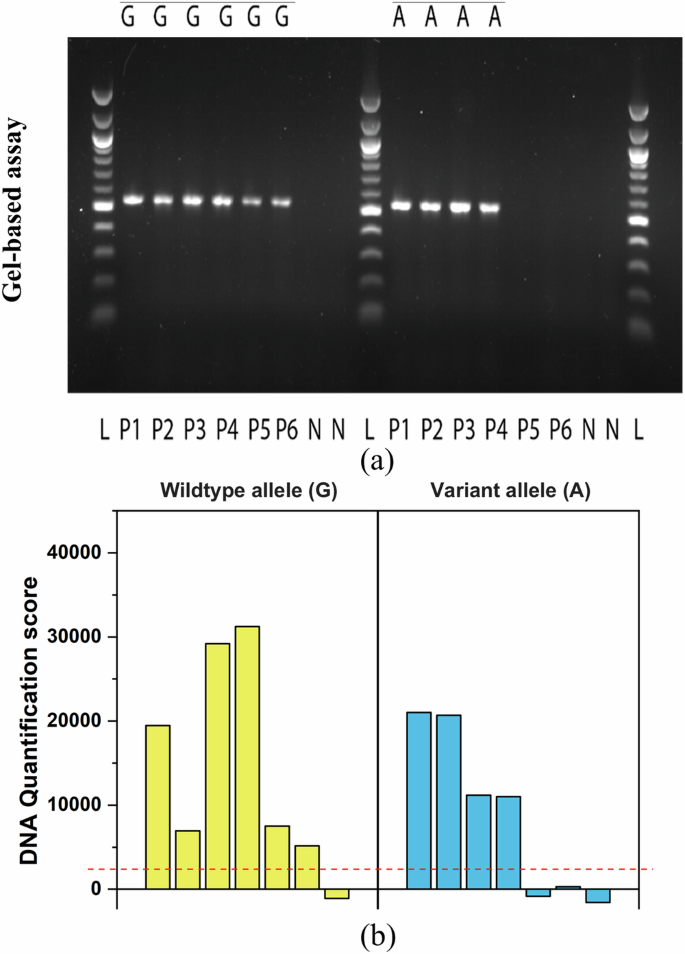
Allele-specific PCR was performed to detect the wildtype (G) and variant (A) alleles of the TTR c.424G>A variant (V142I), with results analyzed by agarose gel electrophoresis (a) and electrical impedance (b). An uncropped agarose gel image is provided in Supplementary Fig. 3. Among the six patients tested, four (P1–P4) were heterozygous (G/A) for V142I, while two (P5 and P6) were homozygous for the reference allele (G/G). Negative control samples (N) showed no amplification. The 100 bp DNA ladder (L) is included for reference. The red dotted line represents the detection threshold for DNA.
Discussion
We present a method for electrical genotyping of known DNA variants by combining allele-specific polymerase chain reaction (ASPCR) and microfluidic impedance cytometry at different excitation frequencies. Using passive flow of PCR products in solution passing the gold electrodes in a microfluidic channel, the amount of DNA can be accurately quantified using impedance-based electrical detection. We observed a direct correlation between the gradual impedance change and DNA concentrations. In our experiments investigating impedance response across eight different frequencies, we identified an optimal frequency range for detection of DNA fragments (538 bp) at the lower end of the spectrum, between 10 and 250 kHz. Building upon these findings, we devised a robust DNA quantification score that consolidates impedance measurements from four frequencies within this range. We also assessed the efficacy of microfluidic impedance cytometry for DNA eluted in water and buffer, identifying differences between these solutions and demonstrating that varying DNA concentrations in buffer are more readily distinguishable. We conducted a proof of concept, emphasizing the application of this technology for detecting a prevalent point mutation in the transthyretin gene (V142I). We found that TTR V142I genotypes identified in six patients (four heterozygous, two wildtype) using electrical impedance were 100% concordant with results from gel electrophoresis and gene sequencing.
Impedance-based detection of DNA molecules in solution has been documented, yet previous studies did not distinguish between different sequences23. In prior work, we reported on multifrequency impedance spectroscopy for the quantification and sizing of DNA fragments24. This method required linking PCR products to paramagnetic beads, resulting in higher cost and experimental complexity, and thus limiting its feasibility in low-income settings. Accordingly, this study focused on the direct detection of specific DNA fragments in solution using label-free impedance-based technology. However, several limitations must be acknowledged. First, the current approach requires approximately 5 µl of a 10 ng/ul concentration per sample. This requires multiple rounds of PCR amplification, which increases the overall cost and TAT of the assay. In comparison, the previous assay using PCR products coupled to beads required only 0.15 ng DNA per 500 beads tested for a similar sized product. A potential solution to increase the sensitivity for DNA detection is to shrink the sensing region of the sensor. This will lead to a relatively higher local DNA concentration resulting in a larger change in impedance. Another approach to increase sensitivity is by employing different channels and multiple electrodes. This will effectively increase the signal to noise ratio due to an increase in the size of the analyte relative to the total sensing region. A second limitation is the high cost of gold in the current design and the need for reusability of the chip. Gold was selected as the electrode material and PDMS as the channel material due to their suitability for rapid prototyping and proof-of-concept development. However, because the test relies on high-frequency impedance sensing and primarily measures the buffer’s conductivity rather than electrode surface impedance, the use of gold is not essential. As we transition to scaling up and manufacturing, we aim to investigate more affordable alternatives, such as indium tin oxide, for the electrodes. Furthermore, implementing techniques such as laser patterning, which support the fabrication of low-cost microfluidic electrochips, can substantially lower production costs and enable the development of fully disposable chips. A third limitation for using this assay in resource-limited settings is the need for a benchtop impedance measurement spectroscope. To deploy this technology in field settings, we must ensure it is both economically viable and sufficiently portable to enhance its accessibility. Interestingly, there exists a precedent for miniaturizing the electronics for the lock in amplification25,26, which could be adapted for use with our application for detecting common pathogenic TTR variants. Replacing the gel electrophoresis readout with an electronic DNA detector provides an opportunity for further development of a point-of-care tool for cardiac amyloidosis testing. For example, in combination with point-of-care ultrasound echocardiography such as the iPhone-based Butterfly iQ system to measure left-ventricular thickness, ejection fraction, and diastolic function, companion digital genotyping of TTR V142I could provide an inexpensive point-of-care screening for ATTR patients with global opportunities in resource-constrained settings. Although we focused on TTR V142I in this study, our method has the potential to be adapted and scaled to include other pathogenic variants. The capacity to produce multiple chips on a single wafer at low cost and high precision offers an avenue for enhancing the scalability of this technology and expand its utility in multiplex electrical genotyping applications.
Materials and methods
DNA sample preparation
Allele-specific PCR amplification was performed using oligonucleotide primers designed to selectively amplify the ancestral and variant allele of TTR c.424G>A (p.Val142Ile). The primers used are: TTR-424G (CATTCCTTGGGATTGGTTAC, 0.5 µM final concentration), TTR-424A (CATTCCTTGGGATTGGTTAT, 0.5 µM final concentration) and a common forward primer TTR-424F (TGGGAAGAATGTTTCCAGCTC, 0.5 µM final concentration). The ASPCR product length for both amplicons is 538 bp. We previously validated this assay using 100 whole blood samples from individuals with clinically defined cardiovascular disease in collaboration with 54gene, Lagos, Nigeria13. The assay successfully identified the TTR wildtype in all 100 samples and detected the TTR V142I variant in 2 of the 100 samples. These results were confirmed by genome sequencing, demonstrating that this rapid TTR assay achieves 100% sensitivity and 100% specificity for both WT and variant TTR in the tested African population. In this project, we studied residual clinical specimens from four patients heterozygous for TTR V142I, two samples negative for this variant and two no-template control samples. The TTR V142I variant in these specimens was previously identified and documented in accordance with clinical genetic testing protocols. All samples were amplified under the same PCR conditions and amplification products were inspected on a 1.5% agarose gel (Supplementary Fig. 3). PCR products were purified using a QIAquick PCR purification kit (Qiagen Inc.) following manufacturer’s recommendations. The purified PCR products were eluted either in water or elution buffer and quantified using the Qubit 3 fluorometer as per the manufacturer’s recommendations. Aliquots for each sample were run on the Agilent bioanalyzer to ensure sample purity and removal of primer dimers (Supplementary Fig. 4). Samples were prepared at an approximate final concentration of 100 ng/µl. This study was approved by the Institutional Review Board at Yale University (protocol 2000030340).
Microfluidic chip fabrication
The microfluidic chip has embedded gold electrodes and is built of PDMS on a glass surface. Patterning and creating the electrodes on the glass wafer is the initial stage in creating the microfluidic chip. A 3′′ fused silica wafer is used to manufacture electrodes on glass using conventional photolithography. The steps in the procedure include lift-off processing, electron beam metal evaporation, and photo-patterning resist on the fused silica wafer27. Wafer cleaning, spin coating of the photoresist, soft baking of the resist, exposure to ultraviolet light via a chromium mask printed on a 4 by 4 glass plate, development of the resist, and hard baking of the resist are all steps in the photo-patterning process. After photo patterning, an electron beam evaporation technique deposits a 100-nm-thick coating of gold on the substrate. For better gold adherence to the glass wafer, a 10-nm coating of chromium is utilized; otherwise, the gold film is readily torn off. Due to its inertness and resistance to corrosion, gold was selected as the electrode. The electrodes were 20 µm wide, with a 15 μm gap between each electrode. Using soft lithography, we created the microfluidic channel in PDMS (Poly-dimethyl siloxane)28,29,30. On a 3′′ silicon wafer that serves as a master mold, a layer of SU-8 was patterned. Standard cleaning, spin coating, soft baking, exposure, development, and hard baking are all steps in the SU-8 photo-patterning process. Following the creation of the master mold, PDMS (10:1 prepolymer/curing agent) was applied to the master mold, which was then baked at 80 °C for two hours to cure it. Then, the PDMS channel was separated from the mold. The entrance and outflow were then formed by punching two holes, one measuring 5 mm and the other 3 mm. After both substrates had received oxygen plasma treatment, the PDMS substrate was then positioned and adhered to the electrode chip. The irreversible bond was then created by baking the chip for 40 min at 70 °C. Our microfluidic channel was 20 µm wide and 15 µm tall.
Multifrequency impedance spectroscopy
The microfluidic chip with the integrated gold electrodes is treated with air plasma at 800 mTorr for 90 s to make the microfluidic channel hydrophilic. The gold electrodes on the chip are connected to a commercial benchtop impedance spectroscope (Zurich Instruments, HF2IS) by passing the signal through a programmable commercial transimpedance amplifier (Zurich Instruments, HF2TA). The impedance spectroscope can operate at up to 8 multiple excitation frequencies. The electrical parameters chosen for the impedance spectroscope are presented here. The frequencies chosen for these experiments were chosen in the range of 10 kHz to 3 MHz, with the specific frequencies as 10 kHz, 50 kHz, 100 kHz, 250 kHz, 500 kHz, 1 MHz, 2 MHz, 3 MHz respectively. The excitation voltage has a direct correlation with the demodulated signal, which means the higher the excitation voltage, the higher the demodulated signal. However, it was found through experimentation that at 8 excitation frequencies, a high voltage damages the electrodes. Hence, 1 V was chosen as the excitation voltage level for each of the 8 frequencies. Since we are trying to measure a gradual change in the impedance due to the change in the solution resistance and the dielectric capacitance due to the presence of DNA in solution, we set the cut-off frequency of the low-pass filter of the impedance spectroscope to 7 Hz. A transimpedance gain of 1 kV/A was selected for the programmable transimpedance amplifier (Zurich Instruments, HF2TA).
Experimental protocol
5 µl DI water is injected into the microfluidic channel and the baseline signal is observed on the graphical user interface for the commercial impedance spectroscope. The interface provides a real-time measurement result for the demodulated signal in the form of baseline voltage. Once the baseline voltage is stabilized and any transient changes die down, the demodulated signal is recorded for 120 s. After 120 s, the sample to be tested (5 µl) is pipetted in the inlet of the microfluidic sensor. The data is then recorded for 600 s, bringing the total experiment time for a single experiment to approximately 720 s. All experiments are performed in the Faraday cage to prevent any electromagnetic interference from the environment.
Data analysis
The data is recorded from the commercial benchtop impedance spectroscope (Zurich Instruments, HF2IS) and is stored in.csv files in a spreadsheet format on a personal computer. The data analysis is done offline on the personal computer after the dataset has been recorded. We use code developed in MATLAB, R2021b, for the data analysis. The impedance data recorded from the sensor is in an I (in-phase) and Q (quadrature) format in the form of voltage. The I and Q channels are squared and added together to obtain the magnitude of the recorded data. The dataset is inspected such that the baseline is stable for the first 2 min when there is only DI water in the microfluidic chip. Once the data has been inspected, we perform the analysis, which comprises a normalization step followed by a linear regression to compute the slopes of the latter part of the measurement. The data is normalized according to the mean of the first 120 s of the baseline voltage. Then, we only consider the multifrequency data after the initial 300 s have passed. A linear regression is performed on this part of the dataset and the slopes are computed for the straight lines that are fitted through the data. These slopes are significantly higher for the samples containing DNA than that of the negative control, where no DNA is present. Additionally, we developed a DNA quantification score to interpret the results from the impedance-based sensor. Our observations indicate that lower frequencies contribute more significantly to the impedance differences between DNA-containing solutions and negative controls. Therefore, we combined the slopes from the four lowest frequencies (10 kHz, 50 kHz, 100 kHz, and 250 kHz) to determine the presence of DNA in the solution.
Reporting summary
Further information on research design is available in the Nature Portfolio Reporting Summary linked to this article.


Responses