Along-tract white matter abnormalities and their clinical associations in recent-onset and chronic schizophrenia

Introduction
Schizophrenia is a chronic mental disorder that typically emerges in early adulthood, often in the early 20s1. Structural abnormalities in the white matter of the brain have been extensively reported in patients with schizophrenia2. A large-scale study demonstrated that these abnormalities are not confined to specific white matter tracts but are observed across multiple tracts, with differences from healthy controls often exhibiting small effect sizes3. The brain comprises several major white matter tracts, each associated with specific functions or sets of functions4,5. Schizophrenia is characterized by a wide range of clinical symptoms, including hallucinations, delusions, negative symptoms, and cognitive impairments. Although some studies have reported associations between white matter structural abnormalities and clinical symptoms of schizophrenia6,7, findings have been inconsistent, and reproducibility remains limited8,9. These mixed results may be attributed to the biological heterogeneity among schizophrenia diagnoses, variability in the clinical characteristics of study participants, and differences in imaging analysis methods.
There is substantial evidence supporting the biological heterogeneity within the diagnosis of schizophrenia10,11,12; however, how this heterogeneity relates to clinical symptoms and outcomes remains unclear. Various criteria have been employed to categorize patients with schizophrenia, including response to antipsychotic treatment13, duration of illness14, and patterns of clinical course15. Given the typical course of schizophrenia1, patients can be classified as recent-onset or chronic using a five-year threshold since onset. This classification is supported by prior studies indicating that the first five years following onset represent a critical period for determining long-term prognosis16. This framework implies that diverse clinical presentations may be observed within the first five years after onset, whereas beyond this window, clinical variability may diminish, leading to more stable functional outcomes. This framework also suggests that recent-onset and chronic groups may exhibit distinct biological characteristics, such as differences in white matter abnormalities. Categorizing patients into recent-onset and chronic groups may offer valuable insights into the relationship between white matter abnormalities and clinical symptoms rather than analyzing the entire patient population as a single group.
Numerous studies have employed diffusion-weighted MRI (dMRI)17 with voxel-based analysis18 or tractography algorithms19 to investigate the white matter of the brain in vivo. Tractography generates tractograms, which are digitally represented as streamlines. Streamlines with similar shapes and trajectories that travel together through the white matter are grouped into bundles. These bundles, representing white matter pathways that connect different regions of the brain, are commonly referred to as tracts or fasciculi. By integrating diffusion indices such as fractional anisotropy (FA), tractography has been extensively employed to investigate white matter abnormalities in various clinical populations, including patients with schizophrenia2. In most previous studies, diffusion indices are averaged across each white matter tract and then used for statistical analysis. However, diffusion measurements can vary significantly along the trajectory of a tract20. This variability may result from crossing fibers, which reduce FA at tract intersections, or differences in neural populations along the tract, where axons enter or exit at various points. Averaging diffusion indices across an entire tract may obscure important localized alterations21, as changes in a tract’s mean value could either indicate consistent abnormalities throughout the tract or be driven by focal changes to specific regions along its trajectory.
Voxel-based analysis is one method for investigating localized abnormalities in the white matter of the brain. However, this method lacks sufficient precision owing to the substantial variability in the shape of long-range fiber tracts across subjects21. Tract-Based Spatial Statistics (TBSS) may offer some improvement over traditional voxel-based approaches through the utilization of tract skeletons18. Nevertheless, similar to other voxel-based methods, TBSS cannot guarantee that a given voxel corresponds to the same tract across participants22. Tractometry is one of the several methods that examine group differences along the trajectory of white matter tracts21,23,24. Static tractometry involves resampling streamlines into “n” evenly spaced points21. However, this method can cause blurring of segments, leading to reduced precision. Centerline tractometry, proposed by Chandio et al. 25, addresses this limitation by minimizing parcel misalignment among individual streamlines, offering a more accurate assessment of white matter tracts.
This study examined along-tract abnormalities in the white matter and their associations with clinical symptoms in patients with schizophrenia. White matter abnormalities along tract trajectories were analyzed using the centerline tractometry method. The schizophrenia group was further divided into recent-onset and chronic subgroups to investigate the relationship between clinical symptoms and white matter abnormalities within each subgroup. We aimed to identify neuroimaging biomarkers for clinical symptoms in these patient groups by detecting localized white matter abnormalities that may be obscure when employing averaged diffusion indices in statistical analyses.
Materials and methods
Study population
Data were combined from three distinct cohorts recruited at Asan Medical Center, a university-affiliated hospital. The first cohort (AMC 1) consisted of 49 patients with recent-onset schizophrenia and 24 healthy controls. The second cohort (AMC 2) included 7 patients with recent-onset schizophrenia, 20 with chronic schizophrenia, and 55 healthy controls. The third cohort (AMC 3) comprised 52 patients with chronic schizophrenia. Three participants enrolled in more than one cohort were excluded. Patients with schizophrenia were categorized based on an illness duration of five years, classifying them as either having recent-onset schizophrenia or chronic schizophrenia14. After combining the three cohorts and excluding patients with inadequate image quality for downstream analyses based on visual inspection, the final study population consisted of 77 healthy controls, 55 patients with recent-onset schizophrenia, and 69 patients with chronic schizophrenia.
Neurocognitive performance and psychiatric symptoms were measured using different tools across the cohorts. For participants in the AMC 1 and AMC 3 cohorts, the severity of psychiatric symptoms was assessed using the Positive and Negative Syndrome Scale (PANSS)26, and Full-Scale Intelligence Quotient (FSIQ) and Memory Quotient (MQ) scores were collected. The Global Assessment of Functioning (GAF) scale27 was used to assess the global functioning of patients with schizophrenia. Information on antipsychotic medications was collected, and the daily olanzapine equivalent dose was calculated using the validated conversion equations28,29. Participants in the AMC 2 cohort were evaluated using the Cogstate Brief Battery30, which focuses exclusively on cognitive function. We did not obtain FSIQ and MQ scores for participants in the AMC 2 cohort owing to the absence of validated conversion equations from the Cogstate battery to FSIQ and MQ. Additional details about each cohort are provided in the Supplementary Material.
The authors assert that all procedures contributing to this work comply with the ethical standards of the relevant national and institutional committees on human experimentation and with the Helsinki Declaration of 1975, as revised in 2008. All subjects provided written informed consent before enrollment. The present study was approved by the Institutional Review Board (IRB) of the Asan Medical Center (IRB approval no. 2021-1128).
Image acquisition, preprocessing, and analysis
Information on scanners and acquisition parameters for the dMRI scans is presented in Supplementary Table 1. Rigorous visual inspections were performed on all dMRI scans to ensure adequate image quality, with only those meeting the quality standards included in the final study population.
The dMRI scans in the AMC 1 cohort were resampled to a 2 × 2 × 2 mm3 voxel size using Slicer v4.431 because of the original voxel size of 2 × 2 × 3 mm3. Preprocessing of the dMRI was conducted using MRtrix32 and FSL33. The following steps were applied: (1) noise level estimation and denoising34; (2) removal of Gibbs ringing artifacts35; (3) correction for eddy current and inhomogeneity distortion36,37; and (4) bias field correction38. Brain masks were created using FSL BET39. We used the mean framewise displacement (FD) to evaluate in-scanner head motion among participants. Although no participant had an average FD exceeding 0.5, we observed significant differences in the mean FD across the groups (F = 10.274, p < 0.001), with the chronic schizophrenia group exhibiting a higher mean FD compared to the control group (p = 0.002). Tensors and FA maps from the preprocessed images, generated using MRtrix40, were used for rigid registration and resampling to the MNI-space FA template (FMRIB58 FA 1 mm) via FSL FLIRT41. Constrained spherical deconvolution was performed to extract the three principal fiber directions (peaks), employing the Dhollander algorithm to deconvolve the fiber orientation distributions. These peaks were used as input for TractSeg42, which conducted tract segmentation, identified tract start- and end-region segmentations, and created tract orientation maps and tractograms for each white matter tract with a fiber count of 10,000 per tract.
From a total of 72 white matter tracts, 22 were excluded owing to inconsistent segmentation across subjects, following the guidelines on the website (https://github.com/MIC-DKFZ/TractSeg), and five cerebellar tracts owing to a limited field of view. Consequently, tractometry was not performed for the following tracts: commissure anterior, corpus callosum (all), fornix, inferior cerebellar peduncle, middle cerebellar peduncle, middle longitudinal fascicle, striato-occipital, striato-parietal, striato-postcentral, striato-precentral, striato-prefrontal, superior cerebellar peduncle, thalamo-precentral, and thalamo-prefrontal.
Centerline tractometry was performed following the methodology described by Chandio et al. 25. Tractometry involves evaluating the parameter map of interest along the points of individual fibers, with each value assigned to one of the n parcels based on its position. The parameters of interest were FA and the length of the peak. The peaks were generated using constrained spherical deconvolution, a widely used method for creating fiber orientation densities from dMRI data43. This method offers an advantage over the diffusion tensor model, particularly in addressing the limitations of crossing fibers. Fiber orientation densities represent estimates of the amount of diffusion in each of the three orthogonal directions. For each voxel, we selected three peaks in the fiber orientation densities and used the length of the peak most similar to the direction of the individual bundle at that voxel. To account for variability due to different scanners and image parameters across the cohorts, neuroCombat44, an adaptation of the ComBat harmonization method45, was utilized to mitigate batch effects on the FA and peak length, with covariates of group, age and sex included. Each tract was divided into 100 parcels, as described in previous studies25,42. The values within each parcel were averaged, producing a vector of values along the tract for subsequent analysis. In centerline tractometry, each value at a streamline point is assigned to the nearest point on a tract centerline composed of n points, with the parcel ID determined by the position of the corresponding closest point on the centerline.
Statistical analysis
All statistical analyses were conducted using the R software (version 4.2.1; R Development Core Team, Vienna, Austria). Statistical significance was set at an alpha value of < 0.05. Group differences in continuous variables were assessed using t-tests or analysis of variance (ANOVA), as appropriate, while chi-square tests were used to evaluate group differences in categorical variables.
Group comparisons of FA and peak length in each bundle were performed following the linear mixed model described by Yeatman et al. 21. We tested whether patients with recent-onset schizophrenia or those with chronic schizophrenia exhibited significant group differences in FA or peak length in white matter tracts compared to healthy controls. White matter tracts were categorized as association, commissural, or projection tracts. To account for multiple comparisons, alpha values were adjusted using the Bonferroni correction, accounting for the number of fascicles within each category and the number of parcels per bundle. Age, sex, and the mean FD were included as covariates in the linear mixed models for group comparisons to account for the impact of in-scanner head motion on structural connectivity46.
For clinical associations of white matter abnormalities, FA and peak length values were averaged across the points within the bundles where significant group differences were observed in each patient group. Clinical variables included PANSS positive, PANSS negative, PANSS general, PANSS total, GAF, FSIQ, MQ scores, daily olanzapine equivalent dose, and duration of illness. Associations with clinical variables were evaluated using Spearman’s rho, with multiple tests corrected using the Benjamini–Hochberg false discovery rate (FDR) set at q < 0.05 for the number of clinical variables (n = 9).
Results
Demographic and clinical characteristics of the study population
Table 1 presents the demographic and clinical characteristics of the study population. A significant group difference in age was observed across the groups (F = 17.52, p < 0.001), while the proportion of males did not differ significantly. No significant differences were observed between the recent-onset and chronic schizophrenia groups in PANSS positive, negative, general, or total scores. Patients with chronic schizophrenia exhibited significantly higher GAF scores (63.4 ± 10.8) compared to those with recent-onset schizophrenia (44.1 ± 14.3, t = 6.13, p < 0.001). FSIQ scores differed significantly across the groups (F = 32.06, p < 0.001), with healthy controls achieving higher scores (120.1 ± 9.2) than both the recent-onset (96.7 ± 15.6) and chronic schizophrenia groups (90.7 ± 16.5). There was a significant difference in MQ scores across the groups (F = 30.25, p < 0.001), where the chronic schizophrenia group (73.8 ± 15.8) had lower MQ scores than the recent-onset (83.4 ± 21.0) and control groups (109.4 ± 11.9). No significant difference in the daily olanzapine equivalent dose was observed between the two patient groups.
Group differences in FA and peak length of white matter tracts
Supplementary Figs. 1–4 illustrate the results of group comparisons of FA and peak length in white matter tracts between healthy controls and patients with recent-onset or chronic schizophrenia.
Patients with recent-onset schizophrenia did not demonstrate any significant differences in FA of association and projection tracts compared to healthy controls. However, significantly lower FA was observed in the genu and splenium of the corpus callosum in patients with recent-onset schizophrenia relative to healthy controls (Fig. 1). For peak length, significant increases or decreases were identified in recent-onset schizophrenia in the following tracts: left inferior longitudinal fasciculus, genu, rostral body, anterior midbody of the corpus callosum, left thalamo-occipital tract, right superior thalamic radiation, and left optic radiation.

a Fractional anisotropy (FA), b Peak length. The blue and orange lines indicate the control and patient groups, respectively. The rising red lines indicate significant group differences in diffusion indices at specific points along the white matter tracts. Below each plot, we provide the alpha FWE threshold used for statistical significance, along with the lowest p-value and corresponding t-value for the group differences within the tract. FA fractional anisotropy, CC corpus callosum, ILF inferior longitudinal fascicle, T_OCC thalamo-occipital, STR superior thalamic radiation, OR optic radiation.
In patients with chronic schizophrenia, widespread FA reductions were observed across association, commissural, and projection tracts (Fig. 2). Regarding peak length, significant deviations (increases or decreases) were identified in the following tracts: the left cingulum, left inferior longitudinal fasciculus, left superior longitudinal fasciculus I, II, and III, isthmus and splenium of the corpus callosum, right thalamo-premotor tract, left thalamo-parietal tracts, right anterior thalamic radiation, left and right optic radiation, left corticospinal tract, left and right fronto-pontine tract, and left parieto-occipital pontine tract.
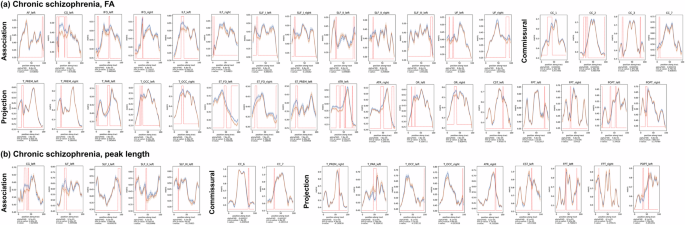
a Fractional anisotropy (FA), b Peak length. The blue and orange lines indicate the control and patient groups, respectively. The rising red lines indicate significant group differences in diffusion indices at specific points along the white matter tracts. Below each plot, we provide the alpha FWE threshold used for statistical significance, along with the lowest p-value and corresponding t-value for the group differences within the tract. FA fractional anisotropy, AF arcuate fascicle, CG cingulum, IFO inferior occipito-frontal fascicle, ILF inferior longitudinal fascicle, SLF superior longitudinal fascicle, UF uncinate fascicle, CC corpus callosum, T_PREM thalamo-premotors, T_PAR thalamo-parietal, T_OCC thalamo-occipital, ST_FO striato-fronto-orbital, ST_PREM striato-premotor, ATR anterior thalamic radiation, OR optic radiation, CST corticospinal tract, FPT fronto-pontine tract, POPT parieto-occipital pontine.
Clinical associations of FA and peak length of white matter tracts
Supplementary Tables 2 and 3 present the results of associations between white matter parameters and clinical variables in patients with recent-onset and chronic schizophrenia, respectively. Significant clinical associations were observed for the FA of commissural tracts in recent-onset schizophrenia and the peak length of projection tracts in chronic schizophrenia (Fig. 3).
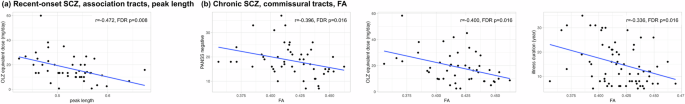
a Peak length of association tracts in recent-onset schizophrenia, b FA of commissural tracts in chronic schizophrenia. Association tracts with significant group differences in peak length in recent-onset schizophrenia included the left inferior longitudinal fascicle. Commissural tracts with significant FA differences in chronic schizophrenia included the rostrum, genu, rostral body, and splenium of the corpus callosum. Averaged values across segments within white matter tracts were used for clinical correlations. FA fractional anisotropy, PANSS positive and negative syndrome scale, OLZ olanzapine, FDR false-discovery rate.
In patients with recent-onset schizophrenia, the peak length of association tracts showed a negative association with the daily olanzapine equivalent dose (rho = −0.472, FDR p = 0.008). In patients with chronic schizophrenia, the FA of commissural tracts showed a negative association with the PANSS negative score (rho = −0.396, FDR p = 0.016), the daily olanzapine equivalent dose (rho = −0.400, FDR p = 0.016), and duration of illness (rho = −0.336, FDR p = 0.016). Figure 4 displays the reconstructed white matter tracts with the significant associations with clinical variables.
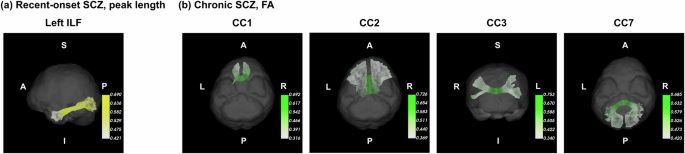
a Association tracts with significant associations of peak length with antipsychotic dose recent-onset schizophrenia, b Commissural tracts with significant associations of FA with the severity of negative symptoms, antipsychotic dose, and duration of illness in chronic schizophrenia. White matter tracts were reconstructed using diffusion-weighted MRI data of a healthy control in the AMC 1 cohort. The averaged value of FA or peak length was displayed in white matter tracts across the control and patient groups. Brighter colors depict higher values of FA or peak length. Abbreviations: SCZ schizophrenia, FA fractional anisotropy, CC corpus callosum, ILF inferior longitudinal fascicle.
Discussion
This study investigated structural impairments in white matter tracts using dMRI in patients with schizophrenia and explored their associations with clinical symptoms. FA and peak length were employed as diffusion measures, and instead of averaging values for each tract, diffusion measures were calculated at individual points along the trajectory of tracts. This approach enabled the localization of specific abnormalities in white matter tracts, addressing the limitations of traditional methods that rely on averaging diffusion measures. In the recent-onset schizophrenia group, reduced FA was localized to the genu and splenium of the corpus callosum, highlighting early impairments in the commissural structure necessary for communication between both hemispheres. In the chronic schizophrenia group, FA reductions were identified across multiple white matter tracts, highlighting the effect of disease progression on the structural components. In both patient groups, changes in peak length were also identified in various white matter tracts. Furthermore, in the recent-onset schizophrenia group, the peak length of association tracts showed a negative correlation with antipsychotic dose. In the chronic schizophrenia group, the FA of commissural tracts was negatively correlated with PANSS negative score, antipsychotic dose, and illness duration.
We observed reduced FA in the genu and splenium of the corpus callosum in recent-onset schizophrenia and widespread abnormalities across multiple white matter tracts in chronic schizophrenia. These findings align with those of previous studies reporting alterations in the corpus callosum in first-episode or recent-onset schizophrenia47,48,49. Similarly, our observations of widespread white matter abnormalities in chronic schizophrenia are consistent with earlier research2,3. The results indicate more severe and extensive white matter abnormalities in chronic patients compared to those with recent-onset schizophrenia, as has been reported in earlier studies9,50. This pattern may suggest that structural abnormalities in white matter originate from specific corpus callosum regions and progressively extend to various white matter regions as the illness progresses. However, caution is warranted in interpreting these results owing to the cross-sectional design of this study. Longitudinal follow-up studies with adequate statistical power are needed to provide a clearer understanding of the progression of these abnormalities.
In both patient groups, significant alterations in peak length were observed across multiple white matter tracts. However, no consistent pattern of changes in peak length was observed in the group comparisons, with results showing both increases and decreases depending on the specific white matter tract or patient group. Peak length offers notable advantages over FA as a diffusion metric, particularly owing to its enhanced sensitivity to crossing fibers, which constitute up to 90% of the brain’s white matter51. Despite its utility in capturing microstructural alterations, interpreting variations in peak length remains challenging, largely owing to the complex geometric organization of white matter tracts in the brain. The substantial presence of crossing fibers underscores the dynamic nature of axonal connections, with fibers converging and diverging at various points along tracts to establish communication between cortical and subcortical regions. Although peak length reflects the directionality of fiber bundles at the voxel level, it remains unclear whether increases or decreases in peak length signify structural impairments. Interpreting changes in peak length relative to FA could provide valuable insights. However, our findings showed that significant group differences in FA and peak length occurred at different locations within the same white matter tracts, complicating biological interpretation. Peak length may reveal microstructural changes with greater sensitivity compared to measures derived from the diffusion tensor model. However, this explanation does not hold when significant FA reductions occur without corresponding changes in peak length. Similar to other diffusion measures, peak length may reflect neuroinflammation in white matter tracts in schizophrenia, including microglial activation, increased neural density, and reduced astroglial density in white matter52. Further investigations are warranted to elucidate the biological significance of peak length as a marker of white matter integrity in schizophrenia.
We examined the associations between FA and peak length of white matter tracts and clinical symptoms in schizophrenia. In recent-onset schizophrenia, significant correlations with clinical symptoms were observed in the peak length of association tracts. In contrast, in chronic schizophrenia, significant associations were found between clinical symptoms and the FA of commissural tracts. Previous studies have reported associations between structural abnormalities of commissural tracts and clinical symptoms in chronic53 schizophrenia. Compared to earlier studies with similar findings, our findings are noteworthy for highlighting clinical associations between corpus callosum abnormalities and multiple dimensions of symptoms, including negative symptom, antipsychotic dose, and illness duration. Regarding the associations between diffusion measures, antipsychotic dose, and illness duration, the cross-sectional design of our study should be considered when interpreting these findings. Longitudinal studies are necessary to provide confirmatory evidence, especially given the inconsistent findings reported in previous research3,8,54,55. We determined diffusion indices at specific segments of white matter tracts to localize and incorporate structural abnormalities, potentially uncovering clinical associations that may be obscured by traditional approaches. Our findings suggest the utility of the tractometry approach in applying dMRI. This aligns with a previous study by Chamberland et al., which proposed a tractometry-based anomaly detection framework using deep autoencoders for various clinical populations, including children and adolescents with copy number variants, epilepsy, and schizophrenia.
We identified localized changes in white matter tracts across association, commissural, and projection categories in patients with recent-onset and chronic schizophrenia. The clinical associations of white matter abnormalities observed in each group highlight the potential utility of the tractometry approach in schizophrenia research using dMRI analysis. However, several limitations must be considered when interpreting our findings. First, this study combined data from three different cohorts, each recruited using distinct scanners and imaging parameters. Although harmonization methods were applied to standardize the datasets, this variability remains a potential source of bias. The unbalanced group distribution across cohorts may have particularly influenced the harmonization process in modeling differences between healthy controls and chronic schizophrenia. This could have contributed to an increased risk of type I errors and should be considered when interpreting the results. Second, the number of clinical variables was limited owing to the integration of three separate cohorts into a single test dataset. A more comprehensive assessment of psychiatric symptoms and neurocognitive functions may better elucidate the clinical implications of white matter abnormalities in recent-onset and chronic schizophrenia. Third, although we examined the associations between diffusion measures and antipsychotic dose, the potential effects of psychotropic medications on white matter tracts were not comprehensively accounted for in this study. Structural changes in white matter observed in the patient groups may reflect the influence of antipsychotic medications, the disease itself, or both, as suggested by prior studies56,57. This controversial issue8,58 should be considered in the interpretation of our findings. Fourth, we did not include obesity and smoking in the analyses due to limited data availability. Previous studies have reported the impacts of obesity59 and smoking60,61 on white matter tracts. Our results should be interpreted with caution, considering the potential confounding effects of these variables, given the high prevalence of obesity62 and smoking63 among patients with schizophrenia. Finally, the cross-sectional design of this study limits the ability to infer causal relationships. Longitudinal studies are warranted to deepen our understanding of structural impairments in white matter tracts, particularly regarding the impact of illness duration.
This study identified along-tract white matter abnormalities in recent-onset and chronic schizophrenia using dMRI and centerline tractometry. In recent-onset schizophrenia, deviations in peak length were identified across multiple white matter tracts, with those in association tracts showing a negative correlation with antipsychotic dose. In chronic schizophrenia, widespread FA reductions were observed across multiple white matter tracts, and the FA of commissural tracts was negatively correlated with the PANSS negative score, antipsychotic dose, and illness duration. These findings suggest distinct patterns of white matter abnormalities between recent-onset and chronic patient groups and highlight the utility of localized measurements along tract trajectories in uncovering clinically meaningful associations. Further research is needed to validate these findings, examine the progression of white matter changes, and explore their implications for the pathophysiology and clinical management of schizophrenia.


Responses