Altered brain dynamics of facial emotion processing in schizophrenia: a combined EEG/fMRI study

Introduction
Face processing and the recognition of affect/emotions are instrumental for nonverbal social communication. A substantial body of evidence indicates that individuals with schizophrenia (ISZ) exhibit alterations in the processing of facial information1,2 that contribute to the social dysfunctions observed in schizophrenia3. These deficits manifest early, can already be observed in first-episode and early-onset psychosis4, and even prior to the onset of schizophrenia5. Moreover, impairments in facial affect recognition contribute substantially to poor clinical and functional outcomes6,7,8.
While alterations related to both facial emotion processing and general face processing in ISZ have been well-established9,10,11, the exact neural mechanisms that underlie aberrant face processing are not entirely understood. Research on the neural substrates of affective emotional face stimuli primarily focused on the limbic system and, in accordance, indicated attenuated activation in this system (e.g., in the amygdala), especially in response to fearful/threatening faces in schizophrenia12,13,14,15,16,17. Since previous neuroimaging studies mainly focused on the limbic system when investigating facial emotion processing, the contributions of the visual system to facial emotion perception impairments in schizophrenia remain rather elusive. Core brain regions involved in normative face processing include the fusiform face area, occipital face area, and regions of the superior temporal sulcus10,18. In ISZ, deficits in face processing may arise from functional and/or structural alterations in these core face-processing regions. Reduced volume has been found in the fusiform gyrus of patients10,19. However, findings from fMRI studies have been inconsistent20,21,22,23,24. One of the few studies that did investigate early visual brain regions in ISZ, reported selective impaired functional connectivity between these regions and the right fusiform face area in this disorder22.
Given that face perception and processing involve multiple stages, alterations can occur at any level, necessitating a finely graded investigation to pinpoint deficits in ISZ. To study this rapid cognitive process, with face encoding emerging as early as around 100 ms post-stimulus presentation, researchers commonly employ event-related potentials (ERPs) with millisecond-range temporal resolution. In schizophrenia, the face-sensitive components, P1 and N170, which are sensitive to low-level visual stimulus information (e.g., color or contrast) and high-level face perception, respectively, are mostly studied. A systematic review reported diminished P1 amplitudes in schizophrenia in response to faces which may be mediated by valence, with smaller P1 amplitudes in response to neutral and happy faces25. In addition, the N170 seems to be reduced in response to faces (and other complex objects) in schizophrenia10,26,27.
Nevertheless, the neural correlates of face processing in ISZ are not well understood and pinpointing the specific stage of processing where these deficits occur remains a challenge. Moreover, the above findings mostly pertain to explicit processing, even though, in real life, emotion perception is not isolated from their surroundings and often need to be processed implicitly. Contextual factors, such as scenes, voices, or other faces, influence both, identification accuracy and reaction times, along with the perceived intensity levels of target faces28,29,30. In previous work by our group, we have shown that task-irrelevant facial crowds affect the neural processing of subsequent target faces in healthy individuals30. Specifically, fearful facial crowds reduced target N170 amplitudes, while the N170 amplitude in response to the crowd itself was unaffected. Moreover, behavioral indices of the effect of facial crowds on the subsequent processing of target faces were also unaffected, pointing to rather unconscious effects.
Since studies on the neural correlates of implicit, automatic processing of face emotions in ISZ are scarce, the aim of the current study was to investigate neurobiological underpinnings of task-irrelevant implicit face processing in schizophrenia. Specifically, we conducted a combined EEG/fMRI study to simultaneously acquire EEG and fMRI data during emotional face processing. Combined fMRI/EEG studies offer several advantages. Most importantly, we used two different data modalities that are of complementary nature, to inform the parameters of the same model. By using EEG data, we leveraged its high temporal resolution, while with fMRI, we utilized its superior spatial resolution. Specifically, we applied fMRI-informed dynamic causal modeling (DCM) on our EEG data. DCM is a hypothesis-driven modeling approach that enables formal inference of effective connectivity models (and is thus inherently directional) within a defined cortical network31. In our case, the network architecture was constructed based on the results of the prior fMRI analysis. Thus, our approach allowed us to understand the temporal dynamics and interactions between different brain regions involved in altered face processing in ISZ simultaneously and in a precise and fine-graded manner.
Methods
Participants
In total, 14 patients with schizophrenia (5 female) and 14 gender and age matched healthy controls (HCs) participated in the current study. Table 1 summarizes the demographic characteristics of our sample. Parts of the HC sample have been previously published32. For this current analysis, HCs were selected to match the schizophrenia sample regarding age and gender at the group level (no pair-wise matching). Participants with schizophrenia were recruited through the Department of Psychiatry, Psychotherapy and Psychosomatics of the RWTH Aachen University Hospital. HCs were recruited via public flyers and the RWTH Aachen University community. All participants met the following inclusion criteria: age between 18 and 55 years, no neurological diseases, normal or corrected-to-normal vision, and all fulfilled MR-scanning criteria. In addition, for the patient group schizophrenia had to be the primary psychiatric diagnosis. Comorbid affective disorders and schizoaffective disorders were excluded. The diagnosis was based on the International Classification of Diseases (ICD-10) by an experienced psychiatrist or psychologist. In addition, as part of the screening procedure of the study, the diagnosis was ascertained by a psychologist using the German version of the Structured Clinical Interview for DSM-IV Axis I Disorders (SCID-I). HCs were excluded if they had any history of psychiatric disorders. The presence of psychiatric diagnoses of first-degree relatives was an exclusion criterion as well.
During participation, all patients were taking psychotropic medication. The most frequently used psychotropic class was atypical antipsychotics (n = 19), followed by antidepressants (n = 5), and anticonvulsants (n = 1), and typical antipsychotics (n = 1). Most patients took multiple kind of medication. The mean antipsychotic dose in olanzapine equivalents was 21.39 mg per individual (converted according to the Defined Daily Doses Method by Leucht et al.33). See Table 1 for further characteristics of the patient group, including duration of illness, age of onset and PANSS scores. All but one participant were right-handed as assessed by the Edinburgh Handedness Inventory.
The experimental protocol was approved by the local Ethics Committee of the RWTH Aachen University Hospital. All participants gave oral and written informed consent, and no adverse events occurred. Participants were reimbursed with 10 Euro per hour for study participation.
Materials
Neuropsychological and psychopathological assessment
The neuropsychological tests administered included the Trail Making Test (TMT) A and B, a crystallized verbal intelligence estimation (Wortschatz-Intelligenztest, WST), and the digit span task of the Wechsler Memory Scale-Revised.
The TMT-A assesses psychomotor speed, requiring participants to connect 25 numbers in ascending order. TMT-B evaluates cognitive flexibility and working memory, with participants connecting numbers and letters alternately. An executive control measure was derived from the ratio of part B to part A34. Verbal intelligence was assessed using the WST, which consists of 42 items, with six words each, where each item contains five nonsense words and one existing word. The participant is asked to identify the existing word (in German language). A total of 31 correct identifications corresponds to a mean verbal IQ of 10135. Memory performance (forward and backward) was assessed with the Wechsler Memory Scale—revised (WMS-R). In the forward task, participants repeat a sequence of numbers in the order verbally presented, starting with three digits and progressing through six trials. The backward task requires participants to repeat sequences in reverse order.
Self-reports assessing psychopathology that were administered in both patients and controls included German versions of the Beck Depression Inventory-II (BDI-II36), as well as the Toronto Alexithymia Scale (TAS-20)37. The BDI-II comprises 21 multiple-choice questions to assess the severity of depressive symptoms. It is one of the most commonly used psychometric measures for assessing depression, demonstrating high validity with an internal consistency of alpha = 0.84 in a German sample of individuals diagnosed with depression38. The TAS-20 consists of 20 items, which are to be rated on a 5-point Likert scale (1 = strongly disagree, 5 = strongly agree), measuring difficulties in identifying and describing emotions. Moreover, the Global Assessment of Functioning (GAF) was used to measure the general level of functioning in participants. Mental, social, and occupational functions are conceptualized on a continuum from mental health to illness. The GAF scale is divided into 10 functional levels, each with 10 points, ranging from 100 (highest level of performance) to 1 (lowest level of performance). The rater assigns a single score that most accurately reflects the patient’s general level of functioning, taking into account both the severity of symptoms and the extent of impairment. If symptom severity and degree of impairment fall into different categories, the lower level is chosen.
In addition, psychopathological ratings have been performed (by BSH), namely for depression and schizophrenia symptoms, the Hamilton Rating Scale for Depression (HAM-D) and PANSS (Positive and negative affect scale for schizophrenia) were administered to patients. The PANSS allows the assessment of positive, negative and general psychopathological symptoms with a total of 30 items, each rated on a 7-point scale. It is administered in the form of an interview.
Stimuli and task
Stimuli and tasks are reported elsewhere in more detail30. The experimental task consisted of targets and flankers (hereafter referred to as crowds) of face stimuli. Specifically, crowd stimuli consisted of a circularly shaped crowd of six colored pictures of faces (3 female, 3 male), all either expressing the same emotion (happy, neutral or fearful) or the faces were made unrecognizable and pixelated (scrambled). The face crowds defined the four experimental conditions of the variable “crowd” (happy, neutral, fearful, scrambled). The face crowd stimulus was presented for 300 ms, followed by the target stimulus, which was presented for 500 ms. The target stimulus consisted of the same circularly shaped crowd as the preceding flanker stimulus. In addition, the target stimulus also depicted another face in the center of the crowd (the target face depicted one of the three emotions: happy, neutral, fearful) and was followed by a blank screen for 450 ms. The participants’ task was to identify the target emotion on a seven-point scale ranging from extremely fearful through neutral (middle icon) to extremely happy or vice versa. The final decision had to be made within 3500 ms. A jittered fixation cross was shown for a mean duration of 875 ms before the next trial. An overview of the entire task sequence is shown in Fig. 1.

Each trial commenced with the display of a fixation cross, indicating the position of the upcoming target and facilitating gaze fixation. After 500 ms, a facial crowd stimulus was introduced (for 300 ms), followed by the replacement of the fixation cross with a target face, presenting the crowd-target combination for 500 ms. A subsequent blank screen (450 ms) was included to prevent any overlap between response-related movement and the signal of interest. Following this, a response screen was presented for 3500 ms.
Each face crowd condition (happy, neutral, fearful, scrambled) comprised 120 trials (each stimulus shown twice), totaling 480 trials. The order of trials was pseudo-randomized. The experiment was divided into four parts of 120 trials each and was presented via MR-compatible goggles using Presentation® (version 14, Neurobehavioral Systems Inc., San Francisco, CA). Responses were given in the form of button presses, recorded via an MR-compatible response system. All stimuli were selected from a standardized stimulus set and were comparable in terms of age, emotion intensity, luminance, and emotion valence32,39.
Procedure
Before participating, all participants provided written informed consent after having received detailed oral and written information on the study. All procedures were in accordance with the Declaration of Helsinki and were approved by the University’s Ethics Committee (Ethics Committee at the RWTH Aachen Faculty of Medicine).
Simultaneous EEG-fMRI data acquisition
In the current study, fMRI data was acquired using a Siemens 3 Tesla MR scanner (Siemens TimTrio®, Siemens Medical Systems, Germany). An echo planar imaging sequence was used with the following parameters: TR/TE = 2000/30 ms, 76˚ flip angle, 3.125 × 3.125 × 3.4 mm3 voxel size, 64 × 64 matrix, 200 × 200 mm2 FOV, 33 3.4 mm-thick axial AC-PC slices with 0.51 mm gap. Data were recorded in ascending sequential slice acquisition with whole brain coverage using a standard 12-channel head coil.
EEG data were simultaneously acquired with the fMRI data using an MR-compatible EEG system (BrainAmp MR, Brain Products GmbH, Gilching, Germany) at a sampling rate of 5000 Hz using MR-compatible EEG-caps (Easycap GmbH, Germany) with 64 Ag-AgCl electrodes (extended 10–20 system). An additional electrocardiogram (ECG) electrode was placed under the left collarbone of the participant. Electrodes FCz and FPz served as the recording reference and ground channel, respectively. Impedance levels were below 10 kΩ at start of the recording (except ECG). From the amplifier, the digitized data were transmitted via fiber optic cables outside the scanner room to an USB interface located in the control room. To facilitate the removal of MR-induced artifacts from the EEG data, the sampling clocks of the EEG and MRI systems were synchronized by a SyncBox (Brain Products GmbH, Gilching, Germany).
A trained specialist positioned the EEG caps on the participants. To ensure valid standard positions, the electrode Cz was placed halfway between the nasion and the inion, and was right-left-centered.
Data processing and analysis
We describe the (pre-)processing steps of each modality (behavioral, EEG, fMRI) separately below. The pipeline of our imaging fusion analyses may be found in Fig. 2. In fMRI-EEG fusion, we leverage the high spatial precision of fMRI (identifying regions related with face emotion processing) and the high temporal resolution of EEG (capturing early neural activity related to face emotion processing) to offer complementary and informative constraints on model parameters. Briefly, multimodal fusion was partly based on a pipeline described by Wei and colleagues40:
-
1.
Whole-brain fMRI analysis: We identified brain regions significantly activated by our face emotion processing paradigm, using whole-brain analysis of the acquired fMRI data (unimodal analysis using a flexible factorial GLM in SPM).
-
2.
Coordinate Extraction: MNI coordinates of the activated regions were extracted. These identified regions form the network structure for the subsequent DCM analysis.
-
3.
Network Node Definition for DCM Analysis: We conducted a DCM analysis of the simultaneous acquired EEG data by setting the prior source locations to the activated regions identified in step 1/step 2, in order to obtain the posterior densities of the neuronal parameters. A neural mass model was allocated to each of the regions. These models were connected via possible forward and backward connections. ERPs over 0–400 ms post-target were fitted to the models. The effects of each task condition (TAF, TAH, TAN) on the ERPs were contrasted against the TAS condition, and modulatory effects on these contrasts were modeled for all extrinsic connections (i.e., between the sources) of the given model structure.
-
4.
Bayesian Model Selection (BMS): We applied BMS to identify the best-fitting model (that most likely generated the ERPs). The results showed that Model 6 provided the best fit among the six competing candidates.
-
5.
Post-hoc analyses on the winning model.
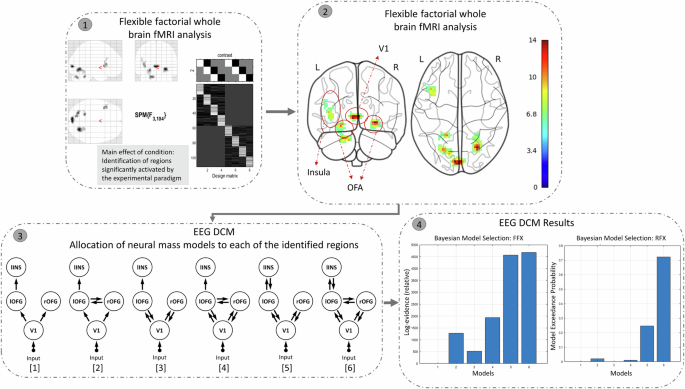
Step 1: Whole-brain fMRI analysis: We conducted an unimodal flexible factorial whole-brain analysis, examining the main effect of the task condition (F-contrast). This revealed regions significantly activated by the experimental paradigm, thresholded at p < 0.001 with cluster-level correction at k = 34, corresponding to a cluster-level FWE of p < 0.05. Step 2: Coordinate Extraction: We extracted MNI coordinates of these activated regions, excluding the cerebellum. Step 3: Network Node Definition for DCM Analysis: Using the extracted coordinates, we defined nodes for the cortical network in Dynamic Causal Modeling (DCM) analysis. Six model structures were created, incorporating combinations of forward, backward, and bilateral connections among the four brain regions identified in the whole-brain fMRI analysis. Step 4: Bayesian Model Selection (BMS): We applied BMS to identify the best-fitting model. The results showed that Model 6 provided the best fit among the six competing candidates.
Behavioral data analysis
Behavioral variables of interest included the number of correctly identified target emotions, duration until the first response, and intensity ratings of target emotions (happy, fearful). Note that trials with responses <150 ms were discarded. The count variable “correctly identified target emotions” was transformed using Tukey’s Ladder of Power transformations to normalize the data. Next, we computed three linear mixed models using the R package “lme4” with “subject” as a random effect to estimate the above stated dependent variables. Independent, fixed effect variables were “group” (HC, ISZ), and the repeated measures variables “crowd” (fear, happy, neutral, scrambled) and “target” (fear, happy, neutral). Note that for intensity ratings, the ‘target’ variable consisted of only the fear and happy level. P-vales of post-hoc comparisons (two-sided) were adjusted using Tukey method, implemented in the “emmeans” R package.
EEG data preprocessing and analysis (unimodal)
Offline EEG data preprocessing was performed using the BrainVision Analyzer software (version 2.0, Brain Products GmbH, Gilching, Germany). The preprocessing pipeline included the following steps: 1) removal of MR-induced artifacts from the raw EEG signal using the sliding average procedure with 21 templates for the calculation of the correction template 4>; 2) removal of cardioballistic artifacts by a semi-automatic algorithm41: R-peak markers were set at highly correlated (r = 0.7) time points with above-threshold amplitudes (0.4–1.7) and inspected before template subtraction; 3) filtering of the EEG data using an infinite impulse response filter (IIR, 70 Hz, 48 dB slope); 4) and resampling to 250 Hz; 5) independent component analysis (ICA), employing the restricted biased Infomax algorithm, was utilized to effectively eliminate artifacts. Components indicative of eye blinks and movements, residual gradient, and muscle artifacts were identified and removed based on their power spectrum and topography. Finally (6) data were re-referenced to a common average reference. The subsequent processing steps were done in EEGLAB42, a MATLAB-based toolbox: A limited number of poor contact electrodes from individual measurements were screened for visual inspection and were subsequently substituted using spherical interpolation techniques.
The continuous EEG recording was then segmented from −1000 to 1750 ms time-locked to the onset of the four different conditions of the crowd stimuli. Baseline correction was applied to the epochs from −200 to 0. Segments from all conditions were visually inspected, and those containing muscular activities or non-physiological artifacts were rejected.
For the subsequent steps, only correct trials were considered. EEG segments were averaged for each subject and for each condition. Specifically, P1 amplitudes were extracted and averaged at electrodes P7/PO7 and P8/PO8 at 90–120 ms post-stimulus (i.e., crowd) onset. N170 amplitudes were extracted at electrodes P7 and P8 at 160–200 ms post-stimulus onset. In addition, of particular interest to the current study was to investigate the processing of the target stimuli after crowds. For this purpose, another baseline correction was applied to the data from 250 to 350 ms (post-crowd onset) before averaging. Subsequently, again P1 (at 390–420 ms) and N170 (at 470–520 ms) ERPs were extracted by averaging (condition- and subject-wise). The selection of electrode positions and time windows was guided by previous literature and topographic plots (see supplementary Figs. 1 and 2). Since the main interest of our study was to study the effect of task-irrelevant faces on the processing of subsequent target faces, we focus on reporting ERP amplitudes in response to targets stratified by preceding crowds. In addition, we report ERP amplitudes of crowd faces in supplementary materials. The P1 and N170 amplitudes of the targets after crowds (and crowd) ERPs were each analyzed with separate repeated measures ANOVAs. The models each included the within-subjects factors “crowd” (happy, neutral, fearful, scrambled) and “electrode site” (left, right) as well as the between-subjects factor “group” (HCs, ISZ). In cases of violations of the sphericity assumption, Greenhouse Geenhouse-Geisser correction was applied. Post-hoc comparisons were Bonferroni-corrected.
fMRI data preprocessing and analysis (unimodal)
The MATLAB-based toolbox SPM12 was used for preprocessing (https://www.fil.ion.ucl.ac.uk/spm/software/spm12/). Six motion parameters were estimated and used to realign the functional images to their mean. Subsequently, the functional images were co-registered to the structural image that was segmented into tissue components (gray matter, white matter, and cerebrospinal fluid) and normalized to the Montreal Neurological Institute (MNI) standard brain template. Functional images were smoothed with an 8 mm Gaussian kernel.
After preprocessing, parameter estimates reflecting the BOLD signal change for correctly answered target onsets within crowd conditions were calculated for each subject. In the following, these are referred to as target after fear (TAF), target after happy (TAH), target after neutral (TAN), and target after scrambled (TAS). In addition, for each subject, a separate regressor for all incorrect trials was included. Four T-contrasts were created, each testing for the main effect of the four conditions, which were further used for the group-level analysis. Subsequently, a flexible factorial design with the task conditions for the different groups and a subject factor was estimated on the second level. Deviations from sphericity were corrected for by variance components for within-subjects measures and heteroscedasticity between subjects and conditions. Finally, an F-test was carried out to test the effect of condition (i.e., main effect across groups).
Identifying regions significantly activated by the experimental paradigm, using whole brain (SPM) analysis of fMRI data was done in order to create a network architecture for subsequent DCM analysis (c.f., ref. 40). Results were thresholded at p < 0.001 and cluster-level corrected at k = 34, corresponding to a cluster-level FWE of p < 0.05.
fMRI-informed EEG DCM analysis
DCM is a hypothesis-driven approach to compare hypotheses about the mechanisms (in terms of neuronal coupling) that underlie the regional responses detected in conventional analyses43. Here, we applied DCM for ERPs based on a neural mass model aimed at elucidating source activity. This model integrates the dynamics of three cortical layers, including an excitatory subpopulation in the granular layer, an inhibitory subpopulation in the supra-granular layer, and a subpopulation of deep pyramidal cells in the infra-granular layer. Specifically, the DCM generates a predicted ERP by simulating the response of a network of interconnected sources to sensory input. Each source is modeled as a point source, consisting of the three subpopulations, each assigned to a specific cortical layer. Based on extrinsic connectivity rules44, a hierarchical cortico-cortical network is organized, comprising several cortical sources, each modeled using the neural mass model. The strengths of extrinsic connections among these cortical sources are estimated using Variational Bayes. All DCM steps were performed using SPM12.
Briefly, informed by the fMRI analysis of task condition effects (see above; F-contrast on the effect of condition as part of a flexible factorial design), we conducted a DCM analysis. Specifically, six brain regions (MNI coordinates) were identified by this F-contrast, including the bilateral occipital fusiform gyrus (OFG), left insula, V1, and bilateral cerebellum. Four of these regions—aligned with previous findings on emotional face processing—were selected for the subsequent DCM analysis. Using these four regions as prior coordinates, we constructed six models of cortical connectivity (see Step 3 in Fig. 2), each representing varying configurations of forward and backward connections among the ROIs. In the simplest model (model 1), an external visual input was entered at V1, which projected forward to the bilateral OFG, and from the left OFG to the left insula. In models 3 and 5, bilateral OFGs had backward connections to V1, with an additional backward connection from the left insula to the left OFG in model 5 only. Models 2, 4, and 6 also introduced lateral connections between the left and right OFG.
ERPs over 0–400 ms post-target were fitted to the models. Activity of each cortical source was modeled with a single equivalent current dipole method based on the individual forward head model45. The effects of each task condition (TAF, TAH, TAN) on the ERPs were contrasted against the TAS, and modulatory effects on these contrasts were modeled for all extrinsic connections (i.e., between the sources) of the given model structure. In other words, the task-specific connectivity effects are relative to the “baseline-connectivity” of the TAS.
Bayesian model selection (BMS) was performed to identify the model structure within a confined model space that most likely generated the ERPs, assuming that—because of the basic nature of the tasks—that this model structure was the same for all subjects (i.e., a fixed-effects analysis was performed; step 4 of Fig. 2)43. Nevertheless, a random-effect analysis was also performed for comparing model evidence, an approach that admits different models for different subjects who may have performed the task with different strategies43. The model evidence that accounts for both model accuracy and model complexity was used to determine posterior probabilities of the models (by normalizing the model evidence to the respective model space). Based on observed data, a large number of free parameters of the neural dynamics were estimated46. The extrinsic connectivity between cortical sources is commonly the most informative parameters that explain the changes in ERP data47. From the winning model, the estimated modulatory connectivity parameters were subjected to a 2 (SZ, HC) × 3 (TAF, TAH, TAN) repeated measures ANOVA.
Results
Neuropsychological functioning and psychopathology
Patients diagnosed with schizophrenia showed lower psychomotor processing (TMT-A), cognitive flexibility (TMT-B), and verbal intelligence (WST) compared to HCs. There were no significant differences between patients and HCs regarding the TMT A/B ratio and short-term memory as assessed by the digit span forward/backward of the WMS-R. Patients with schizophrenia exhibited higher BDI-II, TAS 20, and GAF scores compared to HCs (see Table 2).
Behavior
Results of the mixed model on the Tukey transformed number of correctly identified target emotions (independent fixed effects variables: group x crowd x target) revealed a main effect of group and target, as well as an interaction effect between group and target (see Fig. 3a; Means and SDs of the raw, untransformed count data may be found in Table 1 of supplementary materials). Post-hoc comparisons indicated that HCs, compared to ISZ identified a greater number of targets correctly (p < 0.05, Cohen’s d = 0.414). Pairwise comparisons across groups, following up the main effect of target, showed significant differences between each possible pair of target emotions. Happy targets were identified most often correctly, followed by fearful targets, and then neutral targets (all pairwise comparisons: p < 0.0001). The interaction effect was primarily driven by a greater number of correctly identified happy (p < 0.01) and fearful targets (p < 0.001) for HCs as opposed to ISZ and an absence of a significant difference between HCs and ISZ in identifying neutral emotions (p = 0.53). No other significant effects emerged.
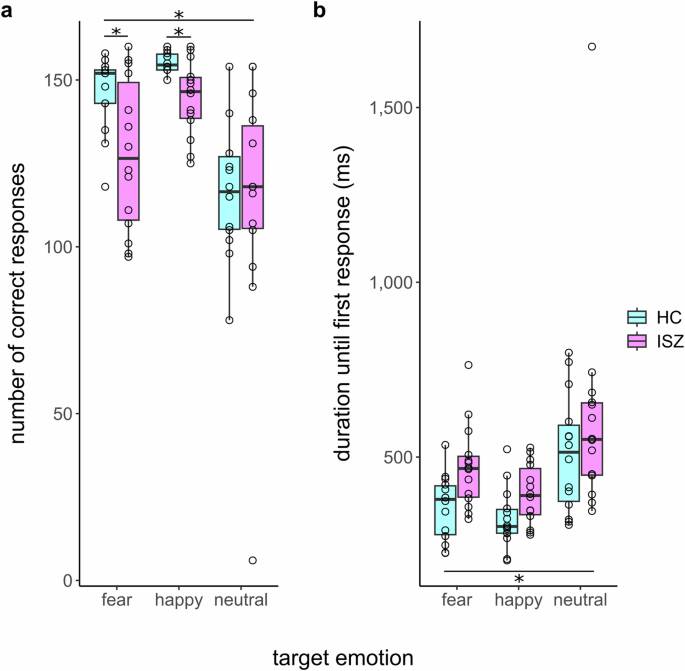
a Correct identifications and b duration until first response for the three different target emotions stratified by group (healthy controls/individuals with schizophrenia). Error bars indicate standard error of the mean.
Results of the mixed model on duration until first response (independent fixed effects variables: group x crowd x target) revealed the main effect of group as well as a main effect of target. Post-hoc comparisons for the main effect of group revealed that ISZ responded significantly slower to all target emotions (M = 484.53 ms, SD = 231.28) as compared to HCs (M = 396.77 ms, SD = 149.13, p < 0.05, Cohen’s d = 0.451). Regarding the main effect of target, post-hoc comparisons indicated that each possible pair of target emotions showed significant differences (all pairwise comparisons: p < 0.0001): responses to happy targets were fastest (M = 358.66 ms, SD = 99.25), followed by fearful targets (M = 414.18 ms, SD = 128.58) and by neutral (M = 554.07 ms, SD = 268.19) targets (see Fig. 3b). No interaction effects emerged.
Finally, the model on the intensity ratings (independent fixed effects variables: group × crowd × target) revealed a main effect of target. Fearful targets (M = 1.69, SD = 0.31) were rated as more intense compared to happy targets (M = 1.57, SD = 0.35, p < 0.05, Cohen’s d = 0.377). No other main or interaction effects emerged for this model.
None of the models revealed any effects involving crowd emotion. Thus, crowd emotion did not differentially affect accuracy, intensity ratings or duration until the first button press.
EEG
Of interest to our study were especially ERP amplitudes in response to targets stratified by preceding crowds. In addition, we report ERP amplitudes of crowd faces in the supplements (Table 2).
ERPs of target faces following crowds
The P1 and N170 waveforms in response to target faces following crowds are presented in Fig. 4 and Table 3.
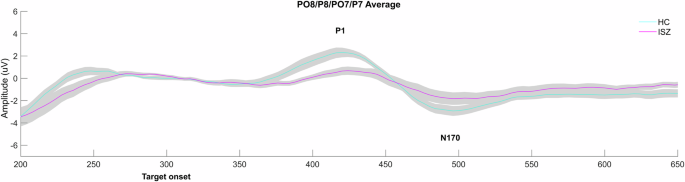
P1 and N170 ERPs in response to target faces (following crowds) for healthy controls (HCs) and individuals with schizophrenia (ISZ).
P1. Results of the repeated measures ANOVA for P1 amplitudes revealed a main effect of group (F(1, 26) = 6.01, p < 0.05), with reduced P1 amplitudes in ISZ as opposed to HCs (p < 0.05, Cohen’s d = 0.60). Moreover, an interaction effect of emotion and site emerged (F(1.46, 37.88) = 7.41, p < 0.05, Greenhouse-Geiser corrected), the associated post-hoc test, however, did not yield any significant results. This effect appears to be driven by a trend of smaller amplitudes in the left hemisphere compared to the right for all emotions, except for happy emotions, which seem to elicit larger amplitudes in the right hemisphere than in the left. No other effects emerged for the P1 (all p ≥ 0.05).
N170. Results of the N170 revealed a main effect of emotion (F(1.49, 38.80) = 6.33, p < 0.05, Greenhouse-Geiser corrected). Bonferroni-corrected post-hoc comparisons revealed that targets preceded by fearful crowds and neutral crowds elicited significantly smaller amplitudes compared to targets preceded by scrambled crowds.
fMRI
fMRI results revealed a significant main effect of the crowd. Clusters that showed significant differences in brain activation across TAF, TAH, TAN, and TAS included the right and left occipital fusiform gyrus (OFG), the V1, and the left insula (see step 1 and 2 of Fig. 2). Peak activations and MNI coordinates of the regions may be found in supplementary Table 3. The identified regions (insula, occipital fusiform gyrus, V1) align well with previous studies investigating emotional face processing and therefore corroborate the selection of priors of the subsequent EEG DCM18,48,49,50. No significant voxel survived in the group contrast or in the task × group contrast after cluster-level correction.
DCM: fMRI-informed EEG
Of the six DCM neural mass models, the winning model was model 6 for both fixed effect analysis and random effect analysis, which incorporated forward and backward connections between the ROIs (see step 4 of Fig. 2).
As a follow-up analysis, we investigated (effective) connectivity strength of the eight connections of model 6. Specifically, we conducted a repeated ANOVA analysis with the within-subjects factor crowd (TAF, TAH, TAN) and group as between-subject factor on connectivity strength between the pair of regions of model 6. After Bonferroni-correction (0.05/8; for the 8 different pairs of connections of model 6), a significant effect was found only for the connection from lOFG to V1 (crowd × group interaction effect, F (2, 52) = 5.70, p < 0.01). Post-hoc comparisons revealed that ISZ patients showed positive connectivity strength (M = 0.127, SD = 0.077) for the processing of TAF stimuli, whereas controls showed a negative connectivity strength (M = −0.102, SD = 0.077), see Fig. 5a. This group difference yielded a medium effect size (Cohen’d = 0.52).
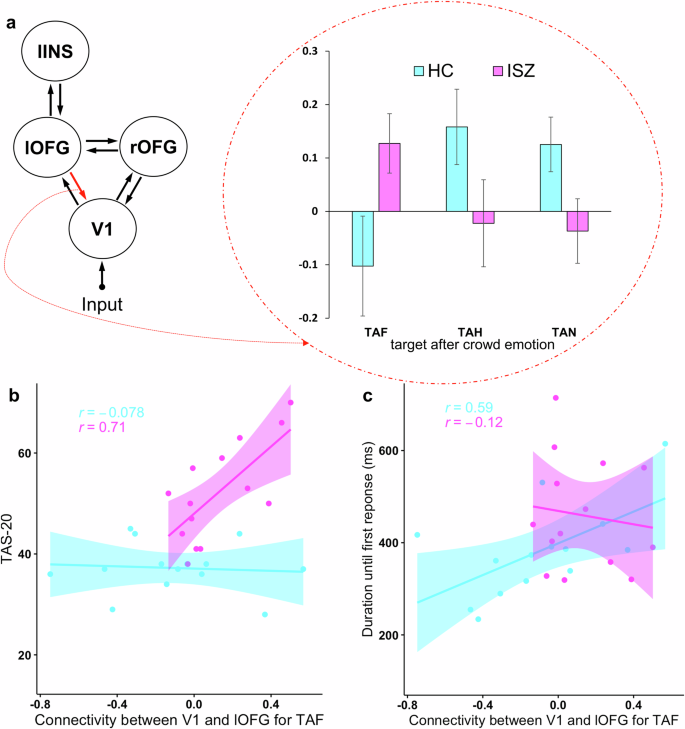
a Functional connectivity strength of the backward connection between the left occipital fusiform gyrus (lOFG) and the V1 of model 6 for each condition (target after fearful, target after happy, and target after neutral stimuli) and group (healthy controls and individuals with schizophrenia). Error bars indicate standard error of the mean. b, c Pearson correlations between connectivity strength between the lOFG and V1 and the Toronto Alexithymia Scale (TAS)-20 and duration until first response, respectively, for individuals with schizophrenia and healthy controls. Shaded area represents 95% confidence intervals.
Brain-symptomatology relationships
Higher TAS-20 scores were associated with greater (backward) connectivity strength between the V1 and the left OFG in ISZ (r = 0.79, p = 0.0049; see Fig. 5b). This result survives Bonferroni-adjustment for multiple comparisons (new critical p = 0.005), dividing .05 by the number of psychological assessments (5) and doubling for the two groups tested individually. In HCs, this relationship was absent (r = −0.08, p = 0.79). Connectivity strength between the V1 and the left OFG was not related to any of the other psychopathology assessments (BDI II, PANSS, GAF, HAM-D) in ISZ.
Brain–behavior relationships
Finally, we tested whether left OFG – V1 backward connectivity was related to the core behavioral measures we assessed (duration until first response, intensity ratings, and number or correct responses) for TAF stimuli. Results indicated a significant correlation for HCs (but not for ISZ) between duration until first response and connectivity between the V1 and the left OFG (r = 0.59, p = 0.026; Fig. 5c). However, this relationship did not survive correction for multiple comparisons (new critical p = 0.0083: 0.05 divided by 3 (number of variables) × 2 (number of groups). No other significant relationships emerged.
Discussion
A hallmark of schizophrenia is alterations in facial emotion processing, as established by behavioral measures. However, less is known about the specific neurophysiological correlates and where in the multi-staged processing stream deficits occur. To better understand potential alterations in the neural processes underlying facial emotion perception in schizophrenia, we conducted a combined EEG/fMRI study, leveraging the advantages of EEG’s superior temporal resolution and fMRI’s better spatial resolution, and relying on dynamic causal modeling to elucidate the temporal dynamics and interactions among distinct brain regions implicated in aberrant face processing.
Of particular interest to our study was the influence of task-irrelevant stimuli on the processing of subsequent emotions. Here, we identified neural alterations in individuals with schizophrenia (ISZ) underlying the processing of targets after fearful (TAF) stimuli. Among the six fMRI-informed EEG-DCM models, the winning one revealed an alteration in effective connectivity between the primary visual cortex (V1) and the left occipital fusiform gyrus (lOFG). Specifically, ISZ exhibited enhanced (positive) backward connectivity from the lOFG to the V1 for TAF, while the connectivity strength was negative for healthy controls (HCs).
The OFG plays a key role in higher-level visual processing, particularly in the recognition of complex visual stimuli, such as faces18,51. In ISZ, structural alterations of the left fusiform gyrus have been noted previously. For example, reduced volume of the fusiform gyrus seems to be associated with difficulties in social emotion processing19, negative symptoms, and a history of psychosis in bipolar disorder52. While structural changes in the fusiform gyrus are frequently documented, evidence regarding functional alterations remains heterogeneous.
The overall connectivity pattern of HCs underlying all three conditions (TAF, TAH, TAN) may align with a pattern known as “positivity bias” or “positivity offset”: increased responses to positive over negative stimuli or attributing subtle positivity to neutral information. Although current literature suggests that human reactions to emotional material are more in line with a negativity bias (increased arousal/responses to negative over positive stimuli), positivity bias has been reported before—especially for implicit/irrelevant stimuli or stimuli embedded within a greater context53,54,55, as is the case in our current study. Here, HCs show greater (and positive) connectivity between the lOFG and the V1 for TAH and TAN stimuli, compared to TAF stimuli, for which they show negative connectivity. The negative backward connectivity between the lOFG and V1 after fearful stimuli might indicate an inhibitory influence from the OFG to V1. This may reflect a top-down modulation mechanism where higher-order visual processing areas suppress distracting and task-irrelevant visual processing of negative but negligible stimuli in V1 to prioritize the processing of behaviorally significant target emotions/stimuli. In healthy individuals, this mechanism may enhance the brain’s efficiency in detecting and responding to potential threats, ensuring that significant emotional stimuli receive appropriate attention and processing. Conversely, and as suggested before, when irrelevant but positive (non-dangerous) stimuli enter our perception, they may enter working memory stages relatively uncensored because of a lacking inhibition at low levels of arousal54.
In our study, the backward connectivity for TAH and TAN seems to be disrupted for ISZ. This finding is in line with previous studies showing that ISZ displays a diminished positivity bias/offset56,57,58. Importantly, our finding of increased, positive, backward connectivity from the lOFG to V1 in ISZ suggests that feedback from the higher-order visual area modulates early visual processing in V1 for TAF stimuli. This top-down modulation may enhance the representation of TAF stimuli and provide contextual information or expectations to V1, influencing how visual information is processed at the early stages of visual perception. Since the OFG is also implicated in attentional processes, particularly in directing attention to salient visual stimuli59, increased backward connectivity strength may be related to fine-tuning of incoming visual information. In this regard, ISZ may allocate more attention to fearful (irrelevant) surroundings as compared to happy or neutral surroundings. In fact, attentional control deficits have been suggested to play a role in several perceptual domains in ISZ, including the visual domain10,60. Interestingly, results of a recent study underline that two distinct attentional alterations may manifest in schizophrenia, leading to impaired and exaggerated attention under different conditions: attentional control deficits (e.g., when cognitive and perceptual demands of tasks are high) and hyperfocusing once attention has been directed toward a stimulus60. Our results suggest that, in addition to task difficulty as indicated by previous studies, irrelevant, but stimuli that are highly salient to patients with schizophrenia may influence attentional resources in the processing stream.
It should be noted that we could not observe any (differential/group) behavioral effects of face crowds on the processing of subsequent target faces (correct emotion recognition, intensity ratings, time until first response). This is in line with the findings of our previous paper and is likely to be related to the delayed timing of responses. Moreover, task-irrelevant facial crowds may influence subsequent target face processing outside of the focus of attention32. Although we did not observe behavioral effects of task-irrelevant facial stimuli on subsequent emotion identification, our results deepen the understanding of how the lOFG may contribute to alterations in neural processing within fearful environments. Given the heightened experiences of fear among ISZ in everyday life61 and its relevance to the etiology and persistence of psychosis62, understanding any deficits in processing fearful stimuli is crucial for addressing facial recognition deficits in schizophrenia.
Moreover, our results were corroborated by a significant and large correlation between lOFG to V1 connectivity underlying TAF processing and TAS-20 scores in ISZ but a lack of such correlation in HCs. This correlation was specific to TAS-20 scores (we did not observe any other correlations between connectivity and other clinical scales). The TAS-20 assesses alexithymia, which includes difficulty in identifying and describing feelings and a tendency towards externally oriented thinking. Thus, stronger backward connectivity (i.e., more salient processing of TAF stimuli) was related to more difficulties in self-reported problems in describing and recognizing feeling/external thinking style in our study. The strong relationship between the strength of altered connectivity and self-reported difficulties in emotional processing and external thinking styles further illuminates the nature of the deficits. The link to TAS-20 scores indicates that this neural deficit has real-world implications for how ISZ process and relate to their emotions and external world, potentially contributing to the social and cognitive difficulties observed in the disorder.
Finally, we provide support for evidence of a general deficit in the processing of emotional face stimuli. Behaviorally, we replicated the well-known finding that ISZ identifies fewer target emotions (fearful, happy) correctly, whereas the identification of neutral faces was not affected in this sample. This was accompanied by reduced P1 amplitudes in ISZ in response to target stimuli, which is in accordance with previous findings25, indicating deficits in early visual processing across emotions10. Some previous studies reported that P1 amplitudes may be mediated by valence with smaller P1 amplitudes in response to neutral and happy faces in ISZ but no differences to HCs in response to fearful faces. We could not find any differential effects for emotion which might be related to the small sample size. Moreover, our focus was on the effect of emotional crowds on the processing of subsequent emotional face targets. This is a major difference as previous studies investigated the processing directly underlying emotional face targets. Moreover, our results could not reveal any group differences between ISZ and HCs for the N170 ERP which is involved in higher-order holistic processing such as structural encoding. The majority of ERP studies on face processing focused on that component and most studies reported diminished N170 amplitudes in ISZ. In our study, we could not reveal such an effect. Nevertheless, we revealed small to medium effect sizes for this group comparison, indicating that our study may have been underpowered to reveal this particular effect. Future studies may include larger samples to investigate the effect of emotional face crowds on the N170 ERP underlying the processing of subsequent faces in ISZ.
Some strengths and limitations of the present study should be acknowledged. A major strength is the chosen methodology: by integrating data from multiple modalities (EEG, fMRI), we provide a comprehensive understanding of aberrant facial emotion processing in ISZ. When using fMRI-informed EEG DCM, the aim is to enhance EEG data analysis by incorporating knowledge from fMRI. Therefore, we based our selection of the DCM network architecture on complementary data from the same individuals. By using EEG data, we leverage its high temporal resolution, while fMRI provides superior spatial resolution. Thus, we utilized fMRI’s precise localization of our events of interest and EEG’s ability to capture rapid neural events. With better-informed priors, the model estimates can become more reliable, making it easier to infer causal interactions between brain areas with greater precision. While this combined approach offers substantial advantages, it also carries a few risks. The mismatch, particularly spatial mismatch, between modalities can potentially create difficulties. As a result, the accuracy of results may be degraded by spatial mismatches between the locations of fMRI activations and the sources of electrical activity63. Another limitation of this methodology pertains to the simultaneous acquisition of data. Artifacts and noise are inherent in both EEG and fMRI data. EEG data can be contaminated by MR-induced artifacts, while fMRI data can be affected by physiological noise of non-neuronal origin64. Combining the modalities may amplify these effects. However, sophisticated pipelines make it possible to clean the data and optimize data quality64.
An additional advantage of our methodology is the use of EEG DCM to study effective connectivity. DCM is grounded in neurobiological principles, allowing us to model directional interactions between distinct brain regions effectively by constructing and testing realistic models of interacting neuronal areas31. This approach allowed us not only to identify the brain regions involved in aberrant facial emotion processing in ISZ but also to reveal the associated temporal dynamics. In contrast, other connectivity approaches are often based solely on correlations64.
A further limitation of the current study is the relatively low sample size of only 14 individuals per group. A small sample size can introduce several limitations, including an increased Type I Error Rate: With small samples, the estimates of population parameters are less reliable. This can lead to inflated Type I errors (incorrectly rejecting a true null hypothesis). Moreover, we acknowledge that findings from small samples may not generalize well to larger populations. Parametric tests rely on estimations of population parameters, which can be inaccurate with limited data, reducing the external validity of the study. Nevertheless, we identified a medium effect size for our main finding (the difference in connectivity strength for TAF between ISZ and HCs), suggesting a rather robust result. Additionally, we could not find any behavioral effects of task-irrelevant face crowds on the processing of subsequent target faces, which might have substantiated our imaging findings. This may be due to the use of a delayed button press response following the target presentation30,32.
Conclusively, our results suggest a general deficit behaviorally as well as in early neural processing stages (P1) of target emotional face recognition in a surrounding crowd that is not relevant to the task. Importantly, we observed an augmentation in attentional processing towards stimuli associated with fearful surroundings in ISZ as indicated heightened backward effective connectivity in ISZ, in the context of fearful surroundings. This might indicate that fearful stimuli hold heightened salience for these patients, potentially influencing attentional resources in the processing stream of fearful facial perception, which may result in hyperfocusing. This form of processing correlates with symptomatology, particularly difficulties in comprehending, processing, or articulating emotions, thus potentially serving as a biological risk marker for schizophrenia. Our results highlight a complex interplay between neural, emotional, and cognitive dysfunctions in the disorder. However, due to the limited sample size, further testing and replication of our findings on disrupted backward connectivity from the lOFG to V1 for stimuli preceded by fearful faces in ISZ are needed.


Responses