An artificial market model for the forex market
Introduction
Financial markets have undergone a significant transition toward electronic trading, leading to an increase in the degrees of transaction frequency and the utilization of high-frequency data. In the past, the frequency of available data was confined to monthly or annual intervals and, for intraday trading, to daily snapshots; such availability has currently reached millisecond or microsecond intervals. For instance, since 1996, the Electronic Broking Services (EBS) platform in the foreign exchange market has provided access to intraday historical data. These data featured one-second time intervals for the period from January 1, 1997, to January 1, 2008. Subsequently, from then until August 31, 2008, data were made available at 250-millisecond intervals. Since September 2008, the intervals have been further narrowed to 100 milliseconds.Footnote 1
Who generates and provides these prices at millisecond and microsecond intervals, as observed in EBS data? In the foreign exchange market, prices are supplied by market makers. However, it is unlikely that human dealers manually provide prices at such rapid intervals; it is more plausible that many prices are generated through algorithmic strategies. The Markets Committee (2018) reported that since 2013, over 70% of spot trading has been executed electronically. Essentially, this indicates that the increase in transaction frequency and the utilization of high-frequency data are occurring simultaneously with the expansion of algorithmic strategies and their adaptation to high-frequency trading (HFT). The widespread recognition of HFT and the increasing amount of research on this type of trading serve as evidence of the growing presence of such trading practices. Moreover, the Markets Committee (2020) has observed that the use of execution algorithm strategies has been on the rise for more than a decade, focusing primarily on execution algorithms. The surge in transaction frequency demands significant enhancements in algorithmic strategies. Market impacts, once deemed inconsequential and not requiring precise quantification in low-frequency algorithmic strategies, have become pivotal in high-frequency markets.
In response to the dynamic changes in the market, the artificial market is being increasingly recognized as an environment for developing new algorithms. This study aims to construct such an artificial market, endeavoring to create an artificial foreign exchange market that incorporates the market microstructure. By demonstrating the reproducibility of stylized facts in artificial markets, we validate the viability of this artificial market model and conduct analyses on order flow.
The validated artificial market model will be utilized to simulate market dynamics and algorithm strategies. In financial engineering, prices generated using random numbers may fail to accurately represent the characteristics of real markets, potentially underestimating market risks. For this reason, various models have been developed. One example is the GARCH model, which replicates actual markets by considering volatility clustering. Essentially, these models aim to capture stylized facts. The artificial market model achieves this through a different approach. Its primary objective aligns with the goals of financial engineering models: accurately reproducing market data to facilitate the correct simulation of trading strategies, evaluating market forecasting models, quantifying risks for foreign exchange-related products, and even pricing financial instruments. A key difference of the artificial market model versus typical financial engineering models is the ability of the artificial market model to simulate market reactions to the orders it generates. This capability is particularly significant given the increasing focus on market impacts caused by orders. This feature enables the artificial market model to be applied to a wide range of scenarios, such as analyzing sudden market fluctuations (e.g., flash crashes) and simulating the effects of foreign exchange interventions by regulatory authorities.
The remainder of this paper is structured as follows. Section “Literature review” reviews the literature, Section “Description of the artificial market model” describes the artificial market model, Section “Data” presents the data used, Section “Stylized facts” discusses stylized facts, Section “Analysis a presents the results, Section “Discussion” provides a discussion, and Section “Conclusions” concludes the paper.
Literature review
Literature review of artificial markets
To construct an artificial foreign exchange market model without relying on the assumption of information or technical traders and to validate the model by replicating stylized facts, such as fat tails, this study first must consider agent-based models, as the definition and placement of agents is required for artificial market models.
In financial markets, these agents are market participants such as traders, fundamentally categorized into the following two types: fundamentalists and chartists (also known as technical traders, trend followers, or noisy traders). Given that real markets are more complex than just involving a simple dichotomy of participants, various enhancements to artificial market models have been studied, for example, the introduction of contrarian strategy agents by Sansone and Garofalo (2007) or the incorporation of learning processes influenced by changing proportions of fundamentalists and chartists, as considered in Lux and Marchesi (1999) and Kirman and Teyssiere (2002). Additionally, diverse approaches have been utilized, including the use of genetic algorithms by Arthur et al. (1997) and game theory by Challet and Galla (2005). The validity of these models has typically been verified through the reproduction of stylized facts, with Lux and Marchesi (1999) and Sansone and Garofalo (2007) reproducing phenomena such as fat tails and volatility clustering and Kirman and Teyssiere (2002) demonstrating volatility clustering, long memory, and the absence of autocorrelation. Recent studies, such as Vanfossan, Dagli, and Kwasa (2020), further emphasize the applicability of agent-based models in capturing complex market behaviors. Similarly, Chopra and Sharma (2021) reviewed 148 studies on AI in stock market forecasting, highlighting its success in analyzing nonlinear behaviors and improving prediction accuracy.
In the foreign exchange market, fundamentalists and chartists are mentioned in interviews with practitioners as well as in survey results (Frankel and Froot 1990; Allen and Taylor 1990; Menkhoff and Taylor 2007), indicating that chartists have a strong influence on prices in the short term, while in the long term, the influences of fundamentalists can be seen through mechanisms such as a return to equilibrium, similar to purchasing power parity. However, as shown by Rogoff (1996), deviations from the equilibrium of real exchange rates can take years to correct, suggesting that their impact on intraday price fluctuations is limited. Furthermore, while exchange rate models using macroeconomic fundamental factors other than purchasing power parity have been considered, Flood and Rose (1995) conclude that these efforts are unlikely to be successful. Thus, it is important to note that there is no self-evident fundamental price for fundamentalists to refer to in the forex market.
Additionally, since these studies have been developed based on fundamentalists and chartists, they do not include centrally positioned market makers, who play a crucial role in the market-making foreign exchange market. Therefore, we also focus on the market microstructure as a field of study that has evolved considering the presence of market makers. In the next section, we take a closer look at this literature review.
Literature review of the market microstructure
The concept of the market microstructure was introduced by Madhavan (2000) as a field of study investigating the process by which investors’ latent demands are ultimately translated into prices and volumes.
This area includes the inventory models of Ho and Stoll (1981) and the information models of Kyle (1985), which were developed primarily with a focus on the stock market. Information models are built on the premise of information traders, investors who trade based on private information not yet reflected in market prices. However, defining what constitutes private information and identifying information traders in the foreign exchange market is not straightforward. Furthermore, since there is no broadly agreed-upon price that can be considered the fair value of an exchange rate, the notion of information traders possessing information that leads to a convergence to some price seems unrealistic.
Research by Lyons et al. has focused on the market microstructure in the foreign exchange market. Lyons (1997) describes a phenomenon known as the “hot potato model,” where dealers with large inventories hit quoted prices from other dealers in the interbank market to offset the inventory risk arising from adverse price movements. This repetition among dealers to offset risk leads to increased trading volume.
In another application, Evans and Lyons (1999) discuss exchange rate prediction. While macroeconomic models often lack explanatory power for exchange rates, the model of the above authors, incorporating order flow as a variable, can explain more than 50% of the daily spot rate changes for the deutsche mark/dollar rate and more than 30% for the yen/dollar rate. Although the concept of information is not explicitly included in this model, Evans and Lyons (2008) examine the direct or indirect effects of news and order flow on exchange rates. Lyons et al. perceive that information moves through the foreign exchange market and that order flow plays a role in conveying this information both indirectly and directly to the market. This perception can be seen as an extension of the evolving information model in the stock market. As previously mentioned, there is no consensus on a fundamental price or fair value in the foreign exchange market. Moreover, the concept of insider information does not exist, and the idea of information traders who regularly exist and have a significant impact on the market feels somewhat misplaced when directly applied to the model of the foreign exchange market, as it is in the stock market.
Hence, this study aims to demonstrate that a valid artificial market model for foreign exchange can be constructed using order flow, without assuming the presence of information traders or introducing agents such as fundamentalists and chartists. This work seeks to discuss the roles of these agents in the forex market and their relationship with order flow, without assuming their existence.
Description of the artificial market model
In this artificial market model, we position only market makers as agents. Each market maker independently generates random positions from his or her customers’ order flow, created using uniform random numbers. In addition to customer order flow, market transaction prices are determined by the deterministic behavior of market makers and trading rules due to interdealer order flow. Furthermore, the initial value of the market’s mid-price in the simulation is set at 100, and the initial prices generated by the market makers are calculated on the basis of this market mid-price. Throughout the simulation, price fluctuations do not utilize volatility rates or similar metrics; instead, they are determined by shift values. Therefore, the initial level of the mid-price does not affect the outcomes and can be set to any desired value as needed. To replicate stylized facts in Section “Stylized facts in the artificial market model”, real data from the EBS currency exchange, detailed in Section “Data”, serve as the basis for simulations involving interdealer order flow. Furthermore, in the exploration of the mechanisms behind stylized facts in Section “Verification of the mechanism for generating stylized facts using the artificial market model”, interdealer order flow is generated using uniform random numbers. This method aims to thoroughly eliminate any unidentified factors or patterns that may be present in real order flow data. Across all simulations, the minimum granularity for timestamps is established at 100 milliseconds, aligning with the finest resolution of EBS data employed in this research. The outline of the artificial currency market model developed for this analysis is depicted in Fig. 1.
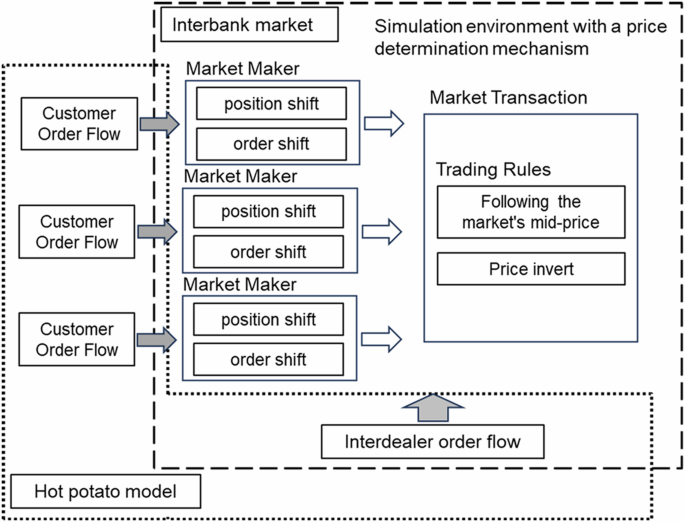
Overview of the foreign exchange artificial market model.
Order flow
Order flow consists of customer order flow and interdealer order flow (hereafter, when the term customer is not specified, the term order flow refers to interdealer order flow). Customer order flow occurs for each market maker, with intervals generated using uniform random numbers based on a set average value and the smallest timestamp unit. The volume of customer order flow is determined by setting minimum units and maximum amounts for buys and sells, with volumes for each generated using uniform random numbers based on the minimum units. Interdealer order flow uses actual timestamps and volumes from EBS order flow. The structure that distinguishes between customer order flow and interdealer order flow is based on the hot potato model, which replicates a very natural mechanism, where market makers, motivated to offset positions generated by customer order flows, quote prices in the interbank market. As mentioned by Evans and Lyons (2002), the customer order flow from other market makers is unobservable, whereas the interdealer order flow is observable. This premise aligns with the structure of the real foreign exchange business and presents the challenges of how to identify and estimate accurate customer order flows while also providing flexibility in simulations for this artificial market model.
Market makers
In this artificial market model, bids and asks are introduced to reflect real markets, a feature not included in Evans and Lyons (2002). The bids and asks in the market are determined by two deterministic actions of market makers, as shown below. However, the spread between the bids and asks of each market maker is fixed at 0.01.
The first deterministic action involves shifting prices based on positions. When the position exceeds a certain threshold, the price is shifted in the direction of liquidating the position. For instance, if it is a long position, then the price is lowered to make the ask more likely to be hit, and if it is a short position, then the price is raised to make the bid more likely to be hit. In this paper, this shift is referred to as a position shift. The threshold for initiating the shift and the shift value are fixed and not subject to learning or changes based on market conditions. The shift value used for the position shift is set at 0.00001. The position shift is fundamentally dependent on the rate update interval, and in this case, 100 milliseconds is used as the standard interval. Additionally, the position shift contributes to reducing profitability for market makers, motivating them to keep this value as small as possible in the absence of specific strategies or intense competition. Excessive position shifts can also cause the market to move unfavorably against the position or reveal the market maker’s position information, leading to a generally lower shift value. Additionally, both the maximum buy and sell volumes of customer order flow in the simulation are set to 10 million dollars, with the expected value of position changes from customer order transactions being 5 million dollars. Therefore, if the position is below this threshold, it is considered that the position can be offset by customer order flow. This also suggests that reducing the position without a shift could potentially increase profitability; thus, the threshold for initiating a position shift is set at 5 million dollars.
The second action involves shifting prices when bids and asks are hit in the interbank market. If a sell order is received, then the price is lowered, and if a buy order is received, then the price is raised. Similarly, this action is also fixed and not subject to learning or changes based on market conditions. This shift is termed an order shift. The shift value used for the order shift is set at 0.001. Additionally, market makers, when their positions are sufficiently liquidated due to interdealer order flow, avoid further trading by following the market’s mid-price. Incidentally, customer order flow influences changes in positions, thereby affecting the position shift, whereas the order shift is not affected. This difference distinguishes customer order flow from interdealer order flow based on the premise that the former is unobservable externally, while the latter is observable. Additionally, although the number of market makers is variable, this study conducts various simulations with 10 market makers.
Market trading rules
Market trading rules dictate that the agent offering the best bid price (or ask price) receives the sell order (or buy order). Each market maker presents a uniform trading amount of one million dollars, and if the order flow exceeds one million dollars, then it is executed in increments of one million dollars. When the market’s best bid and best ask are inverted, the positions held by the market makers supplying those prices are liquidated. This implementation assumes the occurrence of customer transactions aimed at arbitraging excessively shifted prices or excessive price shifts, leading to the liquidation of positions.
Data
The EBS platform serves as the primary venue for the interbank market in USD/JPY, and the data used here are from EBS Data Min Level 5.0. These data include tick data of executed prices and order flow for USD/JPY from August 1 to August 8, 2014. Data from Deal Record, which comprises the execution data from EBS Data Min Level 5.0, are provided in OUT file format daily. For example, the file for August 1, 2014, contains data from 21:00 GMT on July 31, 2014, to 21:00 GMT on August 1, 2014. Therefore, the data from August 1st onward encompass this period. Deal Record records the executed prices and buy/sell order flow at those prices, along with timestamps. In this study, we utilize the tick data of transaction prices from Deal Record, data converted into one-second intervals, and buy/sell order flow data associated with the tick data. These data are used to confirm stylized facts from the actual data. Additionally, the buy/sell order flow data from Deal Record are also utilized as input for the artificial market model. Table 1 presents the number of ticks and the buy/sell trading volume for each day, along with kurtosis. Furthermore, as mentioned earlier, timestamps are recorded at intervals of at least 100 milliseconds, and the minimum price increment (tick size) is 0.005.
Stylized facts
Stylized facts are common properties observed across different markets, and stylized facts regarding forex data have been reported in studies such as Cont (2001). Conversely, phenomena such as fat tails and volatility clustering are observed relatively consistently across many markets, not just financial markets, as evidenced by studies such as Mandelbrot, Hudson (2004), which provides numerous examples. In this study, we aim to confirm the below five stylized facts.
Calendar effects in order flow
Berger et al. (2008) demonstrated that the intraday order flow of USD/JPY exhibits three peaks, which are known to correspond to specific events such as Tokyo fixing (foreign exchange quotations), WM Reuters fixing, and the release of economic indicators in the United States. Similarly, when aggregating EBS order flow data into 30-minute intervals on a daily basis, three peaks can be observed in the average values, as confirmed in the actual data for this study (Fig. 2).
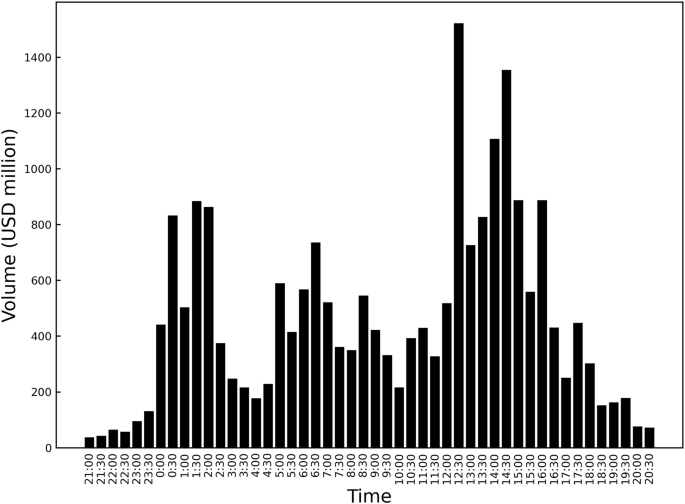
Note: average of 30 min order flow from August 1 to 8, 2014. In this study, all graphs were plotted using matplotlib, a plotting library for the Python programming language, version 3.
Kurtosis/Fat tails
The property of having a high degree of kurtosis in the return distribution, known as fat tails, is indicated when the kurtosis exceeds 3, a measure demonstrated by the normal distribution. A high degree of kurtosis for forex data has also been reported by Zhou (1996) and Cont (2001). Table 1 provides a reference for the kurtosis of the logarithmic returns of EBS tick data for transaction prices. The values range widely, from 2.663 to 411.469. Most days exhibit kurtosis levels exceeding 3, confirming the presence of fat tails in general.
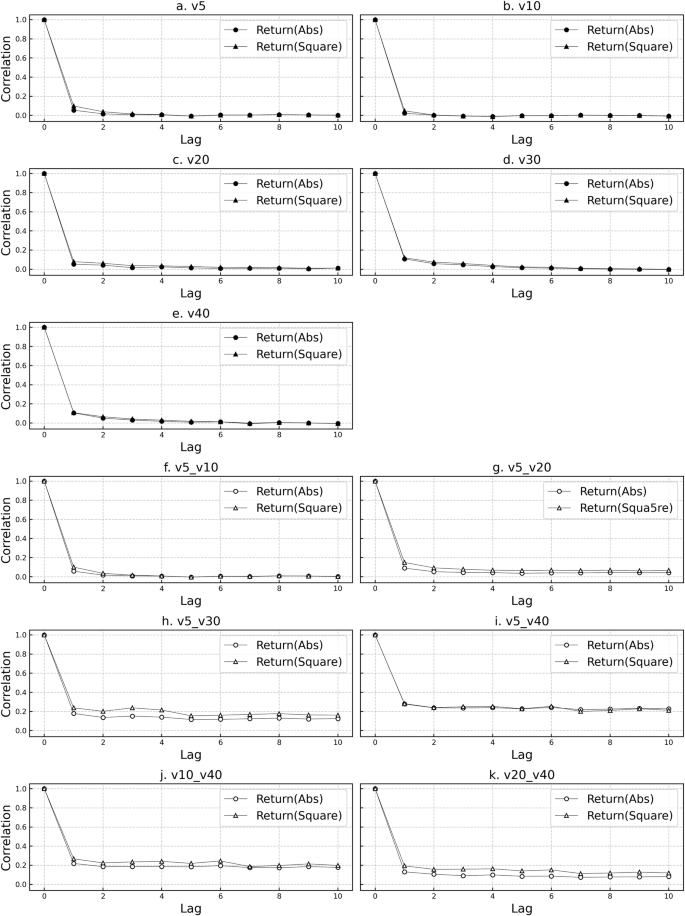
Absolute value and squared autocorrelation of returns/volatility clustering
The absolute value and squared autocorrelation of returns are reported to be positively significant and tend to decrease slowly over time. The presence of autocorrelation in the squared returns at constant lags implies that market volatility persists to some extent, a phenomenon generally referred to as volatility clustering. Positive autocorrelation is observed in both the absolute value and the squared returns of tick-by-tick transactions in the EBS data, with a decreasing trend, confirming the presence of volatility clustering (Fig. 3). However, it is noted that in these data, the autocorrelation of absolute returns is not necessarily greater than that of squared returns.
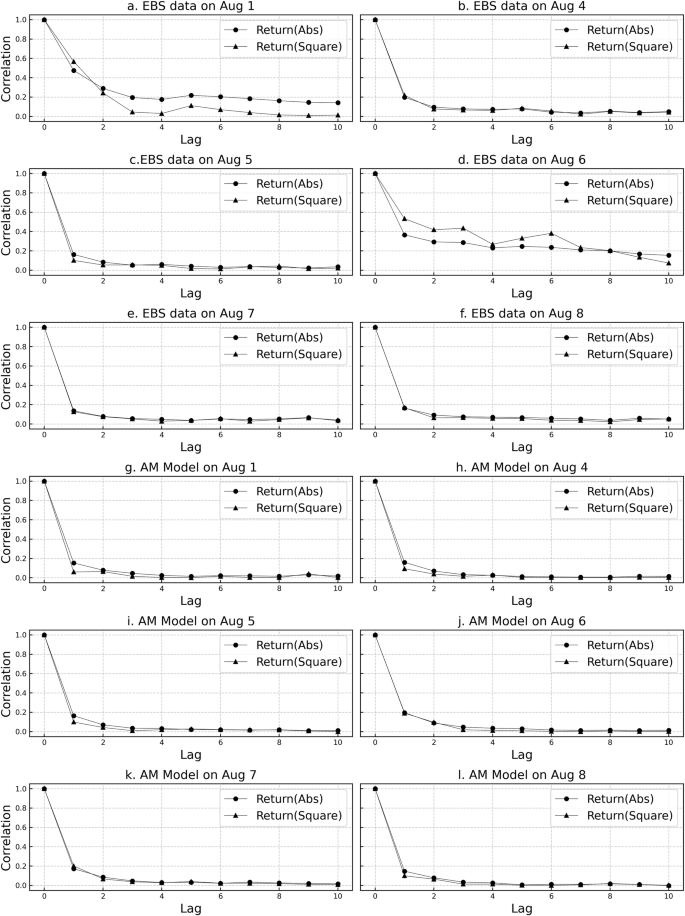
Note: Results for the 6 business days from August 1 to August 8, 2014, are illustrated in (a–l), with each panel depicting data from a specific day. a–f Show transaction prices on the EBS platform, while g–l illustrate transaction prices generated by the Artificial Market Model.
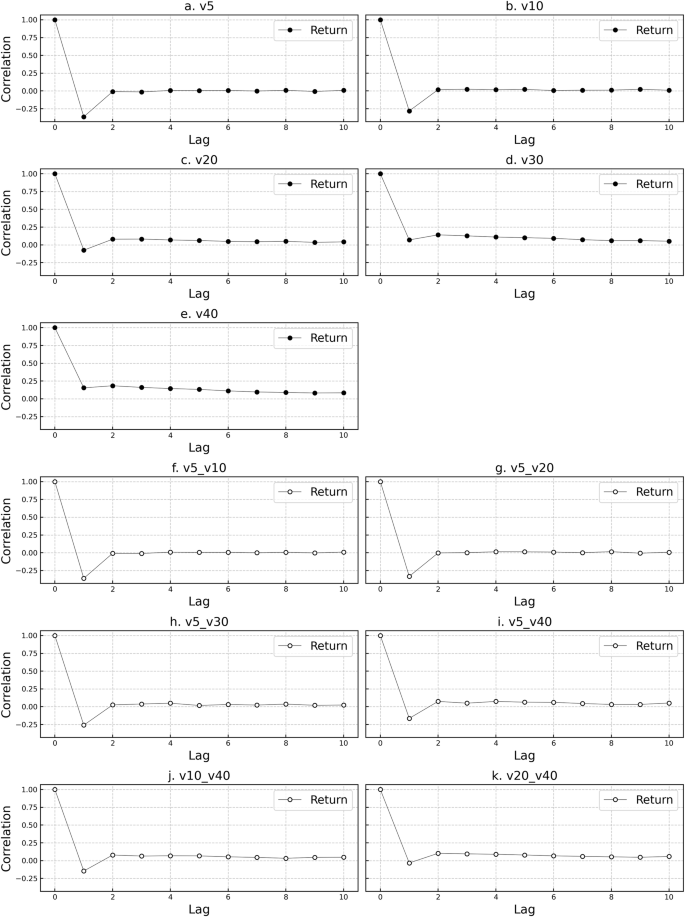
Autocorrelation of returns
It is well known that significant autocorrelation in price movements is not observed in highly liquid markets, with autocorrelation typically approaching zero at relatively short lags, although there may be differences across markets. The absence of linearity in this correlation is often cited as supporting the efficient market hypothesis. Moreover, in the realm of HFT, negative autocorrelation is observed at very short lags. This phenomenon is attributed to trading occurring near the bid and ask prices, leading to a tendency to bounce between the two prices (bid-ask bounce). Negative autocorrelation is also observed at the bid and ask levels, indicating rapid price mean reversion at the tick level, possibly due to market maker activity. In the forex market, negative autocorrelation at lag 1 in tick-by-tick data has been reported by Zhou (1996) and Cont (2001).
The autocorrelation of returns (rate differentials) with tick-by-tick lags for EBS transaction price tick data is negative at lag 1 for all dates, as reported in many studies, followed by near-zero autocorrelation thereafter (Fig. 4).
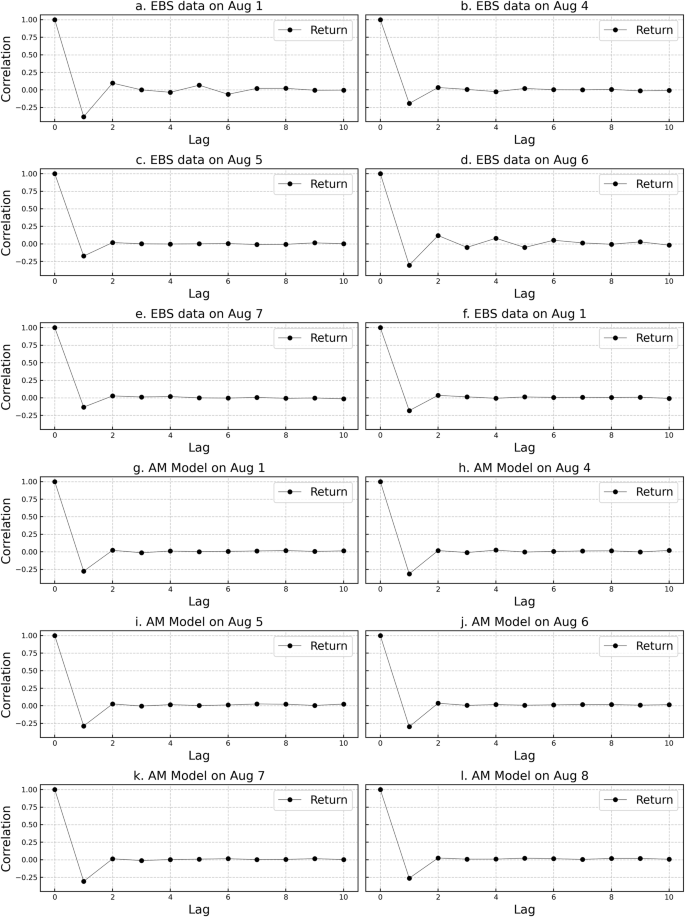
Results for the 6 business days from August 1 to August 8, 2014 are illustrated in (a–l), with each panel depicting data from a specific day. a–f Show transaction prices on the EBS platform, while (g–l) illustrate transaction prices generated by the Artificial Market Model.
Scaling law
A scaling law refers to a certain regularity or pattern across different scales, such as observed behaviors in price movements at different time intervals. Scaling laws have been discovered in various relationships, and numerous reports on scaling laws in forex markets can be found, as evidenced by Müller et al. (1990). One of the simplest forms of scaling law is represented by the following equation:
where (Delta t) represents the time interval and (left|{overline{Delta x}}right|) denotes the average absolute value of the price changes over that time interval. Here, (c) and (E) are constants. This equation takes on a power-law form, and the validity of the relationship can be confirmed by plotting both sides on a logarithmic scale, resulting in a linear relationship. The slope of the resulting line, known as the drift exponent, is equal to (1/E). A drift exponent of 0.5 indicates that fluctuations are determined by the square root of time changes, behaving like a random walk. However, when the drift exponent is greater than 0.5, it suggests the presence of a relationship that cannot be explained by a simple random process.
The tick data of EBS trading prices are converted into one-second intervals. Subsequently, logarithmic differences are further log-transformed for time intervals between 1 s and 5–30 s at 5-second intervals and for time intervals between 1 min and 5–60 min at 5-minute intervals. As a result, for all days of data, the coefficient of determination exceeds 98%, indicating that the scaling law holds true. Additionally, the drift exponent is approximately 0.6, which is consistent with the values reported in previous studies, confirming that price fluctuations are not a type of random walk (Fig. 5).
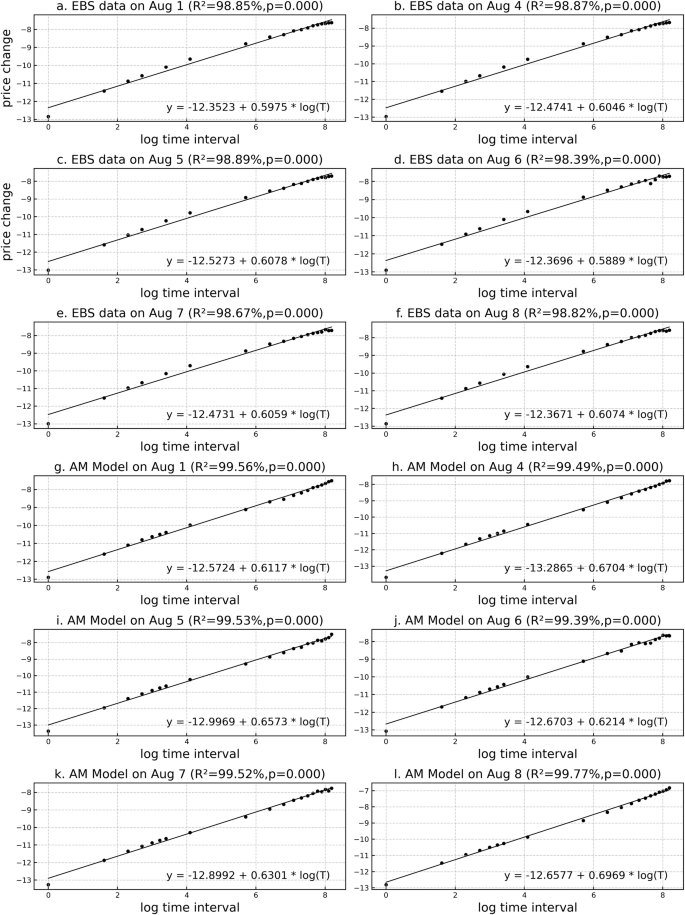
Results for the 6 business days from August 1 to 8, 2014 are illustrated in (a–l), with each panel depicting data from a specific day. a–f Show transaction prices on the EBS platform, while (g–l) illustrate transaction prices generated by the Artificial Market Model. The tick data are converted into one-second intervals. Subsequently, logarithmic differences are further log-transformed for time intervals between 1 s and 5–30 s at 5-second intervals and for time intervals between 1 min and 5–60 min at 5 min intervals. Then the horizontal axis represents the logarithm of time intervals in seconds, and the vertical axis represents the logarithm of the differences in logarithmic prices. The lines depict the regression lines calculated for each day, and the R² value is shown for each day.
Analysis and results
Stylized facts in the artificial market model
Previous research has demonstrated that artificial market models are validated through their ability to replicate stylized facts. In numerous studies, agents such as fundamentalists and chartists have been identified as key contributors to the emergence of these stylized facts. Specifically, discussions concerning fundamentalists often emphasize the significance of the fundamental price and its underlying information. Moreover, within the context of market microstructure, which investigates the relationship between price and trading volume, the analysis is predominantly informed by data, as exemplified by prevalent information-based models.
Conversely, the current study develops an artificial foreign exchange market model that successfully replicates five stylized facts, utilizing order flow as the sole input and eschewing traditional reliance on agents such as fundamentalists and chartists or the presupposition of market-related information. This model is framed within the context of market microstructure, drawing upon the foundational work of Evans and Lyons (1999), with a particular focus on market makers and order flow dynamics.
Specifically, the artificial market model in this study uses real order flow data as input and aligns with the calendar effects in order flow. We further verify this in Section “Verification of the mechanism for generating stylized facts using the artificial market model”, but it is believed that the stylized facts regarding order flow serve as factors contributing to the occurrence of other stylized facts such as fat tails and volatility clustering. Additionally, we confirm that other stylized facts, including kurtosis/fat tails, the absolute and squared autocorrelation of returns, the autocorrelation of returns, and scaling, are replicated in the rates generated by the artificial market. The results are presented in Table 1 and Figs. 3 to 5.
Comparison with actual data
We calculate the correlation coefficient between the market rates generated by the artificial market model and the actual data from the EBS platform, confirming that the general trend of market rates is captured by the very simple artificial market model. Additionally, we plot the scatterplot of order flow against rate differentials and examine the relationship between order flow and market rates generated by the artificial market model through regression analysis.
First, the correlation coefficients between the average market rates generated by the artificial market (path=100) and the corresponding actual data from the EBS platform were 85.28% on August 1, 2014, 72.12% on August 4, 57.41% on August 5, 49.69% on August 6, 73.41% on August 7, and 51.63% on August 8. The correlation ranges from a minimum of 49.69% to a maximum of 85.28%, indicating its consistency. For reference, Fig. 6 shows the comparison between the actual trading rates from the EBS platform and the generated data for August 1, 2014.
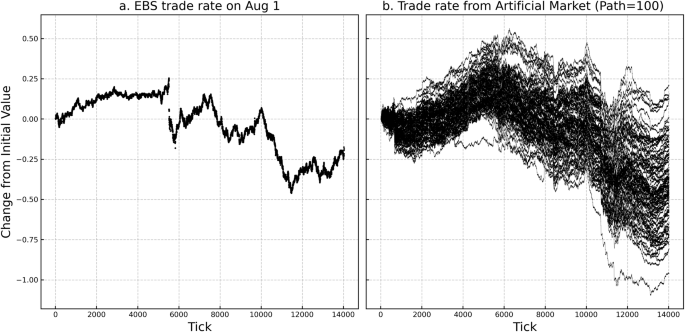
Note: The horizontal axis represents ticks, and the vertical axis represents the difference from the initial value of the rate. a Displays transaction price movements observed on the EBS platform, while (b) shows transaction prices simulated in the artificial market.
Next, scatterplots are created to show the difference between order flow and rates, and regression analysis is conducted. As shown in Fig. 7, a significant positive correlation is observed, with a coefficient of determination (R-squared) of approximately 35%. This finding is expected, as the structure of the artificial market is influenced by order flow, resulting in a naturally positive correlation. Here, it is important to highlight the inability to achieve a coefficient of determination close to 100%, despite order flow being the sole determinant of market prices, apart from the behavior of uniformly generated customer order flow and deterministic market makers. In other words, even if the coefficient of determination for order flow in the actual data is approximately 30–40%, it does not necessarily imply the presence of hidden factors. Essentially, this result suggests that while order flow may account for most of the price determination, the involvement of microstructures via market makers can lead to a lower coefficient of determination than the actual impact of order flow.
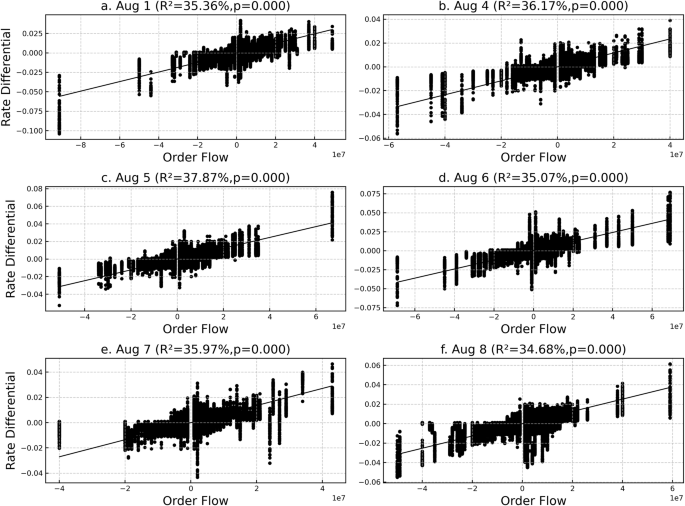
Note: The horizontal axis represents the order flow (in million USD), and the vertical axis represents the differences in rates. The lines depict the regression lines calculated for each day, and the R2 value is shown for each day. In addition, all p values are <0.01%. a–f Correspond to data from August 1, 4, 5, 6, 7, and 8, respectively.
Verification of the mechanism for generating stylized facts using the artificial market model
To verify the mechanism through which stylized facts can be generated, simulations are conducted without using actual transaction data from the EBS platform. Interdealer order flow is generated using uniform random numbers such as customer order flow. For this order flow, the time intervals between occurrences are generated with uniform random numbers based on the minimum timestamp (100 milliseconds) using the set average value as a reference. The order flow is configured with a common maximum amount for buying and selling, and uniform random numbers are generated based on a minimum unit of one million dollars. The settings for order flow include setting the maximum value to 5 million dollars (discrete values in increments of one million dollars, from -5 million dollars to 5 million dollars), 10 million dollars, 20 million dollars, 30 million dollars, and 40 million dollars (denoted as v5, v10, v20, v30, and v40, respectively). Additionally, to simulate the calendar effect of order flow, the maximum value is set to 5 million dollars for the base data and then adjusted to 10 million dollars, 20 million dollars, 30 million dollars, and 40 million dollars only for the one-hour period from GMT 1:00 to 2:00 (denoted as v5_v10, v5_v20, v5_v30, and v5_v40, respectively). A simulation is also conducted by comparing v5_v40 with the base order flow, where the maximum value of 5 million dollars is adjusted to 10 and 20 million dollars. These results are presented in Table 2 and Figs. 8 to 10.
Note: Results with maximum order flow values of 5, 10, 20, 30, and 40 million dollars, labeled as v5, v10, v20, v30, and v40, respectively, are shown in (a–e). Order flow for the 1-h time slot from GMT 1:00 to 2:00, initially set at 5 million dollars, is compared to scenarios with maximums of 10, 20, 30, and 40 million dollars, as well as 40 million dollars compared to 10 and 20 million dollars, illustrated in (f–k).
Note: Results with maximum order flow values of 5, 10, 20, 30, and 40 million dollars, labeled as v5, v10, v20, v30, and v40, respectively, are shown in (a–e). Order flow for the 1 h time slot from GMT 1:00 to 2:00, initially set at 5 million dollars, is compared to scenarios with maximums of 10, 20, 30, and 40 million dollars, as well as 40 million dollars compared to 10 and 20 million dollars, illustrated in (f–k).
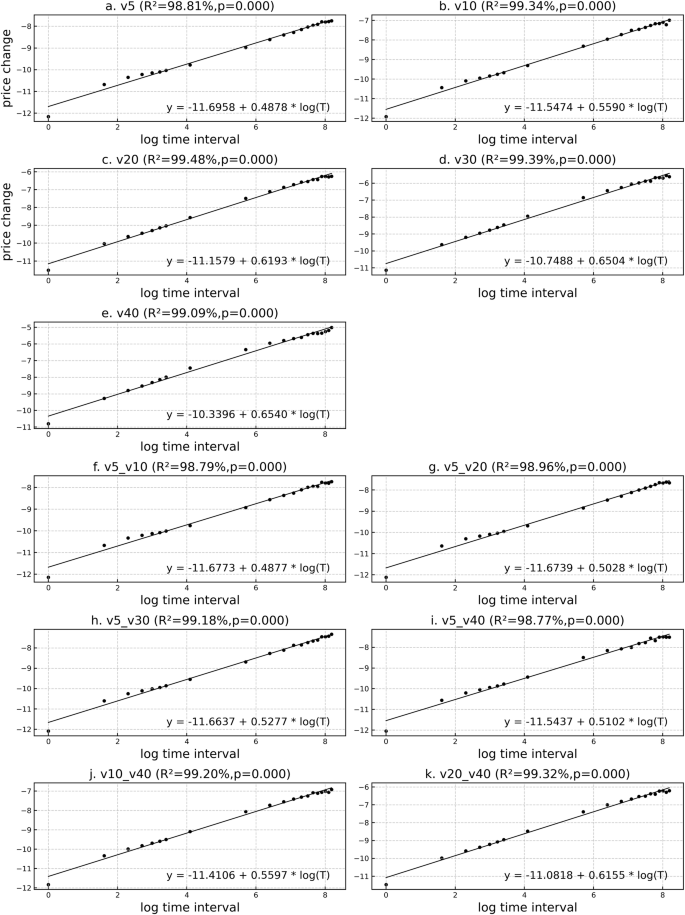
Note: Results with maximum order flow values of 5, 10, 20, 30, and 40 million dollars, labeled as v5, v10, v20, v30, and v40, respectively, are shown in (a–e). Order flow for the 1-h time slot from GMT 1:00 to 2:00, initially set at 5 million dollars, is compared to scenarios with maximums of 10, 20, 30, and 40 million dollars, as well as 40 million dollars compared to 10 and 20 million dollars, illustrated in (f–k). The horizontal axis represents the logarithmic values of time intervals in seconds, and the vertical axis represents the logarithm of the differences in logarithmic prices.
By comparing these simulation results, it can be inferred that mechanisms such as fat tails or volatility clustering occur when there is a certain difference in volume between periods of concentrated and nonconcentrated order flow. Additionally, regarding the autocorrelation of returns, a trend in which the negative autocorrelation occurring at lag 1 decreases in absolute value with increasing volume is observed. Furthermore, it is evident that the relationship between this autocorrelation and scaling does not arise from the concentration of order flow at specific times but rather from the overall level of volume, which creates a general trend of randomness.
Discussion
Validity of the artificial market model
Given that the foreign exchange market operates as a market-making system and that universally agreed-upon fundamental prices or fair values are generally absent, this study incorporates the hot potato model, a real business structure comprising generally unobservable customer order flows and observable interdealer order flows, into the artificial market model alongside market makers as agents. As confirmed in Section “Stylized facts in the artificial market model”, this approach allows us to obtain results consistent with five stylized facts, supporting the adequacy of the model. Furthermore, the fact that similar results have been obtained using an approach different from many previous studies, which replicate stylized facts by simulating fundamentalists and chartists as agents, may provide a fresh perspective for this research domain.
Importance of order flow
This artificial market model comprises market makers and order flows, with market makers serving primarily as environmental factors in the market. Market prices strongly rely on order flows. By excluding position shifts or if position shifts are also considered indirect factors of order flow, it can be argued that practically 100% of market prices are determined by order flow. However, despite the significant dependence of market prices on order flow, as discussed in Section “Comparison with actual data”, it is observed that the coefficient of determination between order flows and rates does not come close to 100% but rather hovers around 30–40%. In reinterpreting the results from our perspective in Evans and Lyons (2002), where adding order flow as an explanatory variable enabled the explanation of more than 40% of the daily fluctuations in the yen/dollar exchange rate, it can be suggested that rather than assuming the existence of hidden factors explaining the remaining 60% of exchange rate movements, there may be a market structure in which the influence of order flow factors, even if they essentially account for the majority of price fluctuations, is offset or amplified through the interaction between customer order flows via market makers. This situation can result in coefficients of determination that are lower than those suggested by the actual impact. In essence, this finding suggests that in the market’s price determination mechanism, order flow may exert more influence than what has been demonstrated in previous studies regarding coefficients of determination. Furthermore, our artificial market model, with its simple structure, successfully replicates many stylized facts and demonstrates a certain explanatory power concerning actual exchange rates, suggesting that our findings contradict the traditional hypothesis that unknown mechanisms, including factors beyond information traders, are significant determinants of market price.
Discussion on the emergence of stylized facts
The mechanism by which our artificial market model generates stylized facts is rooted in market makers manipulating prices to maximize their profits. This manipulation causes bid-ask bounces, leading to negative autocorrelation in returns at lag 1. In those markets in which these market makers provide liquidity, a phenomenon known as the order flow calendar effect exists, resulting in thick and thin periods of order flow. This phenomenon induces fat tails and volatility clustering. Furthermore, regarding scaling law, it is confirmed that a certain level of order flow is necessary. Thus, this study suggests that despite the significant role traditionally attributed to information traders and agents employing technical trading strategies in previous research on market microstructure and artificial market models, reproducing numerous stylized facts does not necessarily require the assumption of these agents. Indeed, while the presence of these market makers and the order flow calendar effect are commonly observed in the foreign exchange market, there is a debate as to whether market participants acting as information traders can consistently influence the mechanism of exchange rates, given the absence of universally agreed-upon fundamental prices or fair values in the forex market. Additionally, while there may be effects where chartists or technical traders amplify stylized facts during market fluctuations, it is difficult for all actors to agree on whether these stylized facts play a significant role in generating these fluctuations or whether their influence on the market mechanism is consistently substantial.
Discussion of the hot potato and information models
The hot potato model comprises the following two significant aspects: dividing customer order flow and interdealer order flow to reflect the real market structure and the phenomenon in which the degree of dealer-to-dealer trading increases as dealers repeatedly hit other dealers’ quoted prices in the interbank market to offset inventory risks. Conversely, this study focuses primarily on replicating stylized facts and confirming the validity of the artificial market model. Therefore, interdealer order flow is based on real data, and the mechanism of increasing trading volume in the latter case is deliberately not incorporated. While this aspect remains a theme for model extension, this discussion also examines the role and significance of adopting the former market structure, including its relevance to the information model.
The information model is based on the concept that market makers suffer losses from informed traders and must profit from uninformed traders to cover these losses, which leads to the generation of bid-ask spreads. In this model, it is crucial to note that market makers cannot distinguish between informed and uninformed traders. However, in the foreign exchange market, with whom the trades are made is generally known, and market makers can avoid losses by providing appropriate bid-ask spreads to customers as part of their business strategy. Therefore, it is natural to consider that market makers participate in interdealer trading to hedge or, in some cases, speculate on risks already in a profit-making position due to customer order flow rather than to recover losses from customer order flow in the interbank market. Indeed, in this artificial market model, it is confirmed through simulations that the profits of market makers resulting from customer order flow are always positive (even if there are cases of negative profits, adjusting bid-ask spreads for customer order flow ensures positive profits in simulations, as there are no specific constraints on bid-ask spreads for customer order flow). Therefore, the significance of incorporating the structure of dividing customer order flow and interdealer order flow in the hot potato model lies not only in generating order flows that do not lead to order shifts but also in reducing the importance of discussions about the optimal bid-ask spreads as part of the information model (rendering them meaningless) and eliminating the need for discussions on constraints to prevent market makers from ceasing business due to losses.
Conclusions
In this study, we develop an artificial market model that can replicate a wide range of stylized facts observed in the foreign exchange market through a simplified framework consisting only of market maker agents and order flow. Contrary to previous artificial market model research, which often posits the necessity for specialized agents such as information traders or those implementing technical strategies, our findings indicate that such specialized agents are not required for the emergence of stylized facts. Specifically, we find that the calendar effect in order flow alone can lead to phenomena such as kurtosis/fat tails and both the absolute and squared autocorrelation of returns.
Additionally, the importance of order flow highlighted in this study complements the results of Evans and Lyons (2002) and suggests that even in our artificial market model, where order flow constitutes virtually 100% of the exogenous factors, the determination coefficient for the exchange rate is approximately 35%. This finding implies that the impact of order flow as a determinant of exchange rates may be greater than that indicated by the directly calculated determination coefficient.
Another significant contribution of this study is that it demonstrates a certain explanatory power for actual exchange rates using a simple structure, where the order flow itself serves as a direct determinant of rate fluctuations. This approach is in contrast to the conventional approach suggesting the presence of unknown mechanisms, where predictive agents exert a significant influence on the market or where order flow transmits some external information. Moreover, while fat tails and volatility clustering can be relatively easily induced by the existence of a calendar effect, a certain level of randomness is necessary for scaling law. It is observed that an excessive degree of autocorrelation due to this randomness can eliminate the negative autocorrelation of returns at lag 1. This discovery not only elucidates the mechanisms behind the emergence and disappearance of each stylized fact but also corroborates the stability of such facts in real markets, further validating the utility of our artificial market model.
On the other hand, order flow, which plays a crucial role in this model, is not widely available to the public and must be purchased from vendors, similar to data from the EBS platform used for interbank order flow. Additionally, customer order flow, which in this model is represented by uniform random numbers, is individually maintained by each market maker (i.e., each financial institution) and is typically not disclosed. Therefore, even if this model accurately represents the market mechanism, the absence of this data means the market cannot be fully replicated. Moreover, the behavior of market makers varies with market conditions and is likely to become more complex due to technological advancements and the increasing sophistication of algorithms, indicating that this artificial market model will need to evolve accordingly.
For future challenges and developments, the validated artificial market model offers a promising framework for advancing both theoretical and practical applications. This includes its use in simulating market dynamics, execution algorithm strategies, and market-making strategies. For execution algorithms, the model allows for the analysis of how trading strategies interact with market conditions, providing insights into optimizing execution efficiency and minimizing market impact. For market-making strategies, it can be used to explore critical decisions such as determining the optimal market spread and devising effective hedging methods for positions, while evaluating their effects on market liquidity and profitability under realistic conditions.
Additionally, the model enables a deeper exploration of the properties of generated rates over both short and long-time horizons. Short-term investigations could focus on rate fluctuations, volatility patterns, and rapid market responses to external stimuli, while long-term simulations may provide insights into trends, regime shifts, and the cumulative impact of trading strategies. Furthermore, the model’s ability to produce realistic rate data opens up applications in financial engineering, such as the pricing and risk management of complex instruments such as currency options and other foreign exchange derivatives. By integrating key market features and stylized facts, the artificial market model can enhance the accuracy and reliability of derivative valuation, hedging strategies, and overall risk management.
Responses