An automated high-throughput lighting system for screening photosynthetic microorganisms in plate-based formats

Introduction
Microalgae represented by prokaryotic and eukaryotic photosynthetic microorganisms are primary producers that play integral roles in food web structures and global biogeochemical cycling1,2. In addition to these roles, the capacity of microalgae to sequester carbon dioxide (CO2) into a range on organic compounds, including biopolymers, lipids, and bioactive molecules, makes them interesting targets for industrial carbon fixation and sustainable manufacturing3,4,5,6,7,8,9. Microalgae are also important model organisms in the study of photosynthesis, optogenetics and evolution, representing some of the oldest and most diverse prokaryotic and eukaryotic phyla10. Despite their recognized potential for sustainable bioproduction, current applications of photosynthetic microorganisms as microbial cell factories remain in early stages of development8,11,12. This is partly due to a limited number of tractable genetic systems13,14,15,16,17,18, compounded by a lack of platforms supporting high-throughput cultivation at laboratory scale19. This latter issue makes it difficult to conduct functional screens, select strains, or optimize growth conditions for energy and materials production using multifactorial experimental design.
Standard flask and photobioreactor-based cultivation systems currently limit throughput to 10 s of individual conditions or strains19. One of the reasons for this constraint is that microalgal cultures are highly sensitive to changes in growth conditions, with consistent light availability and sufficient gas exchange being a prerequisite to controlled experimentation20,21,22,23. This presents additional engineering challenges associated with the design of high-throughput systems in comparison to heterotrophs19, such as E. coli and yeast, where energy sources like sugars can be provided in growth medium at even abundances. Several strategies have been employed to address these limitations and increase throughput of microalgal screening, with varying trade-offs associated with each method. Pooled selection allows for targeted enrichment of strains that perform best under specific growth conditions from pools of 10,000 s to 1,000,000 s of distinct genotypes15,24,25. Although this strategy can be very useful for large library screening, the desired phenotype must provide a fitness benefit and all strains are subjected to the same set of growth conditions. This can be very effective in recovering strains that grow under extremes of pH, temperature, or salinity, etc., but may not be transferrable to screening paradigms investigating specific biosynthetic processes or traits not directly associated with growth rate. Individual strains from the resulting enrichment still require isolation and validation at scale, potentially limiting the scalability of these strategies. Droplet- or flow-cytometry-based screening is an alternative solution involving the encapsulation of individual cells in droplets that can be incubated before sorting or direct sorting of cells based of fluorescence or absorbance15,20,26,27. This strategy enables the screening of 10,000 s to 100,000 s of distinct genotypes, the application of alternative assays, and generation of concentration gradients within droplets20. Although multiple rounds of either selection of droplet-based screening can lead to hit enrichment, both methods are likely to result in false positives that require extensive rounds of downstream isolate validation.
Microplate or micro-photobioreactor (micro-PBR)-based screening systems have been explored to enable intermediate-throughput screening of 10 s to 1000 s of individual cultures28,29,30,31,32,33,34. Several devices have been constructed for photosynthetic microorganism cultivation and optogenetics, enabling well-level control of light intensity in 24 to 96-well formats21,28,31,33,34. Although this throughput is limited in comparison to pooled and droplet-based screening, the format of these systems enables the testing of distinct medium compositions on clonal populations or synthetic consortia30,31,35 under a wide range of growth conditions36. The optimization of medium compositions, through the parallel testing of distinct growth conditions, enables the identification of limiting resources and shifting of selective pressures to drive processes of interest31,35,37,38,39, a prerequisite for metabolic engineering applications, which are often selected against under standard cultivation conditions40,41,42,43. However, current lighting systems developed for microplate screening or for optogenetics involve either specialized stand-alone devices (one 24 to 96-well plate)22,28,33,34,44,45, or the manual placement of microplates across an illuminated surface, also limiting throughput23,30,46.
Here we design, build, and test a consistent lighting system that can be integrated into standard laboratory automation infrastructure for microplate screening. This enables users to leverage existing infrastructure for the parallel screening of 100 s to 10,000 s of photosynthetic or photo-responsive microorganisms while expanding the range of assays amenable to microplate formats. We demonstrate the utility and extensibility of this system using both prokaryotic and eukaryotic microalgae including Synechococcus elongatus UTEX 2973, Nostoc hatei CUBC1040, and Chlamydomonas reinhardtii UTEX 90.
Results & discussion
Existing HTP lighting systems
Several strategies and engineering solutions have been developed for the high-throughput screening of photosynthetic microorganisms or other photoresponsive systems31,45. Table 1 gives an overview of existing screening systems, including throughput capacity, tested strains, scalability, controllability, cost, limitations, and other technical specifications.
Many of these devices enable precise control of well-level light intensities, allowing researchers to study how light influences the activity of photosynthetic strains and optogenetic circuits. However, most of these systems are standalone devices that were not designed with increased scalability in mind, with the majority supporting 24–96 cultures in parallel31,45. Only some of these leverage standardized laboratory consumables, such as microplates, limiting available assays and ease of downstream processing. More high-throughput screening of microalgae has relied on manual placement of microplates on a flat illuminated surface, limiting automation potential and precise control of light intensity and humidity30. There is therefore a need for lighting systems supporting high-throughput screening of photosynthetic or photo-responsive microorganisms and optogenetic circuits based on integration into existing laboratory automation infrastructure. This need helped define engineering requirements for the lighting system described here.
Defining functional requirements
To design and build a lighting system for high-throughput microplate screening in standardized automation infrastructure (e.g., Cytomat 5 C450 incubator, Thermo Fisher Scientific), a set of functional requirements was defined. First, the system needed to provide even and consistent light intensity and spectrum across a 384-well microplate. Although light availability has a significant impact on metabolic activity and growth rate in cyanobacteria, most studies investigate the impacts of 2–10-fold variations in light intensity47,48. It has been observed that the most significant variations in growth rate based on light availability are under light-limiting conditions47,49. To attempt to set light intensity variability thresholds for the system, we leveraged a protein economy model of Synochocystis sp. PCC 6803 to investigate the impact of variable light intensity on cyanobacterial growth rate and protein production47. Protein economy models are theoretical frameworks used to understand the allocation of resources and energy toward protein production and maintenance within cells47,50. These models enable the study of trade-offs in cellular functions, such as growth and stress response, and are useful in predicting the impact of light intensity on metabolic activity and resource allocation50.
A model of Synochocystis sp. PCC 6803 was used to approximate steady-state growth rates and cellular component concentrations at increments of 10 μmol m−2 s−1 from 20–1000 μmol m−2 s−1 (Supplementary Fig. 6A, B). Relative concentrations of cellular components and the rate of change of concentrations were calculated across light intensities and growth rates (Supplementary Fig. 6C, D). Results confirmed that the most significant variability in protein and metabolite concentrations were in light limiting conditions. Above 100 μmol m−2 s−1, which resulted in a growth rate of 46.9% the maximum observed growth rate, the variability in protein and metabolite concentrations decreases substantially as growth rate nears its maximum (Supplementary Fig. 6E, F). Although modelling indicated that growth rate is not directly proportional to metabolic activity or gene expression, minimizing variability in growth rate will result in decreased variability of metabolic activity when light availability is not limiting. Based on these results, we decided to target <5% variability in growth in non-light-limited conditions. Second, under these conditions, light intensity needed to be adjustable between 50 μmol m−2 s−1 and 500 μmol m−2 s−1 for up to 50 384-well plates simultaneously, corresponding to 19,200 individual wells. Third, the system needed to conform to standard form-factors, as defined by the Society for Laboratory Automation and Screening (SLAS), for integration into the Cytomat 5 C450 incubator or other automation infrastructure. Finally, we considered five non-functional requirements to improve extensibility and accessibility, including that the system should be 1) modular and customizable, 2) constructed with parts that are easily accessible or can be printed or ordered to the defined specifications, 3) cost < $10,000 CAD ( < 10% of cost of Cytomat 5 C450 incubator and < 1% cost of automation infrastructure), 4) tolerate up to 85% humidity, and 5) cleanable with distilled water or 70% ethanol or isopropanol. The combined requirement set directed choices related to component selection, and the design of electrical circuits and software (Fig. 1A).

A Each of 5 racks can hold up to 10 LED arrays and microplates, enabling the screening of up to 3840 distinct cultures per rack, for a total incubator capacity of 19,200 cultures. LED array and support frame are placed directly beneath microplates and provide illumination upwards. Terminal blocks are mounted to each rack to connect to slipring and split power between LED arrays. An additional intermediate set of terminal blocks is required to split power between multiple racks. The slipring and slipring connector enable rotation of the carousel within the Cytomat 5 C450 incubator. A single set of positive and negative wires connects slipring to the LED driver and dimming circuit. B LED array and support structure conform to the form factor of standard 384-well microplates, as defined by the Society for Laboratory Automation and Screening (SLAS). 384 individual LEDs sit directly beneath wells. Grooves in the support structure secure the LED array and ridges on the outside of the structure ensure proper placement within the Cytomat 5 C450 rack. This figure was generated by Arman Aituar.
Electrical circuit design
Several lighting systems have been developed enabling well-level control of light intensity across a 96-well plate, for application in cultivation of photosynthetic microorganisms and optogenetics21,28,34,44,45,51. Although these systems are useful when investigating the impact of light intensity on a given biological process, this level of control requires complicated circuitry connecting individual LEDs to a controller, resulting in standalone devices that could not easily be scaled to multiple plates or integrated into automation systems. The system described here was designed to maintain consistent lighting across microplates and is strictly limited in form factor for integration into standard automation infrastructure.
To satisfy these requirements, a metal plate-based LED array with single positive and negative connections provided a suitable solution. We custom-manufactured 384-LED arrays, with LED positioning matching the position of wells in a 384-well microplate, which would result in 4 LEDs per well in a standard 96-well microplate and 32 LEDs per well in a standard 12-well plate (Supplementary Fig. 14). Initially these were manufactured on copper and superconducting aluminium alloy plates for heat distribution, with either 4044 K, 5091 K or 6083 K broad-spectrum LEDs (400 nm to 750 nm) (Supplementary Fig. 18). Each 384-LED array includes 24 parallel series of 16 LEDs and requires approximately 48 volts (V) of power and supports a current of up to 150 mA. The manufacturers specified 40°C to 60°C as the optimal working temperature range of LEDs, with a maximum range of 80°C to 90°C. As these LED arrays are the primary functional component of the lighting system, additional structures were designed to accommodate these arrays including a supporting structure to maintain the position of the LED array in relationship to the microplate allowing airflow across the LED array facilitating heat dispersion (Fig. 1B). The design conforms to SLAS standard microplate dimension52, with ridges for simplified placement of the LED array in a Cytomat 5 C450 incubator (Supplementary File 1). These ridges may need to be adjusted for alternative incubation systems.
The electrical circuit was designed to enable powering and controlling of multiple LED arrays simultaneously while accommodating LED power requirements and the lighting requirements defined above. The core structure of the designed circuit includes an LED driver, a dimming circuit, an Arduino UNO microcontroller, and the LED arrays in parallel (Supplementary Fig. 15). The LED driver provides 48 V of power to the LED arrays and enables the adjusting of current and resulting light-intensity. Current output of the LED driver is controlled by the dimming circuit, which relays the pulse-width-modulation (PWM) signal from the Arduino UNO to the LED driver. This signal can be defined by modifying Arduino code, enabling the defining of light intensity emitted by LED arrays. Electrical components were selected to conform to design specifications and enable assembly of a circuit able to power LED arrays based on user-defined specifications. Downstream testing of individual components and optimization of cultivation conditions was required to validate the resulting lighting system.
Component validation
High-throughput screening requires consideration of single-well microenvironments and maintenance of consistent growth conditions between wells and microplates. Although LEDs are more energy efficient than incandescent and fluorescent lights, they also generate heat, and proximity of LEDs on the array to cells in wells could produce localized regions of increased or variable temperature53. We used mounting media consisting of copper, which is the industry-standard material for heat distribution and conductivity, and a superconducting aluminium alloy in the design of the LED arrays. Both metals should distribute heat generated by the LEDs across the plate, enabling more efficient conduction in a temperature-controlled incubator. This was tested in a series of experiments using photodiodes and thermistors, to monitor light intensity and temperature when operating over periods of 16 h at currents of 10 mA. Significant differences in temperature variance (70 mA: F(3029,2923) = 0.0052, p < 2.2 × 10^−16, Cohen’s d = 7.72; 10 mA: F(5746,5726) = 0.51, p < 2.2 × 10^−16, Cohen’s d = 0.87) and light variance (70 mA: F(3065,2967) = 0.094, p < 2.2 × 10^−16, Cohen’s d = 6.78; 10 mA: F(5837,5807) = 0.26, p < 2.2 × 10^−16, Cohen’s d = 1.39) were observed between copper- and aluminium-mounted LED arrays at both currents (Supplementary Fig. 16). Here, copper-mounted LED arrays exhibited significantly more variability (Supplementary Fig. 17A), with a mean standard deviation in light intensity of 1.47 100 μmol m−2 s−1 and 5.16 μmol m−2 s−1 at 10 mA and 70 mA, respectively, in comparison to 0.56 μmol m−2 s−1 and 0.52 μmol m−2 s−1 for superconducting aluminium-mounted arrays. This variability was mirrored by temperature fluctuations, with mean standard deviations of 0.88 °C and 3.53 °C exhibited by copper-mounted arrays and 0.31 °C and 0.29 °C exhibited by aluminium-mounted arrays at 10 mA and 70 mA. Results also indicated a positive correlation between temperature and light intensity (Supplementary Fig. 17A). LEDs typically manifest the inverse relationship, where an increase in temperature leads to a decrease in light emission intensity54. This may indicate that the observed temperature variability was a function of current fluctuations resulting in temporal changes in light intensity and heat production. As the copper-mounted LED arrays exhibited significantly more variability in temperature and light intensity, we selected the superconducting aluminium arrays for downstream system design.
Configuration testing
A series of growth experiments using fast-growing Synechococcus elongatus UTEX 2973 was conducted to identify suitable cultivation conditions for microplate growth using the lighting system. 384-well plates were used as they provide a higher level of granularity in potential inter-well variability on a single microplate. These experiments explored various LED spectra, use of different seals or lids for microplates during cultivation, positioning of LED arrays in relation to microplates, and selection of microplate types for cultivation and screening. These experiments were designed to identify cultivation conditions minimizing variability in growth rate and photopigment production across a microplate. Photopigment production in cyanobacteria, including light-harvesting pigments and photoprotective carotenoids, is highly dependent on light intensity and associated with metabolic state55. Observing pigment production through absorption measurements at photopigment absorbance peaks, in addition to growth rate, provided insight into metabolism and light exposure across the microplate.
Selecting 5091 K light spectrum LED
Light spectrum has a significant impact on photosynthetic efficiency, photopigment biosynthesis, and growth rates in photosynthetic microorganisms49,56,57. This is a result of the varying absorption peaks of individual photopigments, including chlorophylls (430–475 nm and 630–700 nm), phycobilins (500–675 nm), and carotenoids (400–500 nm) that comprise photosynthetic light harvesting complexes49,57,58. The photosynthetic complexes of different microorganisms can be structured to more efficiently harvest certain wavelengths of light and genetic regulatory mechanisms can drive photopigment production in response to specific light spectra49,57,58. Cool white phosphor-converted-LEDs support growth by emitting broad spectrum photosynthetically active radiation (PAR), with emission peaks mirroring photopigment absorption peaks56,59. Based in this, broad-spectrum phosphor-converted-LED arrays were initially manufactured with colour temperatures of 4044 K, 5091 K and 6083 K (Supplementary Fig. 18). Emission spectra indicated 5091 K LEDs provided the most even light distribution across key photosynthetically active wavelengths (Supplementary Fig. 18). A cultivation experiment was also performed to investigate the impact of LED spectra on S. elongatus UTEX 2973 growth. S. elongatus UTEX 2973 pre-cultures in Erlenmeyer flasks were incubated for one week under each of the three LED spectra in isolation. Cultures were then transferred to a 384-well microplate for cultivation under the cognate LED spectra. 5091 K LEDs led to the highest median growth over a 3-day cultivation experiment (one-way ANOVA, F(2,1149) = 90.39, p < 2 × 10^−16, η2 = 0.14) (Supplementary Fig. 17B). An even emission spectrum and increased growth of S. elongatus UTEX 2973 led to the selection of the 5091 K array for downstream experiments. Specific strains and screening paradigms may benefit from alternative LED spectra.
Breathable seals increase growth rate and evenness
Although we observed a faster median growth rate under the 5091 K spectrum, we also noted substantial variability in optical density across all microplates, with the outside wells evaporating quickly, resulting in significantly decreased growth (Supplementary Fig. 19). These edge effects are common in high-throughput screening, often resulting from variability in gas exchange, humidity, or temperature across the plate. To mitigate the impact of these effects, we compared growth of S. elongatus UTEX 2973 in microplates with one of two breathable seals (AeraSeal [Excel Scientific, USA] and Breathe-Easy [Diversified Biotech, USA]) or transparent microplate lids. LEDs arrays were positioned beneath the microplate when sealed with translucent or opaque seals and positioned above the microplate with a transparent lid, as we observed that this led to decreased condensation on the lid. Results showed significant differences in growth depending on microplate seal (one-way ANOVA, F(2,1149) = 5108, p < 2 × 10^−16, η2 = 0.90 at Day 3) (Supplementary Fig. 17C/ Supplementary Fig. 20). Specifically, AeraSeal, an opaque woven-rayon seal with high-breathability, showed significantly higher growth compared to both Breathe-Easy (mean difference = −0.76, p < 2 × 10^−16) and the microplate lid (mean difference = −0.56, p < 2 × 10^−16) conditions, while the lid showed moderately higher growth than Breathe-Easy (mean difference = 0.20, p < 2 × 10^−16). As the AeraSeal seal is not amenable to automated microplate sealing and pealing infrastructure, downstream experimentation used PermASeal (ITS Scientific, UK), a woven paper-based seal that showed a comparable increase in growth. This seal works with the Agilent PlateLoc Thermal Microplate Sealer (Agilent, USA) incorporated into the automation infrastructure used in system testing. Alternative woven breathable seals should be considered depending on available instrumentation. The significant variability in growth based on seal selection is likely the result of variation in gas exchange rates and indicates the importance of considering gas exchange and circulation in relation to photosynthetic growth and the design of high-throughput lighting systems.
These experiments also suggested that evaporation rates may be an important consideration when selecting microplate seals. To explore this, we conducted experiments to measure the rate of evaporation from 384-well microplates. In these experiments, 384-well plates were loaded with S. elongatus UTEX 2973 culture or BG-11 medium and sealed with either the AeraSeal, Breathe-Easy, or PermASeal seals or with a transparent microplate lid. Plates were then loaded into the 5 C450 incubator and well volumes were measured every 24 h for 4 days using the Echo 525 acoustic liquid handling system. Results indicated that wells lose approximately 56.7 μL their volume after 96 hours, using breathable PermASeal seals, which is the highest evaporation rate of any seal type, but with less across-plate variability than microplate lids or Breathe-Easy rayon seals (Supplementary Fig. 21). Significant differences in evaporation were observed across plates sections for most seal types after 96 hours (PermASeal: F(7,376) = 2.78, p = 0.00788, Cohen’s f = 0.23; AeraSeal: F(7,376) = 7.61, p = 1.35 × 10^−8, Cohen’s f = 0.38; Nunc Lid: F(7,376) = 15.97, p < 2 × 10^−16, Cohen’s f = 0.55), with Breathe-Easy seals showing marginally significant differences (F(7,376) = 1.97, p = 0.0584, Cohen’s f = 0.19). Although differences were observed, the effect sizes suggest PermASeal and Breathe-Easy seals demonstrate a relatively low level of variations between plate sections. These differences highlight the importance of seal type in controlling evaporation rates, with experimental durations potentially limited to 72–96 h depending on incubator temperature and humidity control.
Close proximity of LEDs to microplate leads to even lighting
The selection of opaque woven seals for microplate sealing during cultivation experiments necessitates the placement of LED arrays below microplates, illuminating cultures through clear well bottoms. Each LED array and supporting structure was then positioned in place of a microplate directly below the cultivation microplate in the Cytomat 5 C450 incubator rack (Fig. 1A). This configuration permits a maximum height of 20 mm of the LED array and supporting structure, while still accommodating automated plate retrieval. This maximum height means that the LED array can be positioned between 3 mm and 20 mm from the bottom of the microplate. As a result of the conical shape of LED light emission, we hypothesized that placement of the LED array as close to the base of the microplate as possible would result in the most even light intensity across the microplate.
To test this hypothesis, we assembled an array of 24 photodiode light sensors, with the outside row of sensors in line with the outside 2 rows of wells in a 384-well microplate (Supplementary Fig. 7). We then varied the distance between the LED and photodiode arrays, while maintaining a consistent intensity at the photodiode array (100 μmol m−2 s−1). By observing the ratio between the intensity measured by the 16 outside photodiodes and the 8 inside photodiodes (Supplementary Figs. 22A and 22C) and the standard deviation of light intensity across the photodiode array (Supplementary Figs. 22B and 22D), we confirmed that minimizing this distance reduced variability in light intensity across a microplate. In the 20 mm to 3 mm range permitting integration into the Cytomat 5 C450 incubator, a 3 mm distance led to the most even light distribution across the photodiode array (Supplementary Fig. 22). Despite a decreased variability in light intensity at 3 mm in comparison to 20 mm, the ratio between the median intensity measured by the outside photodiodes and the median intensity measured by the inside photodiodes was still 0.82, indicating an 18% variability between the inside and outside (down from 30% at 20 mm). A 3 mm distance also resulted in a standard deviation of 11.3% of the mean across photodiodes, down from 22.2% at 20 mm. However, because of the physical parameters of photodiode light sensors, including a half intensity angle of 55°, we believe this is likely an overestimate of the well-well variability in a microplate (Supplementary Fig. 23). Based on these results, the supporting structure for the LED arrays was redesigned to minimize the distance between the LED array and microplate (Fig. 1B). This proximity of the light source to cultures provides the most even distribution of light across wells but could make cultures more susceptible to temperature increases as a result of heat generated by the LED arrays, therefore relying on temperature regulation within the incubator. Although we did not observe an impact of this in experiments using Chlamydomonas reinhardtii, which is thought to be sensitive to temperatures over 30°C, potential thermal effects of the lighting system should be considered for temperature-sensitive strains. Incubator temperatures can be adjusted downward or additional ventilation or air circulation systems can be incorporated to mitigate potential thermal impacts of the lighting system. The LED array placement described above positioned us to evaluate the impact of variable light intensity on growth rate and metabolic activity across plate types with different optical properties.
Comparing transparent and opaque microplates
To investigate the impact of transparent versus opaque plates on growth rate and photopigment production using the lighting system, S. elongatus UTEX 2973 was cultivated in three transparent (clear) and three opaque (black) microplates in parallel, in standard BG-11 medium without CO2 supplementation. The results showed that S. elongatus UTEX 2973 growth (OD750) and growth rates (μ[h−1]) in clear and black plates varied significantly in early timepoints (24 h: t = −130.46, p < 2.2 × 10^−16, Cohen’s d = −5.436; 48 h: t = −65.893, p < 2.2 × 10^−16, Cohen’s d = −2.746), before converging after 96 h (96 h: t = 1.160, p = 0.246, Cohen’s d = 0.048). Although final biomass accumulation (OD750) was comparable, with the median OD750 values in black plates 1.14 times that of clear plates, growth rates lagged in black plates over the first 24 h with a median growth rate across 1152 wells of 0.005 μ[h−1] (sd = 0.003 μ[h−1]) at 24 h, indicating almost no growth. Median growth rates in black plates then increased rapidly between 24 and 72 h, reaching a maximum of 0.047 μ[h−1] (sd = 0.011 μ[h−1]) at 72 h before quickly decreasing to 0.0167 μ[h−1] (sd = 0.012 μ[h−1]) at 96 h (Fig. 2A). In comparison, median growth rates in clear plates showed less temporal variability, with a gradual decrease in growth rate over the 8-day cultivation experiment, from a maximum median growth rate of 0.018 μ[h−1] (sd = 0.005 μ[h−1]) at 24 h to a minimum of 0.008 μ[h−1] (sd = 0.005 μ[h−1]) at 196 h (final timepoint) (Fig. 2A). The maximum growth rate 0.047 μ[h−1] observed in black plates at 72 h is near the model predicted rate in Synechocystis sp. PCC 6803 of 0.053 μ[h−1] at 100 μmol m−2 s−1, but well under the reported S. elongatus UTEX 2973 growth rate of 0.151 μ[h−1] at 30 °C, albeit with CO2 supplementation (3%) and an increased light intensity (300 μmol m−2 s−1). Although growth rate in black plates increased rapidly afterward, this delay in growth suggests the need for S. elongatus UTEX 2973 to adapt to conditions in black plates, possibly indicating decreased light intensity.
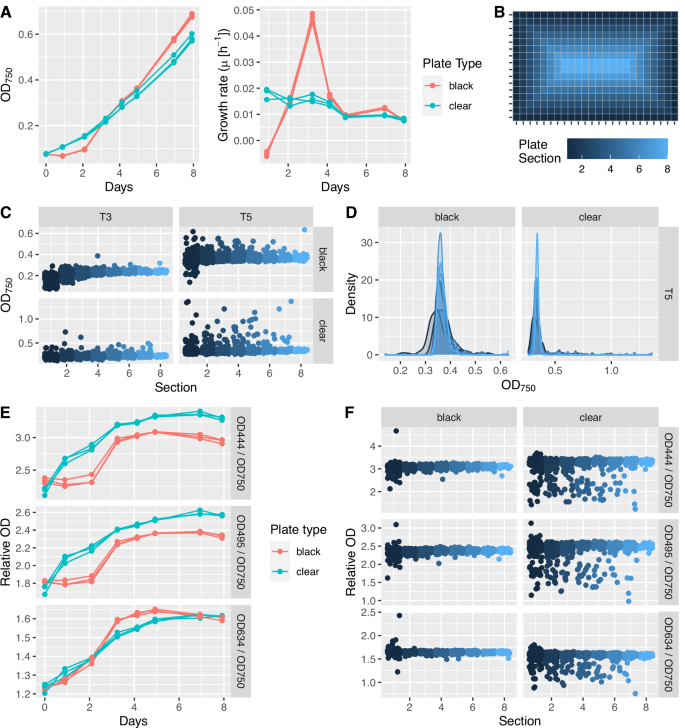
Growth and photopigment production in Synechococcus elongatus UTEX 2973 were compared between and across 3 black-well and 3 clear-well 384-well microplates. A Growth in black-well plates is slightly delayed in comparison to clear-well plates but reaches comparable OD750 values after approximately 72 h. Growth rates in clear plates were relatively constant over the 8-day cultivation experiment, whereas growth rates peaked in black plates after 3 days of cultivation. Each point represents a median of 384 values across a single microplate. B To compare growth rates across a plate, plates were divided into 8 sections, based on location on the plate. These sections will be used for downstream evaluation of growth rate and photopigment production across the microplate. C Variability in OD750 values by plate section at T3 and T5. D Density plots at T5 show the lower distribution of OD750 values in section 1 in black-well plates and the positive skew of OD750 values in clear-well plates. E Relative Chlorophyll a (444 nm) and carotenoid (495 nm) absorbance are significantly lower in black-well plates. Phycocyanin (634 nm) absorbance follows a similar trend in black- and clear-well plates. Each point represents a median of 384 values across a single microplate. F Relative photopigment fluorescence at T5 stays consistent across individual black- and clear-well microplates but with significantly more variability in the clear-well plate. This increase in the number of low outliers mirrors the high outliers observed in OD750 values in clear-well plates.
To visualize variability in growth (OD750) across individual microplates, wells were divided into plate sections based on position (Fig. 2B). Results indicated some temporal variability in growth across both plate types, with growth lagging slightly in early timepoints in sections 1–3, representing the three outside rows of a 384-well plate (72 h black plate: one-way ANOVA, F(7,1144) = 192.8, p < 2 × 10^−16, Cohen’s f = 1.09; 72 h clear plate: one-way ANOVA, F(7,1144) = 7.5, p = 7.52 × 10^−9, Cohen’s f = 0.21). By Timepoint 4 (T4/96 h), only black plate section 1, representing the outside row of wells, showed a significantly decreased growth (96 hours black plate: one-way ANOVA, F(7,1144) = 46.21, p < 2 × 10^−16, Cohen’s f = 0.53) (Fig. 2C/Supplementary Fig. 24). This decrease was less pronounced in clear plates and was not statistically significant by 96 h (96 h clear plate: one-way ANOVA, F(7,1144) = 0.863, p = 0.535, Cohen’s f = 0.07). However, more high outliers were observed in clear plates, indicating some stochasticity in well-to-well growth rates (Fig. 2C/Supplementary Fig. 24).
Relative chlorophyll a (444 nm), carotenoid (495 nm) and phycocyanin (634 nm) absorbance was used as an approximation of photopigment abundance for comparison between cultivation conditions. These absorbances were also significantly lower in black-well plates, suggesting a lower light intensity across the plate (T5 – 444 nm: t = −11.663, p < 2.2 × 10^−16, Cohen’s d = −0.44; 495 nm: t = −11.603, p < 2.2 × 10^−16, Cohen’s d = −0.44; 634 nm: t = 28.711, p < 2.2 × 10^−16, Cohen’s d = 1.04) (Fig. 2E). Photopigment absorbance trends were, however, consistent between triplicates of each plate type (Fig. 2E). Black plates also showed significant differences between relative photopigment absorbance in section 1 and that in sections 2–8 throughout the 8-day experiment (444 nm: F(7,1144) = 33.88, p < 2 × 10^−16, Cohen’s f = 0.46; 495 nm: F(7,1144) = 31.46, p < 2 × 10^−16, Cohen’s f = 0.44; 634 nm: F(7,1144) = 2.048, p = 0.0464, Cohen’s f = 0.1) (Fig. 2F / Supplementary Fig. 25). By 96 hours, clear plates showed no or marginally significant differences in relative photopigment production across plate sections (444 nm: F(7,1144) = 2.013, p = 0.0505, Cohen’s f = 0.11; 495 nm: F(7,1144) = 2.311, p = 0.0242, Cohen’s f = 0.12; 634 nm: F(7,1144) = 0.776, p = 0.607, Cohen’s f = 0.07) (Fig. 2F / Supplementary Fig. 25). The difference in relative photopigment abundance between plate types can likely be explained by refraction and internal reflection of light throughout clear-well microplates and into LEDs, potentially resulting in localized variability in light intensity. These phenomena could also explain the increased growth rate in the outside row of clear plates (section 1) and increased variability in growth rate across clear plates. Because no obvious differences in evaporation were observed across wells of a 384-well plate (Supplementary Fig. 21) and the outside wells of clear plates did not grow significantly slower, we believe this variability is likely due to light availability, rather than possible temperature differences at the outside wells or culture evaporation. Combined, these results indicate that either clear-well or black-well microplates can be used in the lighting system. Users should consider that edge-effects will be more pronounced in black-well plates and growth rate stochasticity may be more prominent when using a clear-well plate. Plate type selection should therefore be dependent on experimental design parameters and screening paradigm.
System adaptation and extensibility
Although we believe that design specifications, including plate seal selection, light source positioning in relation to plates, and electrical component selection, will be extensible across many incubation systems, some of these may need to be customized or adapted for specific applications. Electrical components need to be selected based on capacity requirements and available power sources, which may vary by country, and LED arrays can be custom manufactured based on described specifications. Additional modifications of 3D-printed LED array support structures will likely be required based on intended incubation environment. The model of this structure includes 4 tabs that extend horizontally on the outside of the support structure. These tabs ensure a proper fit within the incubator rack and should be modified based on incubator design.
Demonstration use cases
High-throughput manipulation of growth conditions
To demonstrate the utility of the lighting system, high-throughput screening experiments were initially designed to evaluate medium composition and antibiotic treatment on S. elongatus UTEX 2973 growth. A black plate was selected for both experiments, as the 308 wells in sections 2–8 (excluding outside row of wells) enable the testing of 4 conditions at 11 concentrations and with 7 replicates per concentration. With conditions randomly distributed across two microplates, the impact of individually varying the concentration of each of the 8 components of BG-11 medium was evaluated. Cells were washed twice with distilled water prior to dispensing into microplates. The results indicated that the concentrations of K2HPO4, NaHCO3, NaNO3, MgSO4 and trace elements have the most significant impact on S. elongatus UTEX 2973 growth rates, with phosphorus (K2HPO4), inorganic carbon (NaHCO3) and nitrogen (NaNO3) potentially being limiting at a standard BG-11 composition (Fig. 3A and B). Antibiotic experiments showed S. elongatus UTEX 2973 sensitivity across all tested antibiotics, with streptomycin and carbenicillin exhibiting antibacterial activity at the lowest concentrations (Fig. 3C and D/ Supplementary Fig. 26). The results conform to expected values, indicating that the lighting system enables both reproducibility and the identification of phenotypes consistent with commonly used cultivation formats20,60,61. Based on this consistency, we extended medium composition experiments using response surface modelling (RSM) to design optimized medium compositions and screened a library of bioactive small molecules for increased biomass production. These validation steps are directly related to bioproduction applications and highlight the potential of this lighting system to identify factors that increase biomass production using chemical genetic approaches.
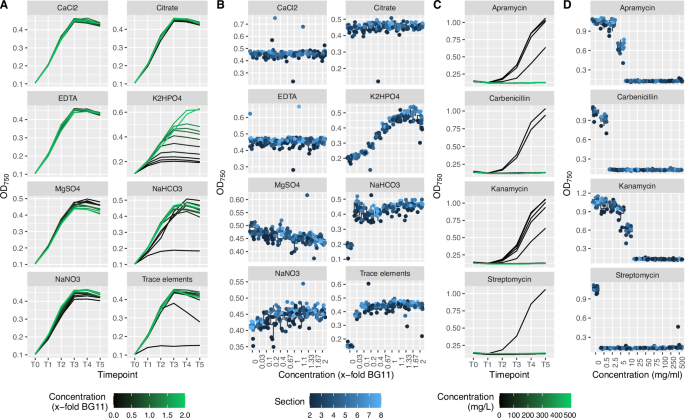
To demonstrate applicability of the lighting system, the impact of individually varying the concentration of each of the 8 components of BG-11 medium was tested. 8 components at 11 concentrations and with 7 replicates per concentration were distributed randomly across sections 2–8 of two black-well microplates, resulting in 716 individual cultures. A Growth curves show impact of nutrient limitation over the course of a 120 h experiment. B Response curves at T3 (72 h) show limiting nutrients and tight condition-dependent clustering of OD750 values. Sensitivity to 4 antibiotics was tested at 11 concentrations and with 7 replicates per concentration. C Growth curves show impact of on growth rate over the course of a 120 h experiment. D Response curves at T3 (72 h) show antibiotic sensitivity and tight condition-dependant clustering of OD750 values.
Strain-specific BG-11 medium optimization
Response surface modelling (RSM) supports determination of optimal settings of inputs to maximize, minimize or target a specific output62. In the context of medium optimization experiments performed here, RSM enabled the simultaneous identification of factors with the most significant impact on growth rate, including limiting and excess nutrients, and optimization of inputs to maximize biomass production, including evaluation of the relationship between concentrations of multiple inputs62,63,64,65. To demonstrate cross-strain compatibility, RSM-based optimization experiments were performed with the objective of strain-specific BG-11 medium optimization. Synechococcus elongatus UTEX 2973, Chlamydomonas reinhardtii UTEX 90 and Nostoc hatei CUBC1040 were selected, as they span cyanobacterial and eukaryotic photosynthetic microorganisms, including both unicellular and filamentous strains. These optimization experiments enabled identification of limiting nutrients for each strain, as well as optimized medium compositions for increased growth under defined conditions. Parallel cross-strain medium optimization also served as a demonstration of the lighting system in a high-throughput screening paradigm relevant to development of industrial bioprocesses39,41,66.
A central composite design, or Box-Wilson design, is a standard experimental design method in RSM and was used here for strain-specific BG-11 medium optimization63,67. This design strategy defined three levels of each factor, including a centre point (0), a low value (−1) and a high value (1). As atmospheric carbon capture is a desired objective of industrial application of photosynthetic microorganisms, optimization was performed at fixed NaHCO3 concentrations. These were set at either 0 g/L NaHCO3, making strains entirely dependent on atmospheric CO2, or the standard BG-11 concentration of 0.42 g/L NaHCO3. This resulted in an eight-factor BG-11 optimization, which requires a minimum of 51 conditions. A single 384-well plate supports an experiment with 61 conditions, including 24 replicates of the centre condition (0 value for all factors) and 6 replicates of the 60 additional conditions (Supplementary Table 1). Factor levels were defined using the standard BG-11 composition as a centre point (Table 2).
A single round of lighting system growth optimization was performed prior to flask-based testing (Fig. 4). Results indicate that nitrogen content (NaNO3) was the factor with the most significant impact on growth rate of both S. elongatus UTEX 2973 and C. reinhardtii UTEX 90, regardless of NaHCO3 concentration (Fig. 4B). MgSO4, K2HPO4, and CaCl2 were also important factors across both strains (Fig. 4C / Supplementary Figss. 8–11). MgSO4 was the most important factor in Nostoc hatei CUBC1040 growth rate, with NaNO3 content being the fourth or fifth most important factor (Fig. 4B / Supplementary Figs. 12–13). This result is consistent with expectations as Nostoc hatei CUBC1040 is heterocystous and capable of fixing atmospheric N268. These trends can be visualized by observing the OD750 values of individual cultures in relationship to the depletion status of a given nutrient (Supplementary Fig. 27). Results support model predictions, suggesting that S. elongatus UTEX 2973 and C. reinhardtii UTEX 90 are very sensitive to depletion of NaNO3, MgSO4, and K2HPO4, whereas Nostoc hatei CUBC1040 only shows this degree of sensitivity to MgSO4 depletion. The decreased sensitivity of Nostoc hatei CUBC1040 to K2HPO4 depletion may result from the ability of Nostoc strains to store phosphorus as polyphosphate bodies69,70. This stored phosphorus can be utilized during periods of nutrient scarcity, enabling initial growth even when external phosphorus levels are low. This strategy is crucial for survival in phosphorus-limited environments, as it allows Nostoc to maintain metabolic functions and initiate growth before external phosphorus becomes available again69,70.
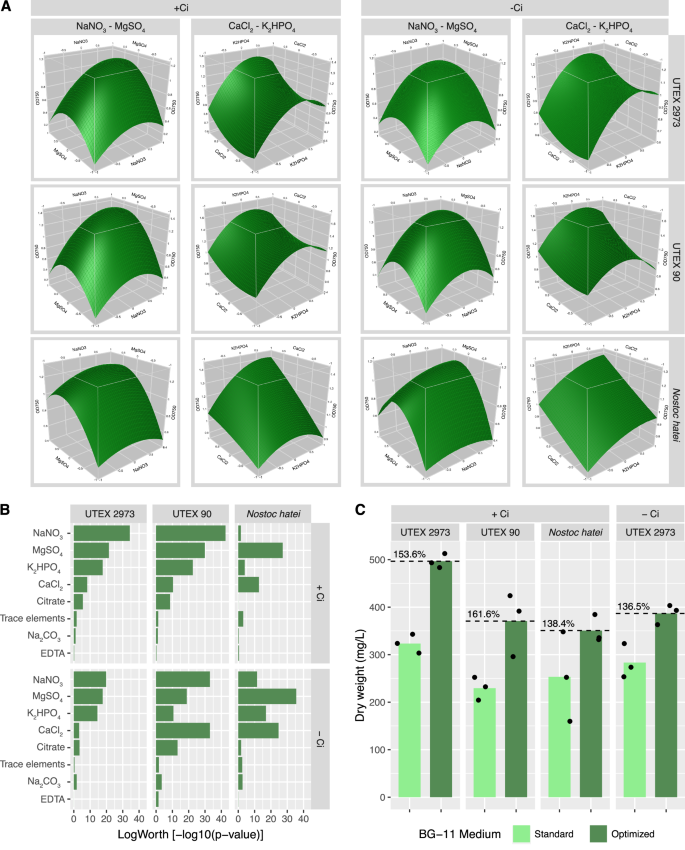
BG-11 optimization and RSM were performed through a 61-condition, 8-factor central composite design experiment. A Response surface model showing the relationships between components NaNO3 and MgSO4 and components CaCl2 and K2HPO4, as well as their predicted impact of growth. B Predicted effects of individual medium components on growth of each strain with or without NaHCO3. Values are plotted as LogWorth = −log10(p-value). C Flask-based cultivation in standard and optimized BG-11 media showed reproducible increases in biomass accumulation over 7-day cultivation experiments. Points represent biomass from individual 50 mL flask cultures. Green bars represent mean biomass of three flasks in standard and optimized medium.
Response surface models for each strain indicated that increasing NaNO3 concentrations to the highest tested concentration would maximize growth rates, which is consistent with previous observations (Fig. 4A)20,71. Rather than increasing nutrient provision to all cultures, RSM was leveraged to design optimal medium composition with a defined NaNO3 concentration of 3.0 g/L, which is that of standard BG-11 medium (Table 2). Results indicated that variations in the concentrations of K2HPO4, MgSO4, CaCl2 citrate and trace elements all contributed to optimized growth in microplates. EDTA, a chelating agent, supported growth in the absence of NaHCO3 but decreased growth in the presence of NaHCO3. EDTA is a known inhibitor of carbonic anhydrases (CAs) through chelation of the Zn2+ cofactor in the active site of many microalgal CAs72,73. This could interfere with the conversion of HCO3− to CO2 in the carboxysome for fixation by ribulose-1,5-bisphosphate carboxylase/oxygenase (RuBisCo)73. Na2CO3 concentrations should be decreased to maximize growth in all cases except S. elongatus UTEX 2973, in the absence of alternative inorganic carbon supplementation.
Validation experiments in flasks were performed for optimized medium compositions containing NaHCO3 at standard BG-11 concentrations across all three strains, as well as in S. elongatus UTEX 2973 in NaHCO3-deficient medium (Table 3). Cultures were inoculated in Erlenmeyer flasks in triplicate in standard and optimized BG-11 medium. OD750 values were collected at days 1, 3, and 7 and biomass dry weight was collected at day 7 to evaluate final impact of optimized medium on biomass accumulation. Under NaHCO3 supplemented conditions, optimized medium significantly increased biomass accumulation in UTEX 2973 (t(3.74) = 11.93, p = 0.0004, Cohen’s d = 9.74). Although increases were observed in the other two strains, these were marginally significant in UTEX 90 (t(2.52) = 3.46, p = 0.053, Cohen’s d = 2.82) and non-significant in Nostoc sp. (t(2.38) = 1.71, p = 0.209, Cohen’s d = 1.40), likely as a result of increased variability. In NaHCO3-deficient medium, tested only in UTEX 2973, optimized medium also significantly increased biomass (t(3.20) = 4.30, p = 0.020, Cohen’s d = 3.51). Increases across all strains ranged from 38.4% to 61.6% in total biomass accumulation (dry weight) over 7 days of cultivation (Fig. 4C). These results are consistent with findings in microplates and further demonstrate the potential of high-throughput screening systems to optimize growth conditions prior to scale-up. Indeed, if scalable, the biomass increases observed using optimized media could lead to 10,000 s tonnes of additional CO2 fixation and promote economic feasibility of algae-based carbon capture strategies without the need for metabolic engineering.
Screening for bioactive molecules affecting algal growth
Bioactive molecule screening in S. elongatus UTEX 2973 was performed in three rounds, prior to the selection of candidate compounds for downstream characterization. The primary screen (round 1) involved a single replicate of all 4240 bioactive molecules in the composite library at 5 μM, in 14 clear 384-well plates. These plates were screened in 2 sets of 9 and 5, respectively (Fig. 5). Although the median OD750 value at the final timepoint varied between Set 1 and Set 2 (Fig. 5A), values were normalized by calculating Z-scores on a plate-by-plate basis (Fig. 5B). The use of Z-scores for outlier detection assumes a normal distribution of data. Skewness and kurtosis tests gave values of −0.01 and 8.61, respectively, indicating very little skew across the entire dataset and a sharper central peak than that of a standard normal distribution (Fig. 5B / Supplementary Fig. 28). This results from most cultures growing at near the mean rate, with a relatively small number of significant outliers. The negative skew of the OD750 and Z-score values in Set 2 likely resulted from increased separation between median growth rates of cultures that continued to grow and those treated with compounds that prevented growth. Hits were selected based on a Z-score > 2.5 or < −2.5, for “High” and “Low” OD750 hits, respectively (Fig. 5B / Table 4). This resulted in the selection of 59 high-OD750 hits (top 1.4% of values) and 87 low-OD750 hits (bottom 2.1% of values). A full list of selected hits can be found in Supplementary Table 2.
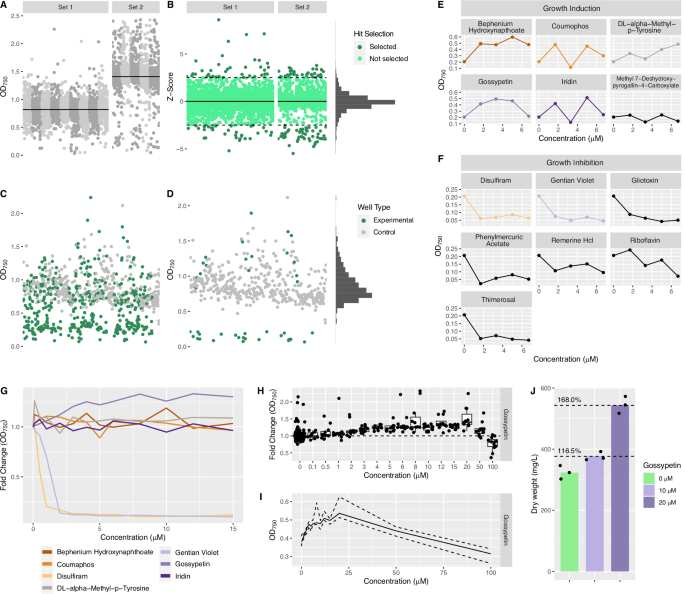
A Round 1 of bioactive molecule screen was run in two sets, monitoring OD750 values in each well. Shades of grey indicate OD750 from 14 384-well plates. Solid lines represent median OD750 values for each set. B Plate-by-plate Z-scores were calculated to normalize data and identify outliers. Colour represents selected outliers (dark green). Solid line represents Z-score of 0. Dashed lines represent Z-score of ± 2.5. Data showed near normal distribution. C All OD750 data points from round 2 screening. 146 hits (each in triplicate) and 396 negative control wells, across three 384-well plates. D Selected hits from round 2 with negative control wells. Negative control data showed a positively skewed distribution. E Round 3 gradient testing for selected hits inducing growth and F inhibiting growth. Line colours indicate selected compounds for downstream testing. G Lines show a median of 8–12 replicate wells at each concentration of selected candidate compounds. H Fold-change in OD750 compared to negative control wells (no gossypetin treatment), showing 12 replicates at each concentration [non-linear x-axis]. I Median (solid), 25th percentile (dashed), and 75th percentile (dashed) OD750 measurements across 15 gossypetin concentrations [linear x-axis]. J Flask-based cultivation at 10 μM and 20 μM gossypetin showed reproducible increases in biomass accumulation over a 7-day cultivation experiment.
The 146 hits selected in the round 1 screen were rescreened in triplicate in round 2 across three identical 384-well plates (Fig. 5C). Each replicate plate included 132 negative control wells (0.1% DMSO). Interestingly, control data in round 2 did not show the same slight negative skew as round 1 data. Skewness and kurtosis tests gave values of 1.29 and 6.09, respectively, indicating a positive skew and a sharper central peak than that of a standard normal distribution (Fig. 5D/ Supplementary Fig. 29). This positive skew can also be explained by observed growth dynamics in clear 384-well plates, where low values are bound by the minimum value of no growth and high-values can vary significantly (Fig. 5D). Based on these observations, outliers for future screening were selected by calculating p-values for each experimental OD750 measurement. Compounds were then filtered to those that had p-values < 0.1, calculated using a one-tailed normal distribution test, in at least 2 of 3 replicates. This selection criterion accounted for observed stochasticity in high OD750 values in clear-well plates, as the probability that the same compound is the subject of a randomly occurring high OD750 value multiple times is low. A total of 64 low-OD750 outliers and 6 high-OD750 outliers matched this criterion (Supplementary Table 3). All 6 high-OD750 outliers were selected for downstream characterization. Eight of the 64 low-OD750 outliers were also selected by maximizing the difference between the mean of the negative control data and the mean of the 3 experimental replicates (Table 5). Low-OD750 hits were clearly distinguished from negative controls, whereas high-OD750 hits appeared at the upper end of the distribution of negative controls (Fig. 5D).
The 6 high-OD750 and 7 low-OD750 hits selected from round 2 were subsequently tested over a narrow concentration gradient (1.667 μM, 3.333 μM, 5 μM and 6.667 μM). This gradient provided additional replication and preliminary insight into dose-dependence of observed growth effects (Fig. 5E, F). High-OD750 candidate compounds were selected if at least 3 treatments showed higher OD750 values than the negative control. Based on the results, all high-OD750 candidate compounds were selected for further characterization with exception of methyl 7-deshydroxypyrogallin-4-carboxylate. Cyanocidal compounds, such as the low-OD750 candidate compounds identified here, have applications in the mitigation of harmful algal blooms in the aquaculture industry and environmental settings74. Although the identification of cyanocidal compounds was not the primary objective of this screen, gentian violet and disulfiram were selected for further characterization. Gentian violet and disulfiram showed the most significant response at the lowest tested concentration of 1.667 μM, outside of organomercury compounds thimerosal and phenylmercuric acid. Both thimerosal and phenylmercuric acid contain a covalently bound atom of mercury (Hg). These compounds were not selected because, at tested concentrations of 1.667 μM, this results in a Hg concentration of 0.334 mg/L, which is 334 times the maximum acceptable concentration in drinking water according to the Government of Canada75. Although gentian violet has been shown to persist in certain environments, it is amenable to bioremediation by some species of bacteria, fungi and algae76. Less is known about the environmental stability of disulfiram, which is a drug used to treat alcohol dependence and has been proposed as a narrow-spectrum antibiotic77,78. However, other compounds containing disulphide bonds are cleaved in reductive environments, such as freshwater and marine sediments, indicating a possible bioremediation route79. Although riboflavin was not selected for testing at scale, it is interesting that this essential vitamin was identified as cyanocidal. We did not find any reports of toxicity in cyanobacteria and riboflavin has been successfully overproduced in model strain Synechococcus sp. PCC 7002 under non-degrading red light conditions80, though riboflavin is known to have antimicrobial properties in a range of Gram-positive and Gram-negative bacterial strains81,82. However, it has been observed that upon exposure to UV or white light, riboflavin will photolyse into lumichrome or lumiflavin in neutral or basic conditions, respectively. Lumichrome has been shown to be toxic to cyanobacteria Microcystis, providing a possible explanation for the observed toxicity83. The resulting set of 7 candidate compounds was purchased in larger quantities from various suppliers for additional testing (Supplementary Table 3). Each compound was tested at 12 concentrations, from 0.1 μM to 15 μM, with 8 to 12 replicates at each concentration. Both gentian violet and disulfiram significantly decreased growth at concentrations of 2 μM and above (Fig. 5G). However, only gossypetin among the high-OD750 candidates resulted in a significant growth phenotype (Fig. 5G).
The impact of gossypetin on growth was further explored up to 100 μM in microplate format, with 12 replicates at each concentration. Results indicated a significant increase in OD750 above 6 μM gossypetin (one-way ANOVA, F(15,279) = 11.7, p < 2 × 10^−16, Cohen’s f = 0.79), with a maximum increase in OD750 between 20 μM to 50 μM. A 1.4-fold median increase was observed at 20 μM gossypetin (Fig. 5H, I). A distinctive phenotype observed when treating S. elongatus UTEX 2973 with gossypetin was a visible colour change of the culture from green to near-black, despite gossypetin having a yellow colour when dissolved in DMSO (Supplementary Figs. 30, 31). This colour change was observed in BG-11 medium, as well as the S. elongatus UTEX 2973 culture, but not in distilled water, and is likely the result of iron-mediated oxidation and complexation resulting in colour changes in other flavonoids84. An absorbance scan indicated that gossypetin treatment leads to an absorbance peak at 370 nm in BG-11 medium, S. elongatus UTEX 2973 culture, and dH2O, with an increase in absorption across the visible spectrum observed only in BG-11 medium and S. elongatus UTEX 2973 culture (Supplementary Fig. 32A). A slight increase in absorbance was also observed at OD750, but this is insufficient to explain the increase in measured OD750 during the time course of the growth experiment (Supplementary Fig. 32B).
Gossypetin is a flavonol, a class of flavonoids, that was initially isolated from Hibiscus sabdariffa. Flavonoids are widespread in plants and plant products85 and are often considered antioxidants with the potential to scavenge reactive oxygen species (ROS) and protect from ROS-induced DNA damage and cellular stress86. Gossypetin has been shown to reduce λ-radiation induced DNA damage87, as well as display anti-atherosclerotic effects and anti-cancer effects, as well as lead to the induction of Aβ plaque phagocytosis, in the context of Alzheimer’s disease88,89,90. Interestingly, gossypetin and related flavonols have also been observed to have antimicrobial effects91,92. However, gram-negative prokaryotes, such as cyanobacteria, may be less susceptible to this class of compounds93. In cyanobacteria, another flavonoid, naringenin, has also been reported to increase growth rate and chlorophyll production94. The authors proposed that this is the result of membrane disruption and increased permeability, resulting in polysaccharide excretion. This may function as a carbon sink, increasing metabolic efficiency. The observed absorbance peak of gossypetin-treated cultures and medium in the UV range also suggests a photoprotective mechanism is possible at higher light intensities, in addition to antioxidant effects, and impacts on membrane permeability. Iridin, one of the other compounds selected for round 3 screening, is a related flavonoid, indicating that this effect may be shared by other compounds of this class. To determine whether the impact of gossypetin on Synechococcus elongatus UTEX 2973 growth could scale to larger culture volumes, we performed a 50 mL flask-based cultivation experiment. Cultures were inoculated in Erlenmeyer flasks in triplicate, in standard BG-11 medium, with 10 μM and 20 μM gossypetin treatments and untreated. OD750 values and absorbance scans were collected at days 1, 3, and 7, and biomass dry weight was collected at day 7 to evaluate final impact of gossypetin on biomass accumulation. These results indicated significant increases in total biomass accumulation over 7 days of cultivation with both 10 µM (Welch’s t-test, t(3.74) = −3.67, p = 0.024, Cohen’s d = −3.00) and 20 µM gossypetin (t(3.48) = −10.57, p = 0.0009, Cohen’s d = −8.63), showing 16.5% and 68.0% increases respectively, consistent with microplate results.
Conclusions
We designed, built, and tested a consistent lighting system for microplate-based photosynthetic microorganism cultivation that can be integrated into existing high-throughput automation infrastructure expanding the sensitivity, throughput, and extensibility of screening applications. The system enables users to leverage existing infrastructure and expands the range of assays amenable to the parallel screening of 100 s to 10,000 s of photosynthetic or photo-responsive microorganisms in microplates. Using response surface modelling of optimal growth conditions in 384-well formats, we were able to demonstrate the applicability of this system across three diverse microalgal strains. Optimized cultivation conditions led to scalable growth increases over several orders of magnitude, indicating potential utility in bioprocess optimization. Future efforts should further expand both the diversity of strains tested, including marine and biofilm-forming photosynthetic microorganisms, as well as the diversity of assays and experimental designs. As the system was designed for integration into standardized automation and laboratory infrastructure, it is amenable to a large range of chemical and biological assays, including photopigment and chemical assay fluorescence, and streamlined incorporation into downstream workflows. Moreover, the system can serve as a primary screening mode for growth optimization and cultivation of distinct genetic clones or strain variants, or a secondary process used to validate hits identified in pooled or droplet-based screening paradigms including the high-throughput study of optogenetics and light-driven metabolic activity or genetic circuits across the tree of life34,45.
Methods
Lighting system components
Electrical components of the lighting system and control circuit were sourced from various suppliers based on price and availability. Except custom manufactured light emitting diode (LED) arrays and 3D printed structures (Guangzhou Juhong Optoelectronics Co., Ltd.), all electrical components are standard parts that could be exchanged for parts sourced from alternative providers, providing they match specifications and power requirements. Parts were selected to be compatible 120 V 60 Hz outlets standard in North America. Some parts may need to be exchanged for systems being developed outside of North America. 3D printed structures, including slipring connectors and LED array support structures, were printed using polylactic acid (PLA) filaments. See a circuit diagram in Supplementary Fig. 15 and a parts list at https://github.com/hallamlab/lighting_system_design_2024/.
Lighting system assembly
The following instructions are specific to the Cytomat 5 C450 incubator and may need to be adapted for alternative installations. After sourcing electrical components and LED arrays, and printing parts as needed, the lighting system was assembled for integration into a Cytomat 5 C450 incubator (ThermoFisher Scientific, USA) (Supplementary Fig. 1). LED arrays are inserted into the support structures, with attention to wire orientation (Fig. 1B/ Supplementary Fig. 2). These assembled LED arrays are loaded into alternating positions on the stacker starting from shelf 20, allowing space for microplates directly above each LED array (Supplementary Figs. 3, 4). Two terminal strips are mounted to the back of the Cytomat 5 C450 rack using machine screws: one for positive (red) and one for negative (black) connections. Using a screwdriver, connect the corresponding-coloured wires from each LED array to their respective terminal strips. The terminal strips are then connected to the rotary component of the slip ring via wire connectors, with the slip ring mounted in its 3D printed connector piece and attached to the incubator ceiling grate (Supplementary Fig. 5 / Supplementary File 2).
After placing the stacker in the incubator, connect the wire connectors between the stacker and slip ring, ensuring proper alignment of red and black wires. Route the LED driver wires through the corner of the incubator door or a wire port and connect them to the stationary side of the slip ring, maintaining tension in the wires. Secure these wires to the outside of the incubator with tape to maintain tension when the door is opened. The external wires are then connected to the LED driver’s V+ (red) and V− (black) terminals. After verifying all electrical connections in the electronics enclosure, power can be supplied by connecting the Arduino, 12 V power supply, and LED driver to outlets (Fig. 1A). This configuration includes detachable connections between terminal strips, slip ring, and LED driver to facilitate system maintenance and disassembly when needed.
Protein economy modelling
We adapted a previously published protein economy model for the cyanobacterium Synechocystis sp. PCC 6803 to study the effects of variable light intensity on cyanobacterial metabolism47. The ‘coarse-grained’ model represents key cellular processes by grouping proteins into functional categories: light harvesting complexes (LHC), photosynthesis and electron transport (PSET), carbon fixation and central metabolism (CBM), lipid biosynthesis and membrane components (LPB), ribosomal protein synthesis (RIB), and maintenance/regulation (MAI). The model also tracks key metabolites (ATP, NADPH, precursor metabolites, lipids) and distinguishes between membrane lipid pools (cytoplasmic and thylakoid membranes).
The model was implemented in Python using the GEKKO optimization suite to simulate the steady-state behaviour of Synechocystis sp. PCC 6803 under varying light intensities. Applying the existing model47, we assumed that the cell operates at a steady state, meaning that the rates of synthesis, degradation, and dilution from growth are balanced, resulting in constant concentrations of proteins, metabolites, and other cellular components. While this steady-state assumption does not account for short-term changes, it is a reasonable approximation at maximum growth rate47. Enzymatic reactions are represented with modified Michaelis–Menten kinetics incorporating Hill coefficients, and mass balance equations ensured that ribosomal allocation for protein synthesis and metabolite production matched growth demands. Constraints are imposed on protein reserves and membrane composition, ensuring a minimal lipid content and appropriate distribution between cytoplasmic and thylakoid membranes47.
To simulate the impact of light intensity, this model parameter was varied as a descending series (from 95 to 1 in arbitrary units) with a time step of 0.5 h (as a steady-state model was used, this time increment and the sequence of conditions do not impact results but were used to conform with existing model implementations). For each light level, the model was solved as a steady-state optimization problem (GEKKO IMODE = 5) with the objective of maximizing the specific growth rate. Solver settings, including a maximum of 300 iterations and model reduction (REDUCE = 1), were selected to ensure robust convergence and computational efficiency. Scripts related to protein economy modelling can be found at https://github.com/hallamlab/lighting_system_design_2024/.
Sensor-based testing of lighting system performance
Photodiodes (OSRAM Metal Can TO39 Ambient Light Sensor, OSRAM Licht AG, Germany) and thermistors (Thermistor NTC 10 K bead, Amphenol Thermometrics, Inc., USA) were used to measure light intensity and temperature, respectively, in sensor-based experiments evaluating the performance of LED arrays and lighting system configuration. We performed experiments monitoring consistency of light intensity and heat generation by LED arrays over 16 h at 37 °C. Individual photodiodes were placed 10 mm below the centre and outside edge of three LED arrays with either copper or superconducting aluminium mounting media. Thermistors were placed touching the back of LED arrays and positioned 10 mm from LEDs to investigate heat generation. Datapoints were collected every 60 s for 16 h at currents of 10 mA and 70 mA. To test the distribution of light emitted from the LED arrays, an array of 24 photodiodes was assembled (4 × 6), with the outside row of sensors in line with the outside 2 rows of wells in a 384-well microplate (Supplementary Fig. 7). Individual datapoints collected represent the mean of 15 measurements, with the 2 most extreme values removed. Data from the 24 photodiodes were collected at a rate of 20 datapoints per second over 10 s, for a total of 200 datapoints per photodiode at increasing distances from the LED array (3 mm, 5 mm, 10 mm, 20 mm, 30 mm, 50 mm, 100 mm, 200 mm, and 400 mm) at a consistent intensity of 100 μmol m−2s−1 photons at the photodiodes. Photodiode and thermistor data collection was performed using an Arduino UNO Rev3 microcontroller (Arduino, Italy) and custom Arduino scripts (Supplementary data– LED_driver.ino).
Chemicals and growth media
Chemicals used in medium production and cyanobacterial cultivation were purchased from Sigma-Aldrich (Germany) unless otherwise indicated. To prepare BG-11 medium, 100x stock solutions were prepared of NaNO3 (300.0 g/L), K2HPO4 (6.27 g/L), MgSO4·7H2O (14.8 g/L), CaCl2·2H2O (7.35 g/L), EDTA (0.22 g/L), Na2CO3 (8.0 g/L), and a citric acid and ferric citrate solution (1.2 g/L and 1.5 g/L, respectively), a 200x NaHCO3 stock solution (84 g/L) and a 1000x trace elements stock solution including 286 mg H3BO4, 181 mg MnCl2·4H2O, 22.2 mg ZnSO4·2H2O, 39 mg Na2MoO4·2H2O, 7.9 mg CuSO4·2H2O, 4.94 mg Co(NO3)2·2H2O in 100 ml of ddH2O. To prepare 1x BG-11 medium, 10 ml of each 100x stock, 5 ml of the NaHCO3 stock and 1 ml of the trace elements stock solution were added to 900 ml of ddH2O. Volume was then adjusted to 1 L before autoclave sterilization or filter sterilization. Solid medium was prepared by adding 15 g of bacteriological agar prior to autoclaving. 2 mL of a 1 M Na2S2O3·5H2O solution was added before pouring plates, for a final concentration of 2 mM Na2S2O3·5H2O. Stocks of antibiotics apramycin, carbenicillin, kanamycin and streptomycin were prepared at 50 mg/mL. 1000x stocks of several BG-11 components were prepared for medium optimization experiments to minimize required volumes: K2HPO4 (62.7 g/L), MgSO4·7H2O (148 g/L), CaCl2·2H2O (73.5 g/L), EDTA (2.2 g/L), Na2CO3 (80 g/L), and a citric acid and ferric citrate solution (12 g/L and 15 g/L, respectively).
Photosynthetic strains
To test the applicability of the lighting system for high-throughput photosynthetic cultivation experiments, we selected three microalgal strains including one eukaryotic and two prokaryotic strains, with both unicellular and filamentous growth phenotypes. Synechococcus elongatus UTEX 2973 is a freshwater cyanobacterium that was selected for its fast growth rate, extensive characterization in literature, and recently developed CRISPR toolkits, which could enable high-throughput genetic screening in the future16,95,96. Chlamydomonas reinhardtii is an extensively studied species of eukaryotic algae and one of the few eukaryotic algae with established genetic toolkits97,98,99. Nostoc hatei is a filamentous cyanobacterium belonging to the N2-fixing heterocystous Nostoc genus100,101. Synechococcus elongatus UTEX 297396 and Chlamydomonas reinhardtii UTEX 90 [mt + ] were sourced from the University of Texas Culture Collection (Austin, USA)97,98, and Nostoc hatei CUBC1040 from the Thailand Institute of Scientific and Technological Research Culture Collection (Thailand). All strains were maintained in BG-11 medium with ambient CO2 and NaHCO3 as inorganic carbon sources. Stock cultures were maintained in 125 ml Erlenmeyer flasks with 50 ml of BG-11 medium or on 10 cm agar plates prepared following methods above. Stock cultures were incubated at 30 °C under continuous 5000 K illumination at 70–100 μmol m−2 s−1 by Metalux Flush Mount LED lamps (Cooper Lighting). Flask-based cultures were shaken at 120 rpm continuously unless stated otherwise.
Cultivation experiments
To conduct system validation experiments, a flask-based culture of Synechococcus elongatus UTEX 2973 was inoculated from a single colony streaked onto BG11 agar and cultured in a 125 ml Erlenmeyer flask for 7 days prior to the experimental start date, following the protocol described above. If additional volume was required, 1 ml of this culture was passaged into a 1 L Erlenmeyer flasks and cultured for an additional 7 days. At the experimental start date (T0), OD750 values of S. elongatus UTEX 2973 cultures were measured using an Evolution 60S spectrophotometer (Thermo Fisher Scientific, USA) in cuvettes with a 1 cm pathlength. Cultures were then diluted in fresh BG-11 medium to an OD750 of 0.1. In the case of the BG-11 composition testing experiment, cells were washed in distilled H2O and diluted in distilled H2O to OD750 of 0.1. When relevant, appropriate medium components for high-throughput testing were added to 384-well microplates using the Echo 525 acoustic liquid handling system (Beckman Coulter Inc., USA). This includes small molecules in DMSO or individual components of BG-11 medium, for response surface modelling. Diluted cultures were then dispensed into 384-well microplates to a total volume of 85 μL using the Matrix WellMate Dispenser (ThermoFisher Scientific, USA). Plates were sealed with PermASeal breathable seals (ITS Scientific, UK) using the Agilent PlateLoc Thermal Microplate Sealer (Agilent, USA). Microplates were loaded into the lighting system as described above, in either a Cytomat 5 C450 Incubator (ThermoFisher Scientific, USA) or a Sanyo MCO-175M Water Jacketed CO2 incubator (Panasonic, Japan), at 30 °C under continuous illumination at 100 μmol m−2 s−1 photons. At regular time intervals, plates were transferred from the incubator to the Access Laboratory Workstation (Beckman Coulter Inc., USA) deck for measurements manually or directly from the Cytomat 5 C450 Incubator. A robotic arm integrated into the Access Laboratory Workstation would then transfer microplates to a PHERAstar FSX plate reader (BMG Labtech, Germany) for optical density. Each measurement consisted of either a single measurement or a 2 × 2 well scan (plate type selection, medium optimization, and bioactive molecule screening). When 2 × 2 well scans were performed, the mean of the two lowest values was used. This conservative strategy was selected as we observed that bubbles could skew 1–2 measurements in individual wells. Both the Cytomat 5 C450 Incubator and PHERAstar FSX plate reader systems are integrated into the fully programable Access Laboratory Workstation (Beckman Coulter Inc., USA) used to conduct all automation protocols, which also includes the Echo 525 acoustic liquid handling system (Beckman Coulter Inc., USA) and Agilent PlateLoc Thermal Microplate Sealer. Although this workflow was automated, removing breathable seals from plates was unreliable and often resulted in tears or partial removal, meaning that this step required monitoring and some manual intervention. We found that heating seals using the Agilent PlateLoc Thermal Microplate Sealer significantly improves seal removal, suggesting a potential strategy to improve automation in collaboration with a manufacturer. Hourly growth rates (μ[h−1]) were calculated using the following formula:
OD and t represent OD750 values and time in hours, respectively, at consecutive timepoints n and n-1. μ[h−1] then equals the relative increase in OD750 per hour between two timepoints.
Small molecule screening
A custom library of bioactive molecules consisting of 4240 compounds (Supplementary data – bioactive_library_info.csv) from the Prestwick Chemical Library (Prestwick Chemical Libraries, France), MicroSource Spectrum Collection (MicroSource Discovery Systems Inc., USA), Sigma-LOPAC library (Sigma-Aldrich, Germany) and the Biomol FDA-Approved Drugs Screening Library (Biomol GmbH, Germany) was provided by Biofactorial automation core facility (University of British Columbia, Canada). These compounds were transferred into screening plates using the Echo 525 acoustic liquid handling system (Beckman Coulter Inc., USA), as described above. The primary screen (round 1) was performed at a 5 μM concentration to identify compounds impacting the growth of Synechococcus elongatus UTEX 2973, using OD750 as a proxy for growth. Screening was performed in clear 384-well plates following protocol described above. Round 1 hits were selected based on a Z-score > 2.5 or < −2.5, for “High” and “Low” OD750 hits, respectively. The 146 hits for round 1 were rescreened in triplicate across three identical 384-well plates. Each replicate plate included 132 negative control wells (0.1% DMSO). Hits round 2 were selected based on p-values < 0.1 in at least 2 of 3 replicates, using a one-tailed normal probability test. 64 low-OD750 outliers and 6 high-OD750 outliers matched this criterion (Table 5). All 6 high-OD750 outliers and 8 of 64 low-OD750 outliers were selected for round 3. Low-OD750 outliers were selected by maximizing the difference between the mean of the negative control data and the mean of the 3 experimental replicates. In round 3, 6 high-OD750 and 8 low-OD750 hits were tested over a narrow concentration gradient (1.667 μM, 3.333 μM, 5 μM and 6.667 μM). High-OD750 candidate compounds were selected for downstream characterization if at least 3 treatments showed higher OD750 values than the negative control.
Response surface modelling
Design of experiments (DOE) and response surface modelling (RSM) for medium optimization experiments were performed using JMP 16 software (JMP Statistical Discovery LLC). RSM leveraged a central composite design (Box-Wilson design) created through the JMP 16 DEO platform, which is an interactive interface for experimental design62,63,67. The resulting experiment involved a 3-level 8-factor screen, investigating the relationship between individual components of BG-11 medium (factors) and their impact on growth (response variable). An Echo 525 acoustic liquid handling system (Beckman Coulter Inc., USA) was used to combine BG-11 medium components at 100x or 1000x concentration directly in 384-well microplates, based on this experimental design. Each run of the central composite design was performed with at least three independent replicates, where each replicate was an independent preparation of the BG-11 medium components and subsequent growth assay. Collected data was reformatted in R for analysis using the JMP 16 response surface modelling interface to produce an “Effect Summary” table (Supplementary Figs. 8–13), ranking the impact of a given input on the desired output, a “Prediction Profiler” interface, enabling the optimization of inputs for a desired output, and “Response Surface Models” (Fig. 4)63.
Statistics and reproducibility
Statistical analyses were performed using R (v.4.3.2). Statistical testing included one-way ANOVAs followed by Tukey’s HSD post-hoc tests, unpaired two-tailed t-tests, Welch’s t-tests, and F-tests for equality of variances. For ANOVA results, we report F-statistics with degrees of freedom, p-values, and Cohen’s f effect sizes in the format: F(df1,df2) = F-value, p = p-value, Cohen’s f = effect-size. For t-tests, we report t-statistics with degrees of freedom, p-values, and Cohen’s d effect sizes as: t(df) = t-value, p = p-value, Cohen’s d= effect-size. For F-tests comparing variances between groups, we report F-statistics with degrees of freedom, p-values, and Cohen’s d effect sizes as: F(df1,df2) = F-value, p= p-value, Cohen’s d= effect-size. Where relevant, descriptive statistics include skewness and kurtosis to assess distribution normality.
For characterization of growth across plate sections, differences were analyzed using one-way ANOVA followed by Tukey’s HSD post-hoc tests (α = 0.05). Significant differences in growth were observed between sections in black plates by 96 h (F(7,1144) = 46.21, p < 2 × 10^−16, Cohen’s f = 0.53), while clear plates showed no significant differences (F(7,1144) = 0.863, p = 0.535, Cohen’s f = 0.07). Three black and three clear 384-well plates were used, with sections 1–8 containing 76, 68, 60, 52, 44, 36, 28, and 20 wells respectively. While plate sections violate ANOVA’s independence assumption, this framework effectively identified position-dependent variation. For comparisons between plate types, unpaired two-tailed t-tests showed significant differences in early timepoints (24 h: t(2294) = −130.46, p < 2.2 × 10^−16, Cohen’s d = −5.436; 48 h: t(2294) = −65.893, p < 2.2 × 10^−16, Cohen’s d = −2.746) before converging at 96 h (t(2294) = 1.160, p = 0.246, Cohen’s d = 0.048). Each comparison combined measurements from 3 independent plates (1152 wells per plate type).
For photopigment comparisons between plate types, t-tests revealed significant differences (444 nm: t = −11.663, p < 2.2 × 10^−16, Cohen’s d = −0.44; 495 nm: t = −11.603, p < 2.2 × 10^−16, Cohen’s d = −0.44; 634 nm: t = 28.711, p < 2.2 × 10^−16, Cohen’s d = 1.04). Spatial analysis of photopigment distribution showed significant section effects in black plates (444 nm: F(7,1144) = 33.88, p < 2 × 10^−16, Cohen’s f = 0.46; 495 nm: F(7,1144) = 31.46, p < 2 × 10^−16, Cohen’s f = 0.44; 634 nm: F(7,1144) = 2.048, p = 0.0464, Cohen’s f = 0.10).
For bioactive compound screening, the initial screen of 4240 compounds was conducted across 14 microplates (n = 352 wells per plate, excluding columns 1 and 24). Hit selection utilized Z-scores (Z ≥ |2.5 | ), identifying 59 high-OD750 hits (top 1.4%) and 87 low-OD750 hits (bottom 2.1%). The control data showed minimal skew (−0.01) with high kurtosis (8.61). For the second round, 146 hits were tested in triplicate (n = 3 plates, 132 control wells per plate). Round 2 control data showed positive skewness (1.29) and kurtosis (6.09), reflecting growth dynamics where low values are bounded by zero growth while high values can vary significantly. Hits were identified using one-tailed normal probability tests comparing each well to plate-specific control distributions (p ≤ 0.1 in ≥2 replicates). Gradient testing of hits showed significant concentration-dependent effects for key compounds including gossypetin (F(15,279) = 11.7, p < 2 × 10^−16, Cohen’s f = 0.79). Final validation in flask format confirmed significant increases with both 10 µM (Welch’s t-test, t(3.74) = −3.67, p = 0.024, Cohen’s d = −3.00) and 20 µM gossypetin (t(3.48) = −10.57, p = 0.0009, Cohen’s d = −8.63).
Throughout demonstration use cases (antibiotic testing, medium optimization, and bioactive molecule screening), positions on microplates were randomized to mitigate positional effects. Optimization experiment sample sizes were determined through power analysis using JMP 16 software. Otherwise, statistical methods were not used to predetermine sample size, as this was dictated by system throughput. No data were excluded from the analyses. All code and data are available at https://github.com/hallamlab/lighting_system_design_2024/.
Data analysis and visualization
Data from the PHERAstar FSX and Varioskan LUX plate readers were processed using an in-house Python script (see PHERAstar_standard_data_processing.py in the Supplementary Data), which consolidates the raw measurements into standardized data frames. All subsequent data transformations, statistical analyses, and visualizations were performed in R (version 4.3.2) using base functions, packages from the Tidyverse collection, and several additional libraries102. Associated R scripts and data can be found at https://github.com/hallamlab/lighting_system_design_2024/.
Reporting summary
Further information on research design is available in the Nature Portfolio Reporting Summary linked to this article.


Responses