An integrated perspective on single-cell and spatial transcriptomic signatures in high-grade gliomas

Introduction
High-grade gliomas (HGGs) are very aggressive malignancies with poor prognosis, both in adults and children. In 2016 and 2021, the World Health Organization classification considerably evolved, providing a complete histomolecular stratification of adult-type and pediatric-type HGGs, represented in two categories (Fig. 1)1,2, The most aggressive adult-type HGGs are classified as grade 4 isocitrate dehydrogenase (IDH)-mutant astrocytomas and IDH-wildtype (WT) glioblastomas (GBM)2, the latter being the most common primary brain tumor in adults3. Median age at diagnosis is 57 and 68 years respectively. Median survival only reaches 25 months for grade 4 IDH-mutant astrocytoma and 10 months for GBM4, despite standard treatments consisting of maximal surgical resection followed by radiotherapy with concomitant and adjuvant chemotherapy5. In comparison, pediatric-type HGGs comprise four molecularly-defined subtypes: diffuse midline glioma (DMG) H3 K27-altered (K27M mutation in histone H3F3A or HIST1H3B genes); diffuse hemispheric glioma, H3 G34-mutant (G34R/V mutation in H3F3A gene); diffuse pediatric-type HGG, H3-WT and IDH-WT; and infant-type hemispheric glioma2. Precise epidemiological data are scarce for these recently defined subtypes. In a comprehensive molecular meta-analysis of pediatric-type HGGs, median overall survival of 11 months in DMG H3.3K27M, 15 months in DMG H3.1K27M, 18 months in H3 G34-mutant and 17.2 months in H3-WT and IDH-WT were reported6. Currently, therapeutic strategies consist of surgical resection, when feasible, followed by radiotherapy with or without the adjunctive use of temozolomide, depending on the molecular subtype7.

Based on the tumor types included in the 16 selected studies, we distinguished three HGG subgroups: (1) H3K27M and (2) H3G34R/V, both presenting a histone H3 mutation and part of the pediatric-type HGGs in the last WHO CNS5 classification, and (3) H3 wildtype or not determined (H3 WT/ND), potentially including both pediatric- and grade 4 adult-type HGGs. This figure is inspired by the graphical abstract of Mackay et al., 2017.
A characteristic feature of both adult-type and pediatric-type HGGs is the complex heterogeneity, hindering therapies. Tumor heterogeneity roots in the coexistence of neoplastic cells and non-neoplastic cells that constitute the tumor microenvironment (TME)8. Variable levels of heterogeneity also characterize neoplastic cells themselves, with regard to genetics, epigenetics9 and transcriptomics. In this review, we chose to concentrate on transcriptomic studies which particularly evolved this last decade thanks to recent technologies such as RNA sequencing (RNA-seq)10. At the inter-patient level, pioneering studies highlighted diverse HGG subtypes, including the most known Verhaak et al. “Mesenchymal”, “Classical” and “Proneural” subgroups10,11, Years later, it appeared that these studies were only scratching the surface of the deep HGG complexity, with HGG transcriptomics evolving towards single-cell resolution. Single-cell RNA-seq (scRNA-seq) revealed specific gene expression signatures associated with different cell types, functions and states within one tumor12. More recently, spatial transcriptomics further allowed the analysis of RNA content linked to spatial information, emphasizing on specific niches and their peculiar gene expression patterns13. These crucial analyses represent a large amount of data and efforts, and together have improved the understanding of the highly heterogeneous nature of HGGs, paving the way to more adapted treatments. However, as separated studies, their practical implementation in HGG diagnosis, management and therapy has yet to be demonstrated.
Convinced about the pivotal role of transcriptomics in HGGs, we aimed to provide a review integrating recent studies addressing the transcriptomic intratumoral neoplastic heterogeneity in HGGs to strengthen individual observations and provide scientists in the neuro-oncology field with a hindsight vision of the recent literature. The numerous transcriptomic-based cellular states of cancerous HGG cells and their associated genes described in single-cell and spatial RNA-seq analyses were qualitatively aligned along a “reactive-developmental programs” axis, providing a clear overview at a single glance. To present a comprehensive picture of highly aggressive malignancies developing in the brain, we compared the molecularly distinct adult-type HGGs, referred to as H3 WT or not determined (H3 WT/ND), with pediatric-type DMG H3 K27-altered (H3K27M) and diffuse hemispheric glioma H3 G34-mutant (H3G34R/V), in order to report similarities and disparities. We also discussed some internal and external cues behind cellular states dynamics, the new insights into HGG spatial organization and the perspectives in clinics. Beside our reviewing work, we proposed a new vision on cellular state evolution.
Methods
Study selection criteria
We selected 17 scRNA-seq and spatial RNA-seq studies addressing HGG heterogeneity, that were published after the Patel et al.’ 2014 pioneering paper. Each of the chosen papers proposed novel, original gene expression signatures of the neoplastic cells in adult-type and/or pediatric-type HGGs (Supplementary Table 1). Transcriptomic signatures from the cells of TME were not considered in this review.
Alignment of gene expression signatures
In most of the selected studies, authors confronted their emerging neoplastic transcriptomic signatures to previously described ones, to highlight similarities or deviations. Based on these explicit correlations, we qualitatively integrated and arranged 51 cellular states across a color panel that spreads over two major “programs” (reactive and developmental) and integrates three main “cell type” categories (mesenchymal, astrocytic and proneural), strongly in line with the Richards14 and Verhaak10,15, classifications, respectively (Fig. 2).
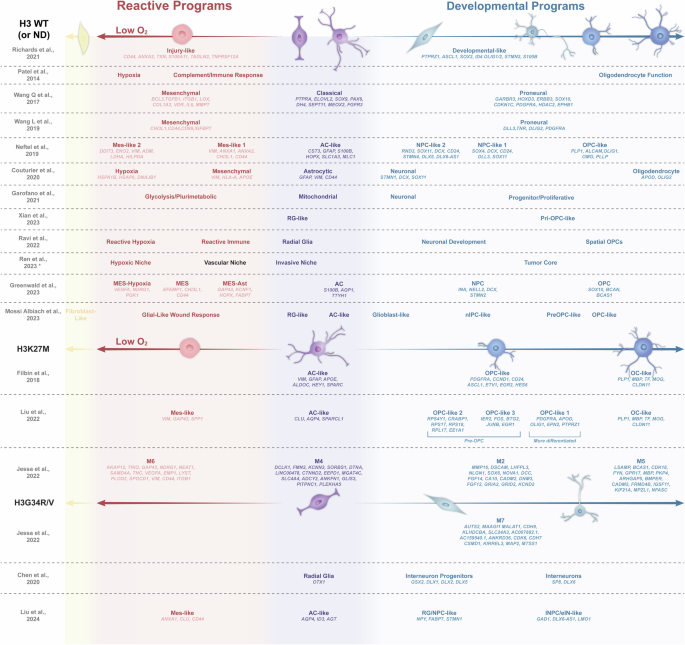
This figure presents an arrangement of transcriptomic signatures derived from recent studies utilizing single-cell RNA-seq and spatial RNA-seq. Following the framework proposed by Richards et al. 2021, the figure is divided into two main panels: a red left panel representing reactive programs and a purple/blue right panel for developmental programs. The figure is then categorized based on the histone H3 status: wild-type or not determined (H3 WT/ND) (top), H3K27M mutant (middle), and H3G34R/V mutant (bottom). Genes considered as relevant by the authors (i.e., included in the heatmaps from the original papers) are indicated below their respective signatures. *Also in H3K27M tumors.
Comparison of gene lists
We also sought to provide a clear overview of the most representative genes, expressed by the different cellular states. We listed the genes highlighted for each subgroup in the heatmaps from the original articles (Fig. 2). In addition, we collected the complete lists of genes associated with the different signatures described respectively for H3 WT/ND tumors and for H3K27M tumors, when available (Supplementary Table 2). These gene lists were compared using the Venn diagram tool of Bioinformatics and Evolutionary Genomics (https://bioinformatics.psb.ugent.be/webtools/Venn/). Based on the three main “cell type” categories (mesenchymal, astrocytic and proneural), genes that were common to at least three lists of the same category and not concurrently present in the mesenchymal and the proneural categories were retained. We further subgrouped the cellular states to best represent the diversity of signatures described in the chosen studies. Mesenchymal signatures were grouped into “hypoxia” and “immune” for H3 WT/ND tumors. Astrocytic signatures remained as a group. Proneural signatures were segregated into “neural progenitor cell (NPC)” and “oligodendrocyte progenitor cell (OPC)” groups for H3 WT/ND tumors, and into “OPC” and “oligodendrocyte cell (OC)” groups for H3K27M tumors. For each gene retained, the percentage of positive lists among those comprised in each subgroup was calculated and displayed in heatmaps (Fig. 3, Supplementary Tables 3 and 4). It must be noted that these gene lists result from different methodological approaches. Different tissue sources and sampling, sequencing technologies and bioinformatic analyses (Supplementary Table 1) may finally bring out different gene sets. The aim of the comparison is not to establish new signatures, but to highlight genes that overlap in similar signatures described by different groups beyond technical disparities, as those genes may rightly constitute representative and systematic markers of cellular states.
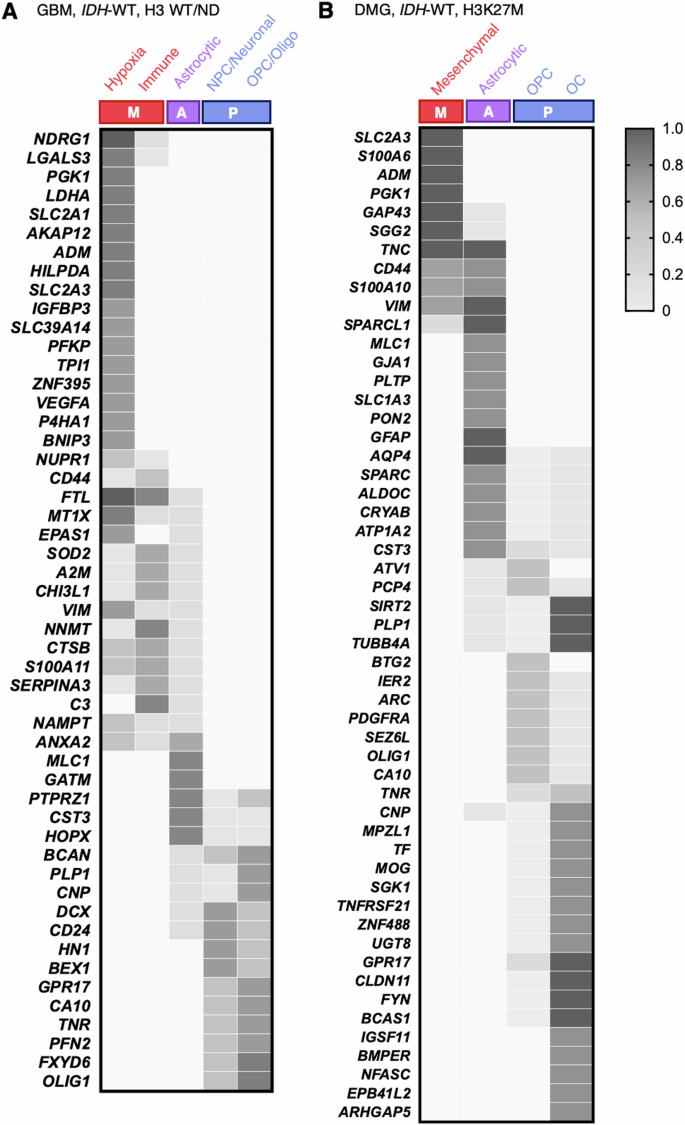
Complete gene lists available in 9 RNA-seq studies were analyzed using the Venn diagram tool from Bioinformatics and Evolutionary Genomics. Common genes, excluding mesenchymal and proneural overlaps, were selected. The presence of each retained gene across lists was calculated and depicted in heatmaps. A The heatmap showcases pivotal genes in hypoxia, immune response, astrocytic, NPC/neuronal, and OPC/oligodendrocyte signatures in H3 WT/ND HGGs ( = GBMs). B The heatmap displays key genes in mesenchymal, astrocytic, and OPC signatures in H3K27M HGGs ( = DMGs). The coverage of a retained gene is depicted from 0 (white) to 100% (gray) in the heatmaps. M Mesenchymal family, A Astrocytic family, P Proneural family.
Integrated view of the selected HGG gene expression signatures
Reactive and mesenchymal signatures were identified by several scRNA-seq analyses of HGG tissue, in line with what was previously described at the intertumoral level. These signatures are displayed in the left part of the proposed “reactive-developmental programs” axis (Fig. 2: red panel). In addition, scRNA-seq has unveiled transcriptomic signatures that resemble different stages of the developmental brain. These signatures are depicted in the right side of the axis (Fig. 2: blue panel). In the following sections, we discuss the similarities among signatures, including the overlap of genes, and the relevance of integrating them in the global perspective of tackling the complex HGG biology.
Reactive Programs – Mesenchymal profile, hypoxia and immune response
In H3 WT/ND HGGs, Wang Q. et al. described a single-cell transcriptomic subtype, designated as “Mesenchymal” reminiscent of the bulk classification from Verhaak et al.10. This subtype was associated with BCL3, TGFB1, ITGB1, LOX, COL1A2, VDR, IL6 and MMP7 expression15. Shortly later, two studies described a similar axis along which different GBM cellular states were distributed from reactive to developmental programs. The reactive cluster from Wang L. et al. was associated with CD44 and CHI3L1 expression and is designated as “Mesenchymal”, like the previously described subtypes. It overexpressed hypoxia and inflammatory-related genes such as HIF1a, CSF1, CCL2 and CXCL216. Likewise, the “Injury Response” program described by Richards et al. was associated with high expression of mesenchymal, inflammatory and immune-related genes such as CD44, ANXA2, TXN, S100A11, TAGLN2 and TNFRSF12A14.
Other studies distinguished two reactive subgroups. Patel et al. described a “Hypoxia” meta-signature and a “Complement/Immune Response” meta-signature12. In 2019, Neftel et al., described two mesenchymal meta-modules named “Mes-like 1” and “Mes-like 2”, both expressing genes considered as mesenchymal-like, e.g. VIM. “Mes-like 2” module was also associated with hypoxia related genes such as HILPDA and ADM, in addition to stress and glycolysis associated genes such as DDIT3, ENO2 and LDHA. In comparison, “Mes-like 1” signature was hypoxia-independent and was associated with the expression of ANXA1, ANXA2 and CD4417. The “Mes-like” subtypes were later correlated with the epithelial-mesenchymal transition, the hypoxic response and the interferon-gamma response, confirming the relationship between reactive states and hypoxia or inflammation18. In 2020, Couturier et al. also described two groups that could be compared to these reactive programs: the “Hypoxia” group associated with hypoxia responsive genes (HSPA1B, DNAJB1 and HSP6A) and the “Mesenchymal” group associated with high expression of VIM, HLA-A and APOE19. In comparison with these studies that clustered GBM cells based on sole gene expression, Garofano et al. provided cancer cell clustering based on pathways. They highlighted a “Glycolytic/Plurimetabolic” signature associated with mesenchymal transformation, immune response and hypoxia, and strongly correlated with other mesenchymal signatures, suggesting a preference for glycolytic pathways in reactive programs. In addition, their signature was correlated with lipids, amino acids, steroids, iron and sulfur metabolism20.
Recently, spatial transcriptomics provided new insights on the spatial distribution of cells with different gene expression profiles. In line with previous studies, Ravi et al. revealed two spatially distinct transcriptomic signatures named “Reactive Hypoxia” and “Reactive Immune” in H3 WT/ND HGGs13. Ren et al. performed another spatial transcriptomic study in H3K27M DMG and H3 WT/ND HGG patients. They described one main reactive subgroup named “Hypoxic Niche” associated with hypoxia and stress response related genes (Supplementary Table 2), as well as another spatial signature named “Vascular Niche”, associated with vasculogenesis and endothelial cells. This group was more difficult to classify, but partially correlated with the “Reactive Hypoxia” and “Reactive Immune” subgroups from Ravi et al. 21.
Greenwald et al. further segregated the mesenchymal/reactive states into three subgroups: “MES-Hypoxia” associated with a hypoxic signature (VEGFA, NDRG1 and PGK1), “MES” associated with EFEMP1, CHI3L1 and CD44 expression and “MES-Ast” (Astrocytic-like Mesenchymal) associated with glioma tumor microtubes related genes (GAP43, KCNF1 and PTN)22. Similarly, another study from their research group integrating different scRNA-seq datasets had also suggested several mesenchymal subgroups associated with hypoxia and glycolysis, with astrocytes and immunity and finally, intermediate states, suggesting a strong association between the reactive states and the microenvironment and a possible progression from one reactive state to another23.
Using enhanced electric single molecule fluorescence in situ hybridization, Mossi Albiach et al. observed reactive states that correlated with the “Mes-like” signature from Neftel et al. Noteworthy, they requestioned the commonly used “mesenchymal” term and rather preferred the term “Glial Wound-Like” that better reflects wound healing activation and hypoxic response in glioma cells24. In contrast, they uncovered a rarer “Fibroblast-like” malignant cell subgroup expressing fibroblast markers, e.g. collagens type I (COL1A1, COL1A2) and III (COL3A1, DCN, and LUM), which they considered as a mesenchymal state per se24.
Altogether, reactive programs have been identified in most H3 WT/ND HGG tumors and can be further segregated in response to hypoxia and to inflammation/immune response, with a panel of intermediate states proposed in few studies. Figure 3 displays the genes associated with the main different programs. For example, hypoxia-responsive and glycolytic genes such as NDRG1, PGK1, LDHA, ADM, HILPDA and VEGFA are representative genes commonly found in hypoxic signatures whereas genes such as CD44, FTL, CHI3L1, VIM and ANXA2 seem to be associated with reactive signatures in general.
In comparison, reactive programs are rare in pediatric HGGs. In 2018, the pioneering scRNA-seq study from Filbin et al. on H3K27M HGGs did not uncover a reactive state25. However, few years later, a re-analysis of their dataset highlighted the presence of so-called mesenchymal states. These were mostly associated with an astrocytic and immune signature, rather than to a hypoxic response23. In parallel, Liu et al. performed scRNA-seq on a wide cohort of both adult and pediatric patients with H3K27M DMGs and unveiled a subset of malignant cells presenting a “Mes-like” signature associated with the expression of VIM, GAP43 and SPP1. This program was enriched in adult patients, compared to young children26. Moreover, Jessa et al. uncovered a “M6”-coded module, which was partially associated with hypoxia in a large cohort of H3K27M DMGs27. Of note, the aforementioned Ren et al. “Hypoxic Niche” signature was also highlighted in H3K27M HGGs21. Some representative genes are common to H3 WT/ND and H3K27M HGGs, such as SLC2A3, ADM, PGK1, CD44, VIM and SPARCL1 (Fig. 3).
A “Mes-like” program associated with the expression of ANXA1, CLU and CD44 was recently described by Liu et al. in H3G34R/V HGGs. The proportion of Mes-like cells was described as very heterogenous across patients, with these cells undetected in some tumors, potentially explaining the discordance between studies28.
In summary, the reactive cellular states appear more enriched in H3 WT/ND HGGs than in H3K27M and H3G34R/V HGGs and were mostly associated with immune and hypoxic responses, with variations depending on sample types and methods. The diversity of these cellular states, their dependence to multiple external influences as well as their actual origin remain to be untangled.
Developmental Programs – Astroglial, oligodendroglial and neural-like signatures
Developmental signatures associated with astrocytic, neuronal and oligodendroglial fates were also described in HGGs. They are presented in the middle-to-right part of the “reactive-developmental programs” axis (Fig. 2: purple-to-blue panel), aligned to the “Developmental-like” program proposed by Richards et al. opposite to the “Injury response” program. The “Developmental-like” program was associated with the expression of genes implicated in neurogenesis and gliogenesis, such as PTPRZ1, ASCL1 and SOX214, also consolidated in the “Proneural” program from Wang L et al. expressing ASCL1 and OLIG216. Additional investigations have delineated more detailed developmental signatures associated with astrocytic, neuronal and oligodendroglial fates.
Astrocytes, oligodendrocytes and neurons are the major cell types that are mostly generated during the embryonic brain development. They arise from specialized, quiescent neural stem cells named radial glial (RG) cells that divide to generate lineage-restricted progenitors, including NPCs and OPCs, which evolve through different differentiation steps to finally give rise to mature neurons and glial cells29.
Astrocytic and radial glia signatures
In H3 WT/ND HGGs, Neftel et al. identified a subgroup named “Astrocyte Cell (AC)-like” expressing astrocytic markers such as GFAP, S100B and MLC117, and Couturier et al. described an “Astrocytic” group, mostly associated with astro-mesenchymal genes such as GFAP, VIM and CD4419. Interestingly, VIM and CD44 were commonly expressed in reactive signatures (Fig.3), showing that astrocytic-like cells could display some reactive features. Despite small disparities, both subgroups strongly correlated with the “Classical” group previously described by Wang Q et al. associated with high expression of PTPRA, ELOVL2, SOX9, PAX6, DH4, SEPT11, MEOX2 and FGFR315. Based on spatial transcriptomics, Mossi Albiach et al. and Greenwald et al. also described “AC-like” subgroups reminiscent of the Neftel et al.’ signature, and respectively associated with the expression of CLU, AQP4, ITM2C, S100B, CRYAB24 and S100B, AQP1, TTYH122.
Moreover, the pathway-based single-cell study proposed by Garofano et al. highlighted a cellular group associated with “Mitochondrial” functions, e.g. oxidative phosphorylation (OXPHOS). This group showed a preferential correlation with the Neftel “AC-like” state, suggesting that OXPHOS programs, while not restricted to one cellular state, are enriched in astrocytic signatures20. In another pathway-oriented study, OXPHOS was surprisingly inversely correlated with the “AC-like” state, then requestioning this association18.
“AC-like” cellular states were also described in H3K27M DMGs by Filbin et al. and Liu et al., who respectively characterized this state based on VIM, GFAP, APOE, ALDOC, HEY1, SPARC and CLU, AQP4, and SPARCL1 gene panels25,26, In their study, Jessa et al. introduced a “M4” module that overlapped with the astrocytic signature27.
In H3 WT/ND HGGs, Xian et al. described a “RG-like” cellular state defined by the expression of VIM and SLC1A330 in line with the initial discovery of these RG-like cells transcriptionally resembling RG cells from non-tumoral fetal brains. The presence of these cells, expressing PTPRZ1 as a main marker confirms the possible reactivation of developmental programs in HGGs31. These “RG-like” cells closely relate to astrocytic signatures and share some marker genes with mesenchymal states, explaining their intermediate position in the “reactive-developmental programs” axis (Fig. 2). Mossi Albiach et al. also introduced a “RG-like” subgroup associated with the expression of SOX2, NES and VIM24.
Spatial transcriptomic studies further supported the presence of these cellular subgroups in HGGs. Ravi et al. described a “Spatial RG” subtype associated with the expression of HOPX and PTPRZ1, which strongly overlapped with “AC-like” states13. Ren et al. uncovered an “Invasive Niche” correlating with the “Spatial RG” group from Ravi et al. in both H3 WT/ND HGGs and H3K27M DMGs. They identified a high proportion of RG-like cells in this niche, suggesting a role of this cellular subtype in tumor invasion21.
In H3K27M DMGs, the RG subtype was not initially identified. However, Ren et al. further discovered the presence of RG-like cells in these tumors with a deeper analysis of the previously established dataset from Filbin et al. They identified a cluster associated with a “RG-like” signature and showed its strong correlation with “astrocyte-like” and “mesenchymal-like” signatures21. Finally, in H3G34R/V HGGs, Chen et al. showed an enrichment of “Radial Glia” programs associated with the expression of OTX132, while Liu et al. described an “AC-like” program associated with the expression of AQP4, ID3 and AGT28.
All these findings suggest that a subset of HGG cells appear molecularly close to differentiated astrocytes, but also to RG cells, which speak for more “embryonic-like” transcriptomic profiles and related functional aspects, e.g., cell motility/invasion that are of high relevance in a therapeutic perspective.
Neuronal and oligodendroglial signatures
In 2014, Patel et al. were the first to describe a group associated with “Oligodendrocyte Function” at the single-cell level, without detailing this signature12. In 2019, Neftel et al. introduced refined signatures associated with OPCs and NPCs in H3 WT/ND HGGs. The “OPC-like” subgroup was associated with the expression of oligodendroglial genes, e.g. PLP1, ALCAM, OLIG1, OMG and PLLP. The “NPC-like” signatures were further segregated into two subgroups. Both were associated with the expression of NPC markers such as DCX and SOX11, but the “NPC-like 1” subgroup also included OPC-related genes, while the “NPC-like 2” subgroup was rather linked to neuronal genes, such as STMN4, DLX5 and DLX6-AS117. These signatures correlated with the more general subgroup previously described by Wang Q. et al. named “Proneural”, represented by the expression of genes such as GARBR3, HOXD3, ERBB3, SOX10, CDKN1C, PDGFRA, HDAC2 and EPHB115. Couturier et al. also proposed “Neuronal” and “Oligodendrocyte” signatures closely related to Neftel signatures as well as to the Wang “Proneural” subgroup. Representative genes of these signatures included STMN1, DCX and SOX11 for “Neuronal”, and APOD and OLIG2 for “Oligodendrocyte”19. Interestingly, the Garofano et al. pathway-based single-cell study also proposed corresponding subgroups. The first is the “Neuronal” signature mostly associated with neuron development and axonogenesis, and the second is the “Progenitor/Proliferative” signature associated with cell cycle progression pathways and neural stem/progenitor markers. Again, these two subgroups correlated with the Neftel “NPC-like” and “OPC-like” signatures and with the Wang “Proneural” subgroup20. Interestingly, the “Classical” group from Wang Q. et al. was also correlated with these signatures, probably reflecting a certain proliferative and stem-like state of this subgroup that may be due to the close relation between astrocytic states and RG-like profiles. More simply, Xian et al. described a “Pri-OPC-like” state associated with OPC markers such as PCDH15 and PDGFRA30.
Ravi et al. confirmed the presence of two transcriptomic spatial groups named “Neuronal Development” and “Spatial OPCs”, which correlated with Neftel “NPC-like” and “OPC-like” signatures13. These subgroups also correlated with the “Tumor Core” niche described by Ren et al. associated with gliogenesis-related genes such as ALDOC, OLIG2, PDGFRA, ASCL1 and SOX10. This last niche was described in both H3 WT/ND and in H3K27M HGGs21. Greenwald et al. also described “NPC” and “OPC” cellular states associated with INA, NELL2, DCX, STMN2 and SOX10, BCAN, BCAS1 respectively22. Mossi Albiach et al. proposed more specific subgroups designated as “Glioblast-like”, “Neural IPC-like”, “PreOPC-like” and “OPC-like” states, even suggesting a greater complexity24.
In contrast to H3 WT/ND HGGs, only oligodendroglial signatures were described in H3K27M DMGs, and these were further separated in “OPC-like” and “OC-like” as firstly described by Filbin et al. “OPC-like” state was associated with the expression of PDGFRA, CCND1, CD24, ASCL1, ETV1, EGR2 and HES6, while “OC-like” state was associated with oligodendrocyte differentiation-related genes such as PLP1, MBP, TF, CLDN11 and MOG25. Similarly, Jessa et al. described “M2” and “M5” modules that strongly correlated with OPC and oligodendrocyte lineages, respectively27. Liu et al. also described “OPC-like” and “OC-like” states with the exception that they further subdivided the “OPC-like” group into three subgroups. “OPC-like 1” was associated with a more differentiated OPC state and the expression of genes such as EPN2, while “OPC-like 2 and 3” were more associated with pre-OPC state. “OPC-like 2” was associated with ribosomal proteins related genes such as RPL17 and RPS18 whereas “OPC-like 3” was more associated with the expression of immediate early response genes such as JUNB and EGR126.
In comparison, H3G34R/V HGGs seem to be composed of distinct cell states, without oligodendroglial signatures, but rather with neuronal signatures. Jessa et al. unveiled a “M7” neuronal associated module27. Chen et al. described populations of cells associated with an “Interneuron progenitor” signature, enriched in genes such as GSX2, DLX1, DLX2 and DLX5, and an “Interneuron” signature associated to SP8 and DLX632. Liu et al. also observed two transcriptomic programs correlated to less and more differentiated states of GABAergic interneurons. They described a “RG/NPC-like” state associated with the expression of NPY, FABP7 and STMN1, and a “INPC/eIN-like” state associated with the expression of GAD1, DLX6-AS1 and LMO128.
In conclusion, these neurodevelopmental signatures substantially differ between HGG subtypes. H3 WT/ND HGGs contain more NPC and OPC-like cells, while H3K27M DMGs are enriched in oligodendroglial signatures segregated in multiple subgroups going from pre-OPCs-like cells to more differentiated OC-like cells. Some OPC-related genes are common to both tumor types such as PLP1 and OLIG1. In H3 WT/ND HGGs, NPC- and OPC-like signatures share many genes, whereas in H3K27M DMGs, IGSF11, BMPER, NFASC, EPB41L2 and ARHGAP5 seem to be specific of OC signatures (Fig.2). In contrast, H3G34R/V HGGs are rather enriched in neuron- and interneuron-like signatures.
Gene expression signatures associated to the cell cycle
Most scRNA-seq studies also described “Cell Cycle” associated gene expression patterns. Proliferation status is inferred from the expression of numerous genes, forming distinct transcriptomic clusters. Depending on the authors’ choice, cell cycle clusters were retained as specific modules or not. Patel et al., Filbin et al., Jessa et al. and Liu et al. 2024 presented a “Cell Cycle” signature associated with genes such as TOP2A and CDK112,25,27,28, Greenwald et al. also suggested a “Proliferation and Metabolism” subgroup associated with the expression of TP53, CTNNB1, CNTD1 as well as SLC16A1, GGCX and PHGK122. Neftel et al. Couturier et al. and Liu et al. further clustered the cycling cells into two groups, corresponding to “G1/S” phases and the “G2/M” phases17,19,26,
Among tumors, only a small, though varying proportion of cancer cells are cycling. The vast majority of proliferating cells were observed to be progenitor-like cells17,19,21,22,24,25,33, This was mainly the case in H3K27M and H3G34R/V HGGs, in which proliferating cells were mainly restricted to OPC-like cells25,26, and NPC-like and INPC-like cells28 respectively. In H3 WT/ND HGGs, cycling cells were found in all cellular states17. Interestingly, hypoxia signatures and neuronal niches appeared inversely correlated with cell cycle, suggesting a diminution in proliferating cells in these areas12,13,20,
Based on these observations, it appears that cell cycle related transcriptomic signatures are not mutually exclusive from reactive-developmental signatures. Integrating the cell cycle as a second-dimension axis, as proposed by Wang L. et al. would therefore be more insightful (Fig. 4)16. In H3 WT/ND HGGs, in which each major cellular state has the potential to proliferate, it has been suggested to further divide Neftel subtypes into “Non-Proliferating vs Proliferating” Mes-like/AC-like/OPC-like/NPC-like profiles33,34,35, In comparison, Filbin subtypes in H3K27M DMGs could be distinguished into “Non-Proliferating vs Proliferating” OPC-like states, though this distinction would not apply to AC-like/OC-like/Mes-like cells that were all described as “Non-Proliferating”34.
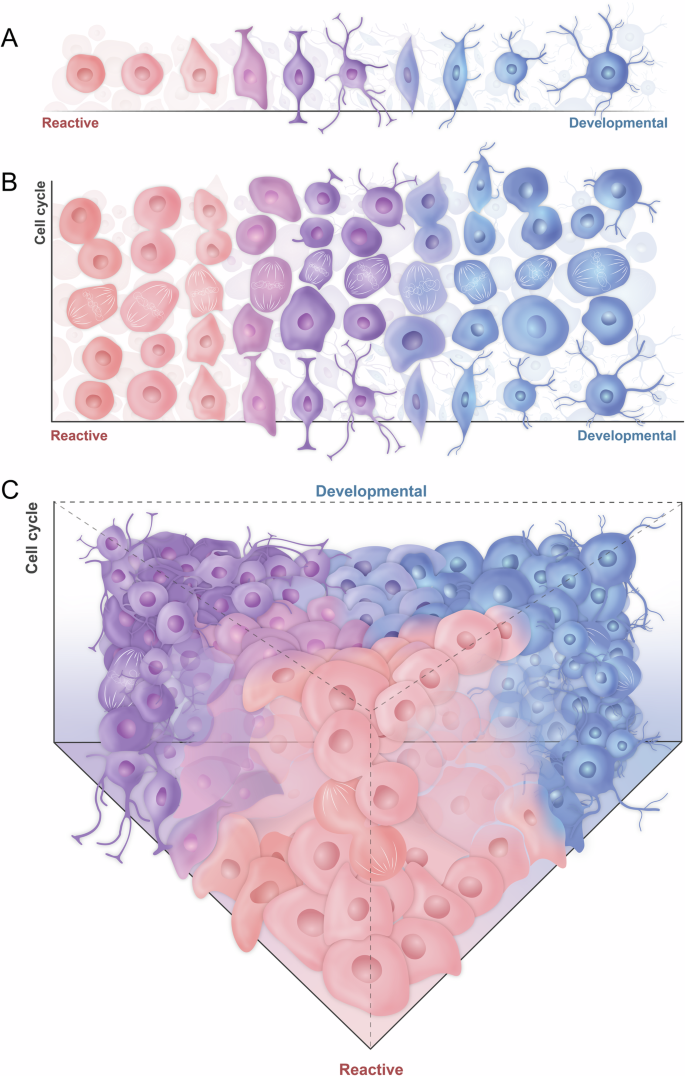
A One-dimension HGG cell state distribution along reactive-developmental programs (based on Richards et al.). B Integration of a cell cycle second dimension to the reactive-developmental HGG cell states (inspired from Wang L et al.). C Tridimensional view on HGG cell states along developmental programs (dimension 1) with different proliferation potential (dimension 2) and capable of evolving towards a reactive state (dimension 3, inspired from Mossi Albiach et al.).
Intrinsic determinants of HGG cell plasticity
Cellular states are not static but rather highly plastic, especially in H3 WT/ND HGGs17. These states are dynamically responsive to multiple intrinsic and extrinsic signals that induce specific state transitions, but also determine the preferential transcriptomic state of a cell within the tumor.
Major genetic alterations correlate with the predominant malignant cell subtype constituting the tumor. In H3 WT/ND HGGs, at the bulk level, “Proneural” tumors were associated with PDGFRA alterations, “Classical” tumors with EGFR amplification or mutation and CDKN2A homozygous deletion and “Mesenchymal” tumors with NF1 and PTEN deletion10. At the single-cell level, tumors predominantly “AC-like” were similarly associated with EGFR amplification, “OPC-like” with PDGFRA amplification, “NPC-like” with CDK4 amplification and “Mes-like” with NF1 mutation17. Some genetic alterations were also correlated with the pathway-based cellular signatures, PTEN, RB1 and NF1 being often altered in the “Glycolytic/Plurimetabolic” subgroup, NRAS and CDK4 in the “Mitochondrial” subgroup, ATRX and TET1 in the “Neuronal” subgroup and, finally, PDGFRA and EZH2 in the “Progenitor/Proliferative” subgroup20. In addition, genetics may influence general spatial organization of the tumor24.
Epigenetics also influences the cellular plasticity within one tumor17. In H3 WT/ND HGGs, cells can harbor different DNA methylation profiles that could be correlated with Neftel “NPC-like” and “OPC-like” signatures, or “AC-like” and “Mes-like” signatures, suggesting that stem-like (NPC/OPC) and differentiated-like (AC/Mes) tumor cells harbor distinct DNA methylation profiles. For example, DNA hypomethylation of polycomb repressive complex 2 (PRC2) targets, linked to the upregulation of these genes, was a hallmark of stem-like state cells, compared to more differentiated cells36. It was also shown that DNA methylation diversity was associated with early genetic alterations and cellular states, suggesting that epigenetics likely relates genetics and cellular states37. In H3K27M DMGs, the DNA hypomethylation also modulated PRC2 activity downstream gene expression, which may favored the “OPC-like” state enrichment as well as the biased evolution towards “AC-like” state25.
Extrinsic determinants of HGG cell plasticity
Immune cell interactions
The tumor microenvironment (TME) also plays a crucial role on malignant cellular states. Immune cells represent a considerable percentage of the cells composing the tumor, both in adult-type and pediatric-type HGGs18,35,38,39, with myeloid cells as the most abundant. Spatial analysis and inferred ligand-receptor interactions have shown that cancer cells are able to interact mostly with these myeloid cells, compared to lymphoid cells18,35, In the brain, the myeloid compartment can be further divided into tumor-associated macrophages (TAMs) derived from microglia, TAMs from blood-derived monocytes, neutrophils, and dendritic cells. The lymphoid compartment encompasses B cells and T cells. The latter are composed of the NK cells, CD4+ and CD8+ T cells. Based on scRNA-seq studies, those immune cell types can be further subdivided into different clusters based on their function which can be more pro-tumorigenic or anti-tumorigenic35.
Mesenchymal/reactive tumors have been strongly associated with immune cells. Tumor purity analysis demonstrated an increase in TME cells in “Mesenchymal”15 and in “Glycolytic/Plurimetabolic” H3 WT/ND HGG groups20, these signatures being associated with high infiltration of neutrophils and macrophages15,20, In spatial transcriptomic studies, reactive niches showed an increase in tumor-associated myeloid cells and T cells13. Furthermore, mesenchymal recurrences from non-mesenchymal newly-diagnosed tumors were associated with an increase in immune cells15. It was shown that mesenchymal-like neoplastic cells are more associated with monocyte-derived TAMs with an anti-inflammatory and pro-angiogenic profile in the tumor core, while microglia-derived TAMs with a pro-inflammatory profile are found in the tumor edge and the infiltrating regions23,40,41, Moreover, mesenchymal-like neoplastic cells were shown to be associated with T cells expressing markers of activation and cytotoxicity23,42, A specific mesenchymal-like profile in TAMs was also observed in the H3 WT/ND tumors with the expression of genes associated with the epithelial-mesenchymal transition and hypoxia18,35,42, Whether immune cells orient cancer cell states, and/or vice-versa remains to be untangled. It was shown that immune cells were able to induce “Mes-like” signatures in vivo and in vitro, through the secretion of oncostatin M by TAMs, which then interacts with its receptor on cancer cells42,43, Inflammatory cytokines also drove the expression of injury-like genes in developmental-like glioma cells, in vitro14. On the other hand, it was shown that mesenchymal-like tumors may have an impact on TAMs which would acquire a mesenchymal-like profile42, suggesting a crosstalk between neoplastic and non-neoplastic cells shaping the tumor.
It was also observed that the ratio of tumor-associated macrophages (TAMs) derived from monocytes compared to microglia increased in adult vs pediatric patients, suggesting that age-related alterations in the TME may correlate with the diversity of cell types/states among HGGs subtypes26. In pediatric HGGs, it was observed that microglia-derived TAMs increase with the mesenchymal-like cancer cell population size, compared to monocyte-derived TAMs38, suggesting different interactions from the adult-type HGGs.
Neuron-to-glioma synapses and network integration
HGGs form complex tumors that are deeply integrated in the brain. Glioma cells are influenced by neurons through paracrine signaling and neuron-to-glioma synapses. For example, release of glutamate influences the behavior of glioma cells expressing AMPA receptors, impacting tumor progression and invasion44,45,46,47,48,49, Both in H3 WT/ND and H3K27M HGGs, synaptic genes were enriched in “OPC-like” signatures and the synapses observed in in vivo models resemble synapses formed with normal OPCs45.
Glioma cells not only physically interact with neurons, but they were also shown to form functional networks with other glioma cells and astrocytes via microtube-associated gap junctions. Those networks strongly support treatment resistance50,51, The integration of glioma cells into networks was shown to be associated with specific transcriptomic states. In in vivo models, connected cells were enriched in the “injury response” signature from Richards et al. the “AC-like” and “Mes-like” states from Neftel et al. and the “glycolysis/plurimetabolic”, “mitochondrial” and “progenitor/proliferative” states from Garofano et al. In contrast, unconnected cells were more associated with the “developmental signature” from Richards et al. the “OPC-like” and “NPC-like” states from Neftel et al. and the “neuronal” state from Garofano et al. Those observations were confirmed on human datasets comparing the tumor core and the infiltration regions46.
Neuron-to-glioma synapses were mostly observed on unconnected cells, increasing their invasive capacities. Those unconnected cells were associated with neuronal and OPC-like states, confirming neuron interactions with those cell states45,46, Here again, these data show how cancer cell states, their functional behavior and the cellular interactions they are engaged in, are intermingled. It is yet to be known how and to what extent network integration and synaptic connections influence malignant cell transcriptomic states, and the other way around.
Recent insights in GBM organization and dynamic evolution
Thanks to basic histological techniques, it has been observed for years that HGGs harbor a heterogenous spatial organization linked to different TME features. Following the transcriptomic breakthroughs, there was a desire to better link fundamental observations to new cellular state concepts. In adult-type GBM, this led to the creation of the Ivy Glioblastoma Atlas project. Five distinct classical histological regions, defined as the leading edge, the infiltrating tumor, the cellular tumor, the pseudopalisading cells around necrosis and the microvascular proliferation, were microdissected from GBM biopsies and analyzed for genetic alterations and gene expression profiles. This project highlighted a strong link between classical anatomic features and transcriptomic profiles, which tended to be similar in corresponding histological features52. The Ivy Glioblastoma Atlas project is the precursor to spatial transcriptomics, allowing for transcriptomic analysis at the resolution of a few cells.
While the spatial organization of pediatric-type HGGs has yet to be better elucidated, recurrent organizational patterns were highlighted by these recent spatial transcriptomics approaches in H3 WT/ND samples. “AC-like” tumor cells were often localized near “OPC-like” and “NPC-like” malignant cells, whereas, “Mes-like” or “Reactive-like” tumor cells tended to cluster together, suggesting that the “reactive-developmental” cell state axis strongly tunes in on tumor spatial organization and environmental cues.
Interestingly, major spatial transcriptomics observations deepen the understanding behind classical histological features. Developmental states were usually located in proximity to blood vessels, while reactive states were further apart, with hypoxia-related reactive states being the most distant22,24, enriched in necrotic regions13. Based on these observations and spatial coherence tests, it was shown that the oxygen level strongly influences the spatial organization of tumors22,24,35, It was suggested that GBM organizes along the core-to-periphery axis. The tumor core was mostly composed of reactive tumor cells, with hypoxia-associated reactive cells located in the most hypoxic zones, and hypoxia-independent reactive cells located closer to blood vessels. These reactive cancer cells were associated with immunosuppressive monocyte-derived TAMs. In contrast, the tumor edge was well vascularized and rather included malignant cells with developmental profiles, more enriched in proliferating states, as well as microglia-derived TAMs22,24,53, Consolidating the differences along the core-to-periphery axis, a comparison between the transcriptomic signatures of the cells from the infiltrating tumor and the tumor core highlighted a decreased hypoxic signature in the infiltrating tumor compared to the tumor core and an enrichment in pro-inflammatory microglia compared to the tumor core which was rather enriched in anti-inflammatory and pro-angiogenic macrophages40. Of note, a few cells with developmental states were also shown to be locally associated with blood vessels in the hypoxic tumor core, further confirming a key role of the vasculature in GBM spatial structure24. This tumor organization dictated by the distance to blood vessels goes along with the single-cell pathway-based study, which showed how tissue organization orchestrates cellular states/profiles through metabolic regulation. The “Mitochondrial” signature associated with OXPHOS correlated mostly with “AC-like” but also “OPC-like” and “NPC-like” cells located close to oxygen supply, while the “Glycolysis/Plurimetabolic” group was associated with “Mes-like” cells distant from blood vessels20. Additionnally, spatially resolved metabolomics highlighted an enrichment in glycolysis pathways in “Reactive Hypoxia” cellular state located in necrotic zone compared to an enrichment in pentose phosphate pathways in the developmental states13.
Based on these spatial organization aspects, a dynamic evolution model of GBM was elaborated. It was suggested that developmental cell states, located at the highly oxygenated tumor edge, proliferate and participate to tumor expansion. As the tumor grows, oxygen levels drop down, which induces leaky blood vessels formation and triggers a chronic wound healing response in cancer cells that switch from developmental to reactive states, related to gradual hypoxia. In the hypoxic TME, recruited monocytes acquire a specific immunosuppressive TAM phenotype and participate to this reactive switch in malignant cells, that then reciprocally modulate TAM profile24. Supporting the dynamic evolution model, it was also suggested that developmental cellular state-based tumor growth induces hypoxia which leads to a metabolic switch in tumor cells towards glycolysis activating different adaptative responses such as invasion towards oxygenated regions13.
Notably, various subtypes of reactive states aligned with distinct developmental stages, indicating the potential transition from different developmental states into corresponding reactive states24. This intriguing perspective revises the two branches of the “reactive-developmental” axis into two interdepending dimensions (Fig. 4). This adjustment would better capture the plausible dynamic transitioning from developmental states to reactive states, in response to the multiple intrinsic and external influences from the TME cells and tissue niches. To what extent such a transition model is relevant to pediatric-type HGGs, in which reactive states have been scarcely described, remains to be discussed.
Clinical significance of HGG heterogeneity and transcriptomic states
Given the abundance of data accumulated in the past decade, it is crucial to consolidate the findings and grasp their clinical relevance. A thorough comprehension and integration of diverse transcriptomic and spatial signatures, as proposed in this review, is essential in this perspective. It is also crucial to understand how these signatures may be impacted by standard or new treatments, in order to effectively supplement and/or enhance these therapeutic approaches.
In GBM, associations between transcriptomic subgroups and prognosis appear limited. A potential trend towards improved survival in the bulk “Proneural” subgroup, although this observation may be due to an enrichment of IDH-mutant tumors in this group10. Patel et al. showed that an increased heterogeneity within proneural tumors correlated with a poorer prognosis. The mitochondrial subtype, as defined by Garofano et al., exhibited a favorable survival outcome20, whereas mesenchymal tumors were associated with decreased survival15. Despite these observations, the understanding of HGG transcriptomic profiles has not yet resulted on a clear modification of prognosis and patient outcome.
The landscape seems considerably more complex. The interactions between the different cellular states and with the TME components likely play an important role in determining tumor outcome. A recent paper highlighted a link between the spatial organization of transcriptomic subgroups and the prognosis. For instance, tumors enriched in AC-like cells clustering together, or tumors enriched in “OPC-like” cells interacting with hypoxia-associated Mes-like cells, were both correlated with a poorer prognosis. Conversely, tumors with an increased proximity of AC-like cells with other subtypes were associated with a decreased risk54. TME cells were also demonstrated to play a crucial role, with various transcriptomic clusters of myeloid cells exhibiting distinct prognostic associations. Some microglial clusters correlated with better survival, while some macrophage-related clusters were rather associated with a worse survival18. A higher T-cell abundance at recurrence was also associated with a better survival16.
How transcriptomic signatures translate towards clinical outcome is intricate and integrating (spatial) transcriptomic data into the practice could be challenging and costly. Nonetheless, some researchers have developed algorithms capable of determining transcriptomic subgroups and their organization on histological slides, offering a promising avenue for enhancing clinical routines with low-cost transcriptomic data integration54.
Gaining insight into the impact of existing treatments on tumor cells is crucial for optimizing therapeutic strategies. Between the newly-diagnosed GBM tumor and the recurrence, a switch in transcriptional state can occur15,53,55, revealing tumor adaptability to treatment. GBM recurrence was associated with an increase in the abundance of normal oligodendrocytes and Mes-like cells, and a decrease in AC-like cells53,55, Additionally, an increase in monocyte-derived TAMs accompanied by a decrease in microglia was observed53. Changes in the abundance of transcriptomic states strongly correlated with histological features, emphasizing connections between tumor cells and the TME55. Intrinsic mechanisms also contribute to transcriptomic state switches. Hypermutation induced by temozolomide correlated with an increase in proliferating stem-like cells. NF1 mutation as well as loss of EGFR or PDGFRA amplification at recurrence likely foster glioma cell transition to a mesenchymal state. Additionally, some recurrence-specific gene upregulations were highlighted within existing signatures. At recurrence, stem-like tumor cells exhibited a higher expression of neuronal signaling-related genes, in comparison with newly-diagnosed tumors, suggesting more interactions with neurons55.
About pediatric-type HGGs, recent advances have started leveraging the intratumoral heterogeneity of DMGs, here referred to as H3K27M HGGs. The imipridone molecule ONC201 has demonstrated notable efficacy in H3K27M HGG patients and is considered as the greatest recent breakthrough in the field56,57, A recent study used scRNA-seq to investigate the mechanisms underlying the action of ONC201 in H3K27M HGGs. Besides its activating effect on caseinolytic peptidase P and downstream impact on cell metabolism, ONC201 was shown to reduce the amount of cycling cells, impoverish “OPC-like” cells and shift up the number of cells with a differentiated, AC-like state58 (Filbin et al. signatures). These findings not only highlight the therapeutic potential of ONC201 in controlling H3K27M HGGs proliferative behavior, but also provide detailed insights into its influence on cell differentiation at the molecular level.
Altogether, ongoing efforts to better comprehend transcriptomic signatures, their association with prognosis, control over cellular states, and their response to treatments are pivotal for advancing the field towards new frontiers. Noteworthy, the fact that HGG cell states differentially include coexisting proliferative and non-proliferative components calls for a reexamination of current antitumor therapies, that so far mostly target cycling cells irrespective of the glioma subtype.
Discussion and conclusion
RNA-seq has revolutionized the understanding of HGG biological complexity, highlighting HGG intertumoral and more recently, intratumoral heterogeneity and its dynamics. Different cellular states defined by specific transcriptomic signatures co-exist within one tumor, suggesting different functionalities and vulnerabilities. Cells can transit between these states, underlying the multifaceted functioning of HGGs. Here, we integrated 55 single-cell and spatial transcriptomic signatures recently described in H3 WT/ND tumors, mainly corresponding to GBM, and in H3-altered pediatric-type gliomas, divided into H3K27M and H3G34R/V tumors. We provided a comprehensive overview of these cell signatures by aligning them according to a “reactive-developmental programs” axis, inspired from Richards et al. study and describing the associated key genes. With our approach, we opted for a qualitative comparison of gene expression signatures as they are depicted in the original papers, keeping in mind that a genuine reanalysis of the original data may strengthen this alignment. We listed the genes that relate to these signatures with their degree of overlap, that result in simplified, combined gene sets that may further help streamlining the assessment of HGG intratumoral heterogeneity.
The integrated sketch of these various HGG transcriptomic profiles highlights the similarities and differences among HGG subtypes. H3 WT/ND HGGs are very heterogenous, possibly containing a mixture of reactive-like cells associated with hypoxia or immune activation, and developmental-like cells rather resembling normal CNS cells. In contrast, H3K27M HGGs are more enriched in these developmental states, especially “OPC-like” and “OC-like”, with very few reactive states. Finally, H3G34R/V gliomas are more associated with interneuron fate. As H3K27M and H3G34R/V HGG subclassifications were only recently introduced, the incidence of H3-altered tumor types has likely been under-estimated these last years, as they were probably included in the H3 WT/ND studies by default. Currently, very few data for H3G34R/V tumors are available compared to other HGG subtypes, and further investigation could uncover new specific cellular states. Of note, other parameters influence the tumor cell composition such as the patient age, and the tumor location. A full-scale picture of each considered tumor sample is a requisite for the proper interpretation of its composition and profile.
A second dimension of heterogeneity, added to the “reactive-developmental” states, is linked to the cell cycle. Although proliferating signatures are more abundant in “stem-like” developmental cell subtypes, all cellular states are endowed with proliferative potential in GBM, while in H3K27M DMG, only “OPC-like” cells can be proliferative.
This two-dimensional heterogeneity taken together with recent indications on the spatial tumor organization highlighted new hypotheses to explain GBM dynamics and implies that developmental states may evolve toward reactive parallels in an interdependent dimension. It can therefore be postulated that reactive states may represent a third axis of cellular heterogeneity, interdependent with the first developmental axis (including stem-like and more differentiated neural or glial cells) and the second cell cycle axis (from non-proliferating to proliferating).
In this review, we chose to concentrate on the transcriptomic diversity of neoplastic cells, which already represents a very intricate picture of HGGs. However, HGG heterogeneity is far more complex, beginning in the tumor itself, where cancerous cells coexist with cells from the TME. These non-neoplastic cells also play a crucial role in HGG biology, and it is important to note that several studies have also taken advantage from recent advances in transcriptomic technologies to better elucidate the transcriptomic diversity and functionality of the cells from the TME, enlarging the possibility for clinical translation59,60,61, It is proven that glioma cells interact with various cell types such as immune cells, neurons or even other glioma cells, possibly influencing their transcriptomic state. Immune cells tend to influence a mesenchymal-like transition, whereas interactions with neurons are more associated with OPC-like or NPC-like states. How exactly the cancer cell states are influenced by the interactions with the TME remains to be further elucidated.
In conclusion, this review proposes an integrated, harmonized and evolutive vision on HGG intratumoral heterogeneity. This integration of 17 recent studies further empowers their individual message and shows how the HGG cell types and states align and can dynamically evolve along three axes representing neurodevelopmental diversity, reactive profiles and cell cycle activity. Better apprehending HGG heterogeneity during tumor progression as well as the impact of current treatments will forge the path towards adjusted therapeutic modalities and ultimately improve patient outcome.
Responses